Upwards movement was expected to continue. Price made a slight new high and Friday completed a small green candlestick.
Summary: The target for the main wave count is now at 2,187. The target for the more bullish alternate is first at 2,571.
Click charts to enlarge.
Bullish Wave Count
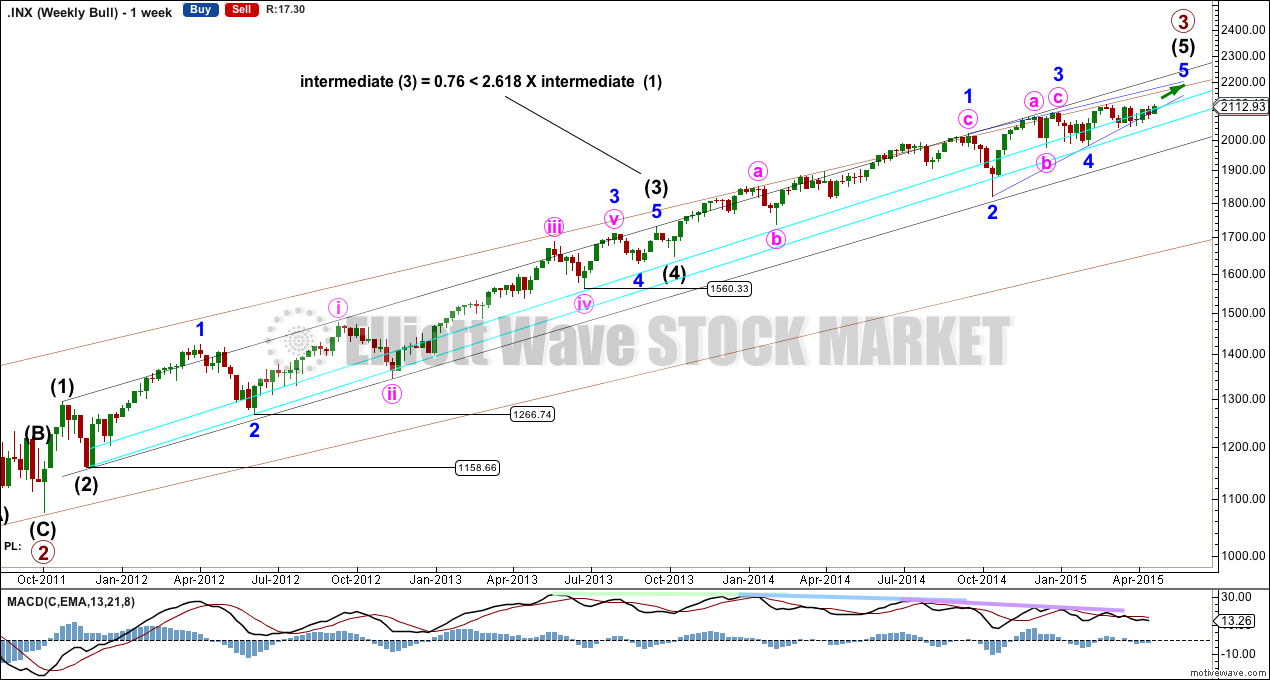
At the weekly chart level I want to see a wave count with intermediate wave (3) at just under 2.618 the length of intermediate wave (1), and subdividing perfectly as an impulse. At the weekly chart level intermediate wave (3) has stronger momentum so far than intermediate waves (1) and (5). This third wave cannot be the weakest.
The two bullish daily charts below both see intermediate waves (3) and (4) as labelled here.
There is now quadruple technical divergence between price and MACD. This indicates a maturing trend. For this reason I will keep the main wave count as the less bullish of the two.
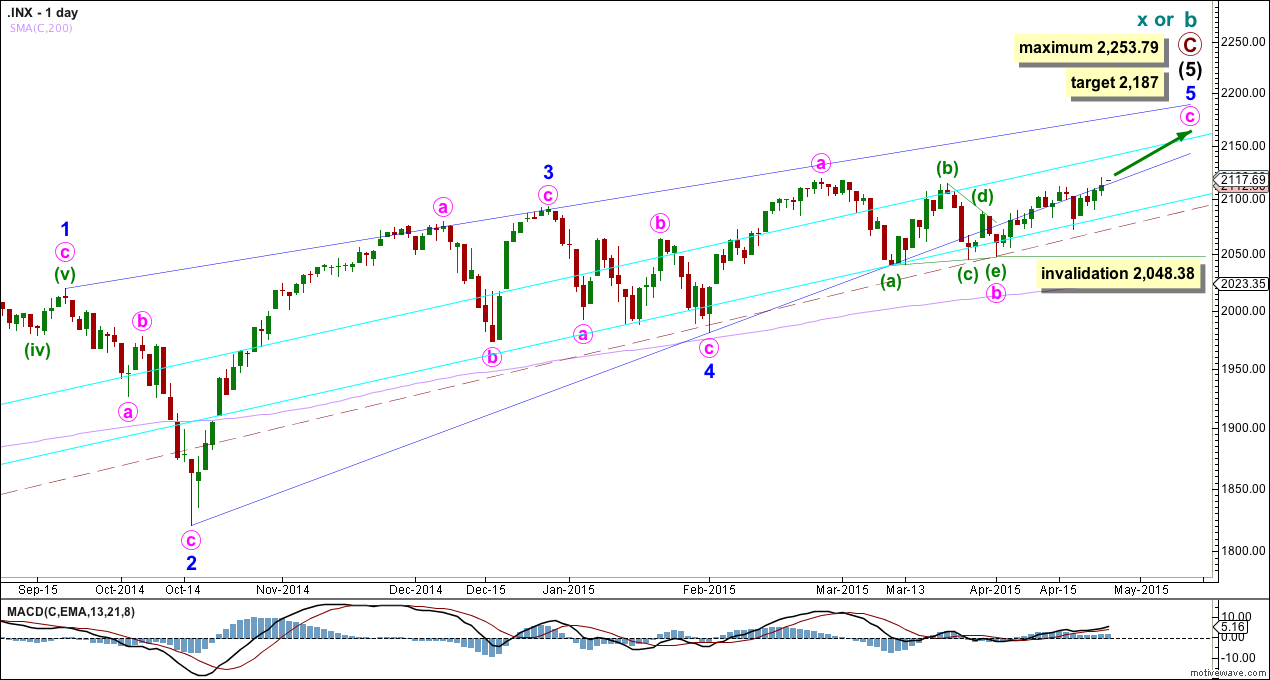
Within intermediate wave (5) the structure may be an ending diagonal. The alternate below looks at the only other structural possibility for a fifth wave, that of an impulse.
Within intermediate wave (5) I cannot see a solution where minor wave 3 ends earlier, because that would see it with weaker momentum than minor waves 1 and 5. While a third wave does not necessarily have to be the strongest wave within an impulse, it should not be the weakest.
An ending diagonal requires all sub waves to subdivide as zigzags and the fourth wave to overlap back into first wave price territory.
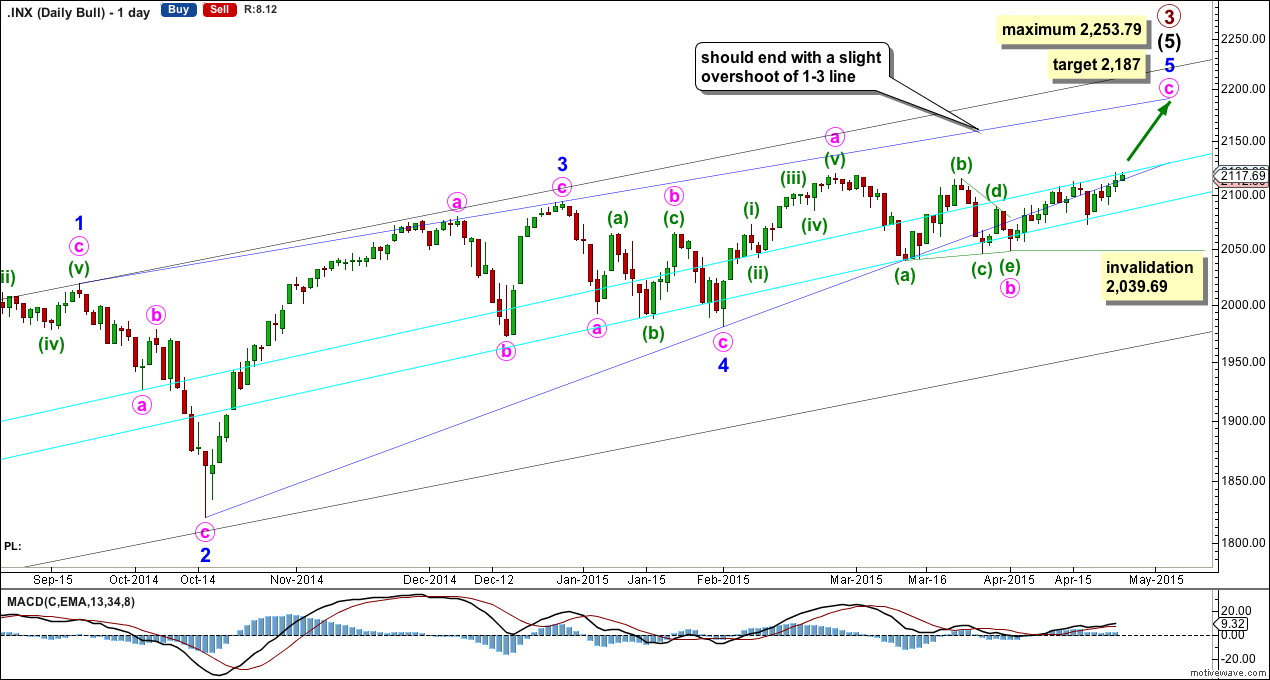
The lower 2-4 trend line of the contracting diagonal is now breached by three full daily candlesticks below it and not touching it. Diagonals normally adhere very well to their trend lines and this part of the wave count now looks wrong. Because this wave count looks so wrong I will publish another bullish alternate below.
The breach of the 2-4 trend line is the only problem with this wave count.
Within the final zigzag of minor wave 5 minute wave c must now have begun. It would reach equality in length with minute wave a at 2,187.
The diagonal is contracting, the third wave is shorter than the first and the fourth wave is shorter than the second. A third wave may never be the shortest wave. This limits the final fifth wave to no longer than equality with the third wave at 2,253.79. A new high above this point would see this main wave count invalid and the bullish alternate below confirmed.
Within minute wave c no second wave correction may move below the start of its first wave at 2,039.69.
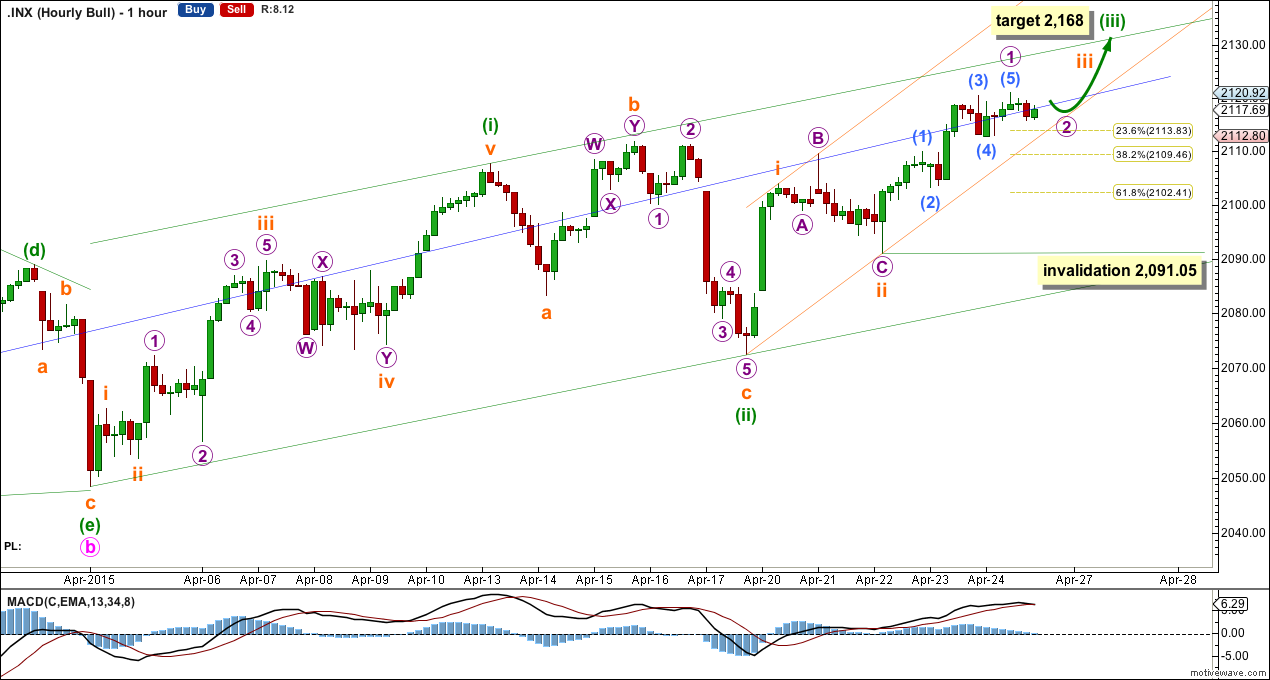
The hourly chart shows all of minute wave c so far.
At 2,168 minuette wave (iii) would reach 1.618 the length of minuette wave (i).
I am moving the degree of labelling down one degree within minuette wave (iii). I would not label subminuette wave iii over at Friday’s high because this movement is too short. I expect that within subminuette wave iii only micro wave 1 is now a complete five wave impulse. Micro wave 2 may not move beyond its start below 2,091.05.
I am adding another base channel, this one about subminuette waves i and ii (orange channel with the greatest slope up). Because it is likely that the lower edge of this channel should provide support to corrections along the way up, I would expect micro wave 2 to be very shallow.
Draw a base channel about minuette waves (i) and (ii). Minuette wave (iii) should show an increase in upwards momentum, enough to break above resistance at the upper edge of the green channel. Along the way up downwards corrections should find support at the lower edge of the base channel.
Alternate Bullish Wave Count
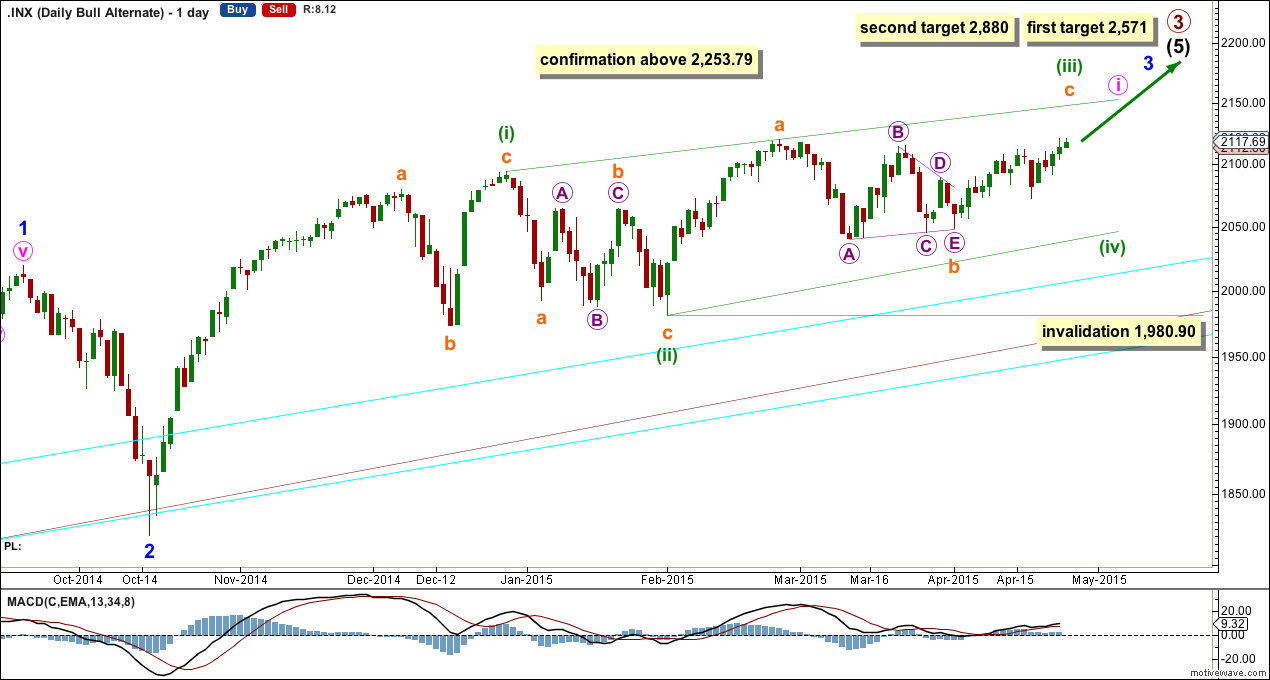
A new high above 2,253.79 would invalidate the main wave count and confirm this alternate. At that stage at least one more year, and probably longer, of a bull market may be expected.
I have looked for a bullish alternate which sees minor waves 3 and 4 within intermediate wave (5) complete. The problem is the deep correction seen here and labelled minor wave 2. This cannot be part of minor wave 3 because then minor wave 3 would not subdivide as an impulse.
It is possible to see minor wave 3 complete at the high labelled here minor wave 1, but then it would have weaker momentum than minor waves 1 and 5. I am not prepared to publish a wave count with a third wave in an impulse weaker than its corresponding first and fifth waves.
Through a process of elimination this leaves me with this very bullish wave count. It sees minor wave 3 as so far having stronger momentum than minor wave 1. It sees minor wave 1 as a complete impulse.
With all the overlapping at the beginning of this possible third wave a leading diagonal for minute wave i is a reasonable explanation.
The diagonal of minute wave i would be incomplete. When minuette wave (iii) is over then the following downward correction for minuette wave (iv) must move back into minuette wave (i) price territory below 2,093.55. Minuette wave (iv) may not move below the end of minuette wave (ii) below 1,980.90.
At 2,571 intermediate wave (5) would reach 2.618 the length of intermediate wave (3). Both intermediate waves (3) and (5) would be extended.
If price keeps rising through the first target, or if when it gets there the structure is incomplete, then the second target would be used. At 2,880 primary wave 3 would reach 2.618 the length of primary wave 1.
Bear Wave Count
The subdivisions within primary waves A-B-C are seen in absolutely exactly the same way as primary waves 1-2-3 for the bull wave count. The alternate bull wave count idea also works perfectly for this bear wave count.
To see the difference at the monthly chart level between the bull and bear ideas look at the last historical analysis here.
At cycle degree wave b is over the maximum common length of 138% the length of cycle wave a, at 167% the length of cycle wave a. At 2,393 cycle wave b would be twice the length of cycle wave a and at that point this bear wave count should be discarded.
While we have no confirmation of this wave count we should assume the trend remains the same, upwards. This wave count requires confirmation before I have confidence in it. Full and final confirmation that the market is crashing would only come with a new low below 1,370.58. However, structure and momentum should tell us long before that point which wave count is correct, bull or bear.
This analysis is published about 07:41 p.m. EST.

Friday’s doji and today’s reversal day with bearish engulfing candlestick smells like trouble for the bullish outlook. Both VIX and UVXY also showed very sharp reversals, extremely unusual ahead of a strong bullish move…am I missing something?
Nope. I’m looking to see if it’s possible that minute wave c could be over…. it doesn’t look like a complete five on the hourly chart though.
It’s possible. A change to a bear outlook would require a new low below the start of minute wave c before I would be comfortable publishing a chart showing the diagonal structure over again. That’s 2,048.68.