
Upwards movement and an increase in upwards momentum were expected for Wednesday’s session. The main Elliott wave count is confirmed at the hourly chart level.
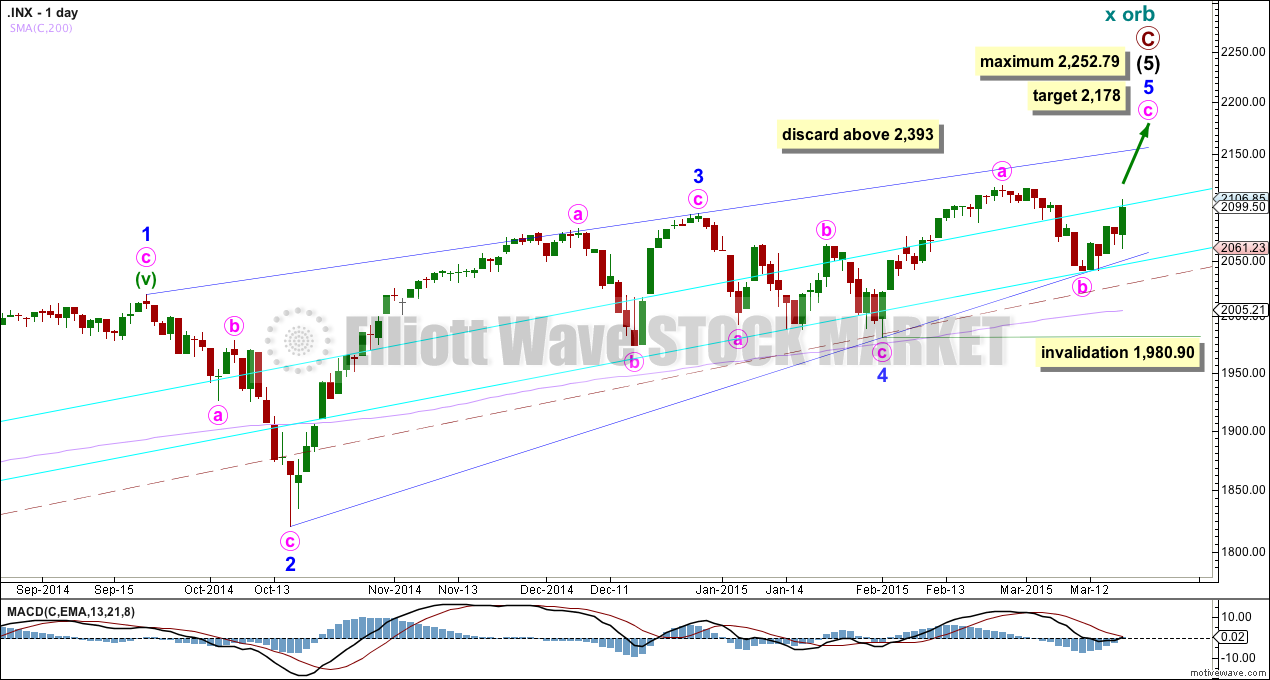
Summary: The next short term target is at 2,126 for the end of subminuette wave iii, where a small correction may begin. The mid term target remains the same at 2,178 for primary wave 3 (or cycle wave b for the bear wave count) to end. Upwards movement should not end until the upper blue 1-3 trend line on the daily chart is overshot.
Click charts to enlarge.
Bullish Wave Count
Upwards movement from the low at 666.79 subdivides as an incomplete 5-3-5. For the bull wave count this is seen as primary waves 1-2-3.
The aqua blue trend lines are traditional technical analysis trend lines. These lines are long held (the lower one has its first anchor in November, 2011), repeatedly tested, and shallow enough to be highly technically significant. When the lower of these double trend lines is breached by a close of 3% or more of market value that should indicate a substantial trend change. It does not indicate what degree the trend change should be though. It looks like the last five corrections may have ended about the lower aqua blue trend line, which gives the wave count a typical look. To see a weekly chart where I have drawn these trend lines go here.
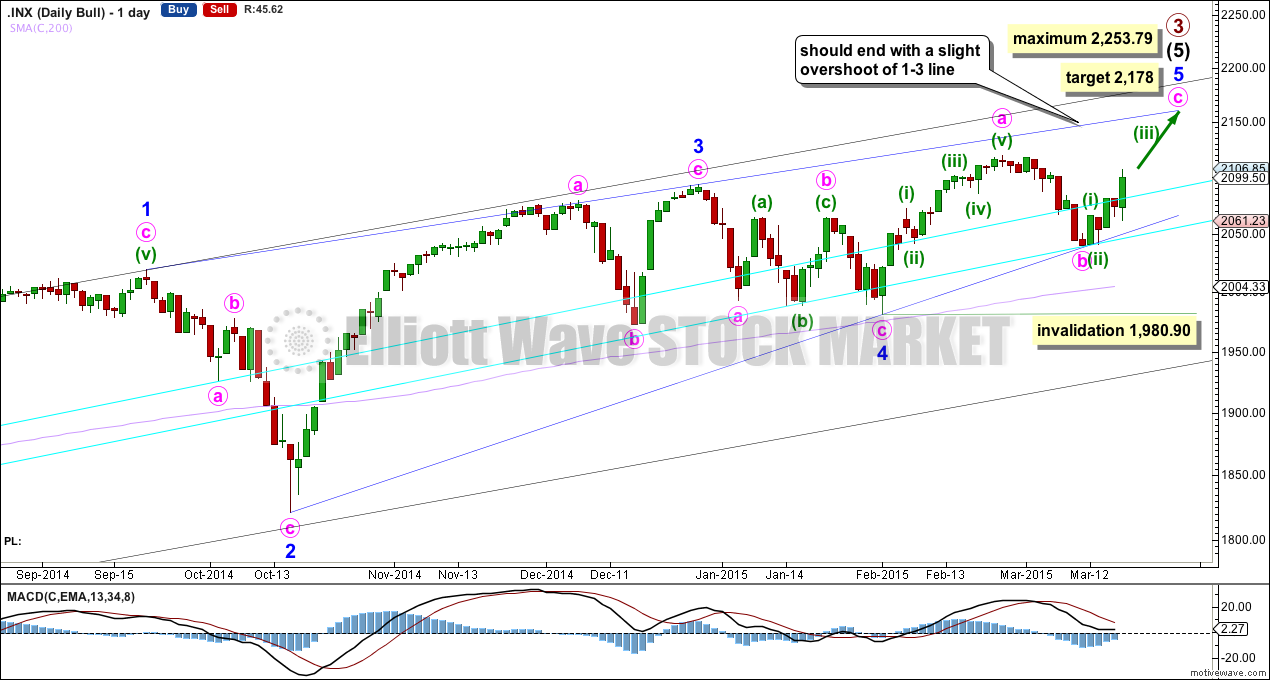
The wave count sees intermediate wave (5) as an ending contracting diagonal. Ending diagonals require all sub waves to be zigzags. So far this is a perfect fit. Minor wave 3 has stronger momentum than minor wave 5 on the daily chart.
The diagonal is contracting. The only problem with this possibility is that minor waves 2 and 4 are more shallow than second and fourth waves within diagonals normally are. In this case they may have been forced to be more shallow by support offered from the double aqua blue trend line.
Because the third wave within the contracting diagonal is shorter than the first wave and a third wave may never be the shortest wave, this limits the final fifth wave to no longer than equality with the third wave at 2,253.79.
Within intermediate wave (5) minor wave 1 lasted 238 days (5 days longer than a Fibonacci 233), minor wave 2 lasted 18 days (2 short of a Fibonacci 21), minor wave 3 lasted 51 days (4 short of a Fibonacci 55) and minor wave 4 lasted 23 days (2 longer than a Fibonacci 21). While none of these durations are perfect Fibonacci numbers, they are all reasonably close. So far minor wave 5 has lasted 30 days and the structure looks incomplete. The next Fibonacci number in the sequence for minor wave 5 is 34, which is just four sessions away. Minor wave 5 may end in another four sessions although this looks unlikely now.
Within minor wave 5 minute wave b may not move beyond the start of minute wave a below 1,980.90.
Contracting diagonals normally have fifth waves which end with a slight overshoot of the 1-3 trend line. Because this is such a common tendency I will still expect more upwards movement to see this trend line overshot. It is possible that the fifth wave is over already, and this idea is presented as an alternate.
Diagonals almost always adhere well to their trend lines. This one has slight overshoots within minute wave a of minor wave 3, but the 1-3 trend line is not breached. For this diagonal to have the “right look” minute wave c must continue upwards from here. A breach of the lower blue 2-4 trend line would see this wave count substantially reduced in probability in favour of the alternate below.
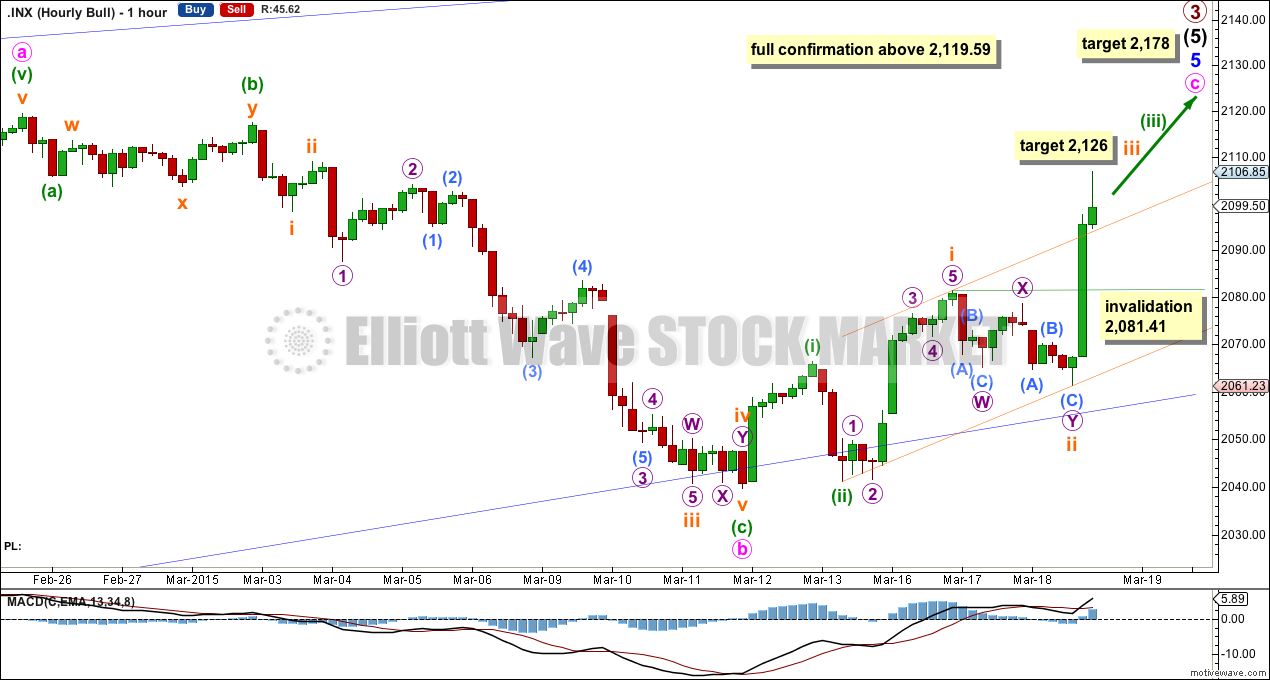
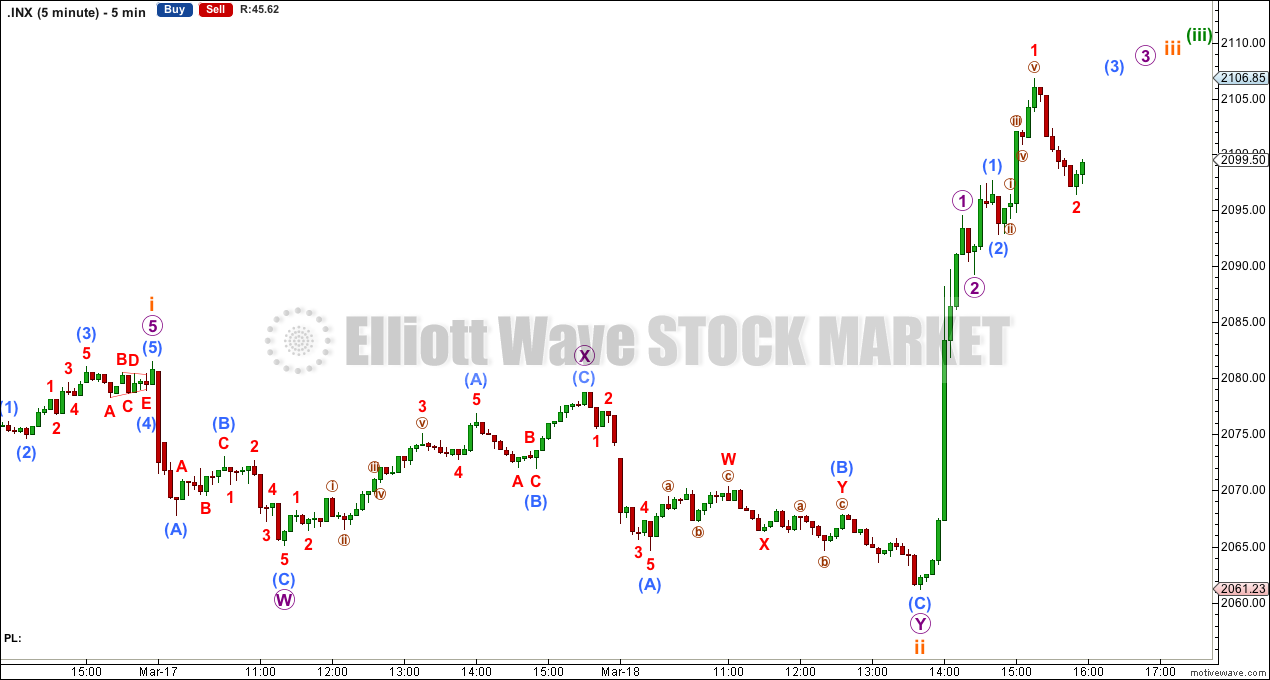
Upwards movement for subminuette wave iii is showing an increase in momentum as expected. The structure for subminuette wave iii may be close to completion. When it is done a small fourth wave correction for subminuette wave iv may not move back into subminuette wave i price territory below 2,081.41.
My first confirmation point was incorrectly stated as 2,109.89. It should have been the low of minuette wave (a) at 2,105.93. Now that this price point is passed the alternate idea which sees an impulse unfolding downwards is invalidated because the fourth wave would now be in its first wave price territory above 2,105.93.
The downwards wave for minute wave b fits best as a zigzag. This wave is now confirmed as complete.
At 2,178 minute wave c would reach equality in length with minute wave a.
At 2,126 subminuette wave iii would reach 1.618 the length of subminuette wave i.
When subminuette wave iii is over then subminuette wave iv should unfold as a shallow sideways moving correction. It may show up on the daily chart as one or more red candlesticks or doji, because subminuette wave ii shows on the daily chart as one red candlestick. This would give the wave count the right look at the daily chart level.
When subminuette waves iii and iv are over I will again calculate a target for minuette wave (iii) for you. Minuette wave (iv) may also be expected to show on the daily chart as one or more red candlesticks or doji because minuette wave (ii) shows on the daily chart as one red candlestick.
The orange channel is a base channel about subminuette waves i and ii. It is breached by upwards movement for subminuette wave iii, which would be expected of a third wave.
When subminuette wave iii may be complete use Elliott’s first technique to draw a channel about minuette wave (iii): draw the first trend line from the highs of subminuette waves i to iii, then place a parallel copy on the end of subminuette wave ii. Subminuette wave iv may find support at the lower edge of that channel.
Subminuette wave iv may not move back down into subminuette wave i price territory below 2,081.41.
Alternate Bullish Wave Count
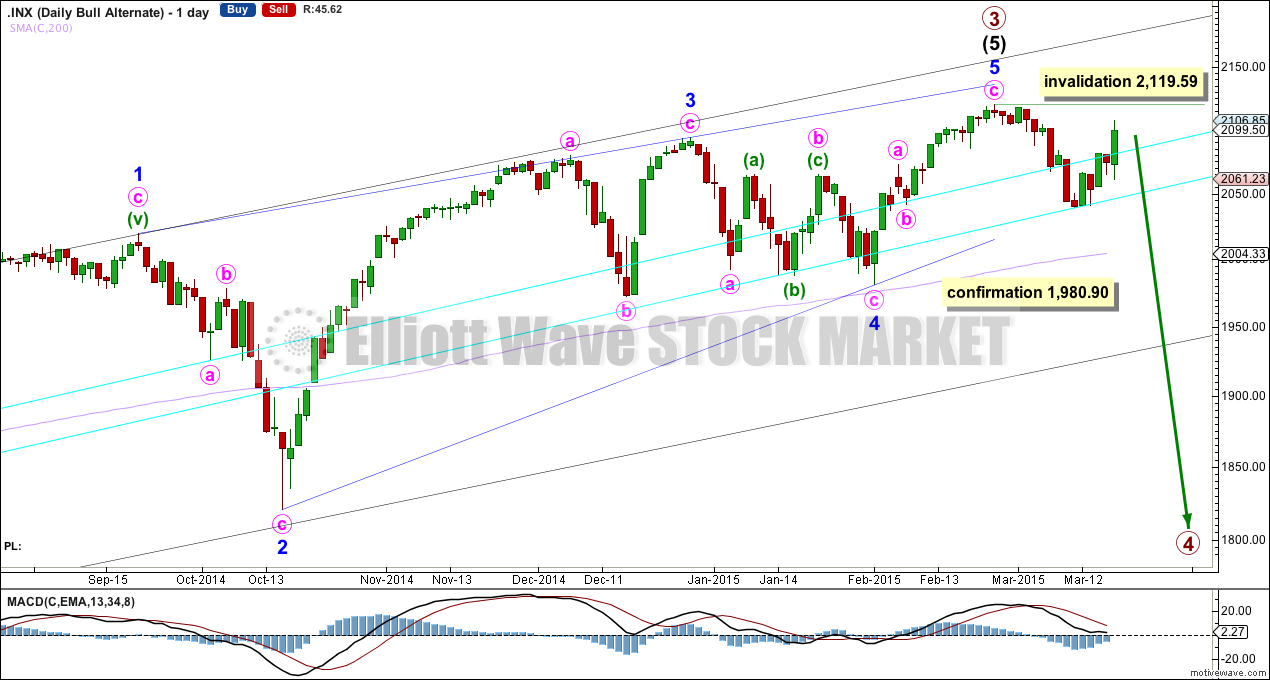
This wave count is identical to the main wave count up to the low labelled minor wave 4. Thereafter, this alternate looks at the possibility that minor wave 5 may be over. Minor wave 5 would have fallen slightly short of the 1-3 trend line. This is unusual but does occasionally happen for fifth waves of contracting diagonals.
A new low below 1,980.90 would invalidate the main wave count. A close below the lower aqua blue trend line of 3% or more of market value would provide added confidence in this wave count. At that stage I would expect that downwards movement may be the early stages of primary wave 4. The bearish wave count below would also be entirely possible, but would require further confirmation.
Primary wave 2 was a 0.41 zigzag correction lasting 62 days in total. I would expect primary wave 4 to be more shallow because it may find support at the lower edge of an Elliott channel (which must be drawn on a weekly chart at this stage). Primary wave 4 should break out of the black channel copied over here from the weekly chart (this is a channel containing primary wave 3). A breach of that channel would provide further confidence that primary wave 3 is over and primary wave 4 is underway.
Primary wave 4 may last about a Fibonacci 55 days if it is a flat correction. If it is a combination or triangle it may be more time consuming, maybe up to a Fibonacci 89 days.
We should always assume the trend remains the same, until proven otherwise. At this early stage we have no confirmation of a big trend change, so this idea must remain an alternate until we do. We should assume the trend remains up.
The new downwards movement has begun with a completed three down at the hourly chart level. This substantially reduces the probability of this alternate today. It is possible that a leading diagonal is unfolding in a first wave position, but first wave leading diagonals are not very common.
Bear Wave Count
The subdivisions within primary waves A-B-C are seen in absolutely exactly the same way as primary waves 1-2-3 for the bull wave count. The alternate bull wave count idea also works perfectly for this bear wave count.
To see the difference at the monthly chart level between the bull and bear ideas look at the last historical analysis here.
At cycle degree wave b is over the maximum common length of 138% the length of cycle wave a, at 167% the length of cycle wave a. At 2,393 cycle wave b would be twice the length of cycle wave a and at that point this bear wave count should be discarded.
While we have no confirmation of this wave count we should assume the trend remains the same, upwards. This wave count requires confirmation before I have confidence in it.
This analysis is published about 08:04 p.m. EST.
Hi Rodney,
Lara’s skills as an analyst are better than most because she has an uncanny ability to keep the larger picture in mind and not be thrown off by the short term gyrations of the market. I don’t want to speak for her but she has consistently called for an over-shoot of the 1-3 trend-line because this is typically what ending diagonals do. This is a critical point for traders as it provides a great indication of when the upwards movement is probably complete(barring a rare truncation as she has pointed out recently) I think she is again right on the money and the wave sub-divisions are playing out perfectly…
Lara,
I appreciate your work and the counts you give us including the alternates. On the main count you have continually told us,
Upwards movement should not end until the upper blue 1-3 trend line on the daily chart is overshot.
Why is this so and do you have any probabilities of it doing so versus not doing so?
Thanks for your time and commentary,
Rodney
I can’t put a number on it Rodney, but I will say that for the contracting diagonals I’ve seen over the years it looks like the vast majority have a 1-3 overshoot for wave 5. It’s really very common.
So in order to make an accurate prediction I’m going to expect that S&P has this ending diagonal which looks most typical.
What is the likelihood of minuette 5 of minor 5 also being extended?
Less than 50%. The third wave for S&P is the most commonly extended wave. Fifth waves not so common to extend.
Which is one reason I removed the target for minuette wave (iii) today. It may not exhibit a ratio to minuette wave (i), it may be longer than the prior target I had. I think the best way to calculate a target for it may be at subminuette wave degree.