
Upwards movement was expected towards the target. Another red candlestick looks like another second wave correction, and price remains above the invalidation point and above the lower blue trend line.
Summary: The next short term target is at 2,111 for the end of minuette wave (iii), where a small correction may begin. The mid term target remains the same at 2,178 for primary wave 3 (or cycle wave b for the bear wave count) to end, and now looks unlikely that the target can be met in just five more sessions.
Click charts to enlarge.
Bullish Wave Count

Upwards movement from the low at 666.79 subdivides as an incomplete 5-3-5. For the bull wave count this is seen as primary waves 1-2-3.
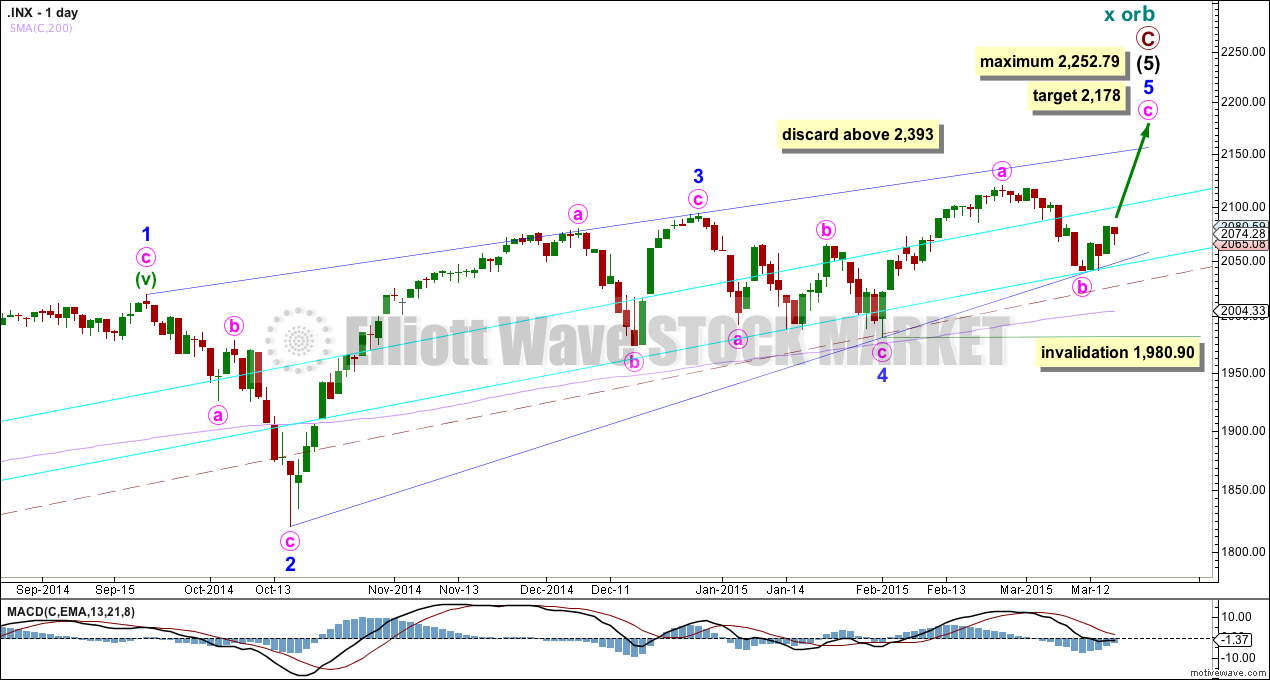
The aqua blue trend lines are traditional technical analysis trend lines. These lines are long held (the lower one has its first anchor in November, 2011), repeatedly tested, and shallow enough to be highly technically significant. When the lower of these double trend lines is breached by a close of 3% or more of market value that should indicate a substantial trend change. It does not indicate what degree the trend change should be though. It looks like the last five corrections may have ended about the lower aqua blue trend line, which gives the wave count a typical look. To see a weekly chart where I have drawn these trend lines go here.
The wave count sees intermediate wave (5) as an ending contracting diagonal. Ending diagonals require all sub waves to be zigzags. So far this is a perfect fit. Minor wave 3 has stronger momentum than minor wave 5 on the daily chart.
The diagonal is contracting. The only problem with this possibility is that minor waves 2 and 4 are more shallow than second and fourth waves within diagonals normally are. In this case they may have been forced to be more shallow by support offered from the double aqua blue trend line.
Because the third wave within the contracting diagonal is shorter than the first wave and a third wave may never be the shortest wave, this limits the final fifth wave to no longer than equality with the third wave at 2,253.79.
Within intermediate wave (5) minor wave 1 lasted 238 days (5 days longer than a Fibonacci 233), minor wave 2 lasted 18 days (2 short of a Fibonacci 21), minor wave 3 lasted 51 days (4 short of a Fibonacci 55) and minor wave 4 lasted 23 days (2 longer than a Fibonacci 21). While none of these durations are perfect Fibonacci numbers, they are all reasonably close. So far minor wave 5 has lasted 28 days and the structure looks incomplete. The next Fibonacci number in the sequence for minor wave 5 is 34, which is just five sessions away. Minor wave 5 may end in another five sessions although this looks unlikely now. If it takes another six sessions it may total 35, just one more than a Fibonacci 34.
Within minor wave 5 minute wave b may not move beyond the start of minute wave a below 1,980.90.
Contracting diagonals normally have fifth waves which end with a slight overshoot of the 1-3 trend line. Because this is such a common tendency I will still expect more upwards movement to see this trend line overshot. It is possible that the fifth wave is over already, and this idea is presented as an alternate.
Diagonals almost always adhere well to their trend lines. This one has slight overshoots within minute wave a of minor wave 3, but the 1-3 trend line is not breached. For this diagonal to have the “right look” minute wave c must continue upwards from here. A breach of the lower blue 2-4 trend line would see this wave count substantially reduced in probability in favour of the alternate below.
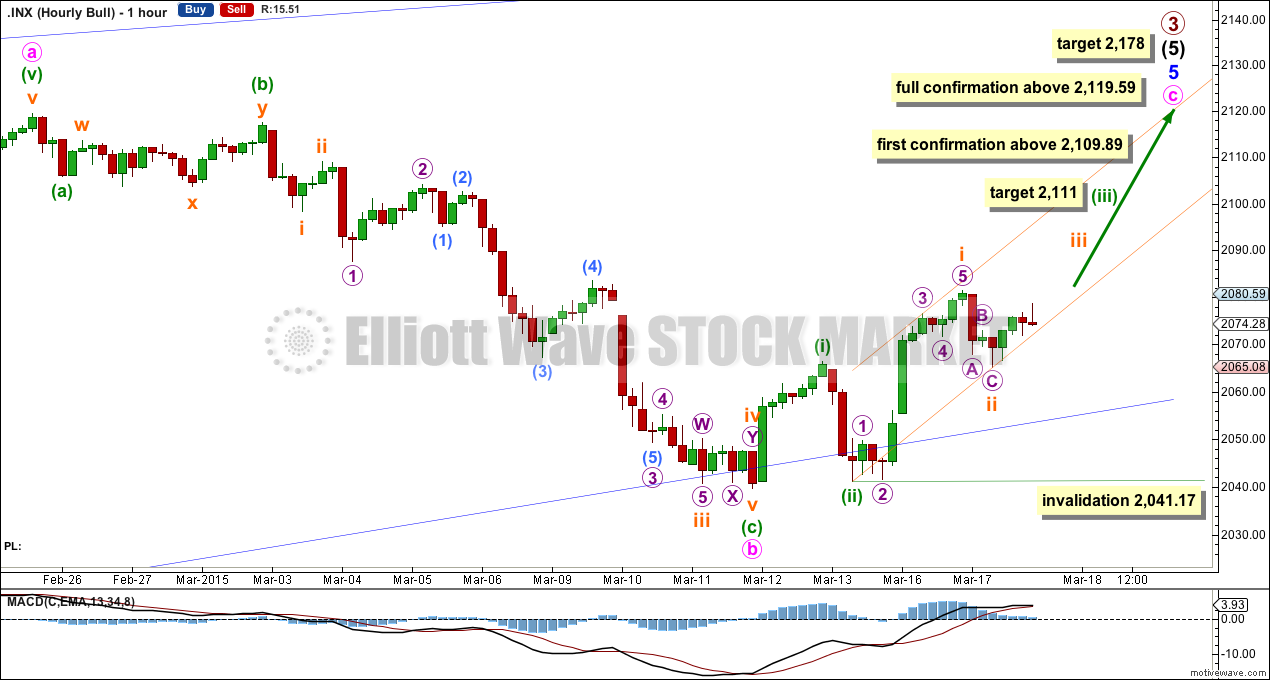
Downwards movement for Tuesday’s session is slightly back into minuette wave (i) price territory, so this cannot be a fourth wave correction and must be another second wave correction.
So far within minute wave c upwards there are two overlapping first and second waves. This indicates an increase in upwards momentum should follow over the next couple of days as the middle of a third wave up unfolds. At 2,111 minuette wave (iii) would reach 2.618 the length of minuette wave (i). If the target is wrong it may be too low. Minuette wave (iii) may not exhibit a Fibonacci ratio to minuette wave (i). When subminuette waves i through to iv within minuette wave (iii) are complete I will add to the target calculation at a second wave degree, and at that stage it may widen to a small zone or it may change.
Subminuette wave ii may not move beyond the start of subminuette wave i below 2,041.17.
A new high above 2,109.89 would invalidate the alternate wave count at the hourly level and provide confidence in this main wave count.
A new high above 2,119.59 would invalidate the alternate wave count at the daily chart level and provide full and final confidence in this main wave count.
I will not look for the end of minute wave c until the blue 1-3 trend line of the diagonal on the daily chart is reached and overshot.
I have drawn a base channel about subminuette waves i and ii. This may show where upwards movement continues to find support.
My only slight cause for concern with this wave count at the hourly chart level is the long length of minuette wave (c) compared to minuette wave (a) within the downwards zigzag of minute wave b. The subdivisions fit nicely though, so this is only a slight cause for concern.
Alternate Bullish Wave Count
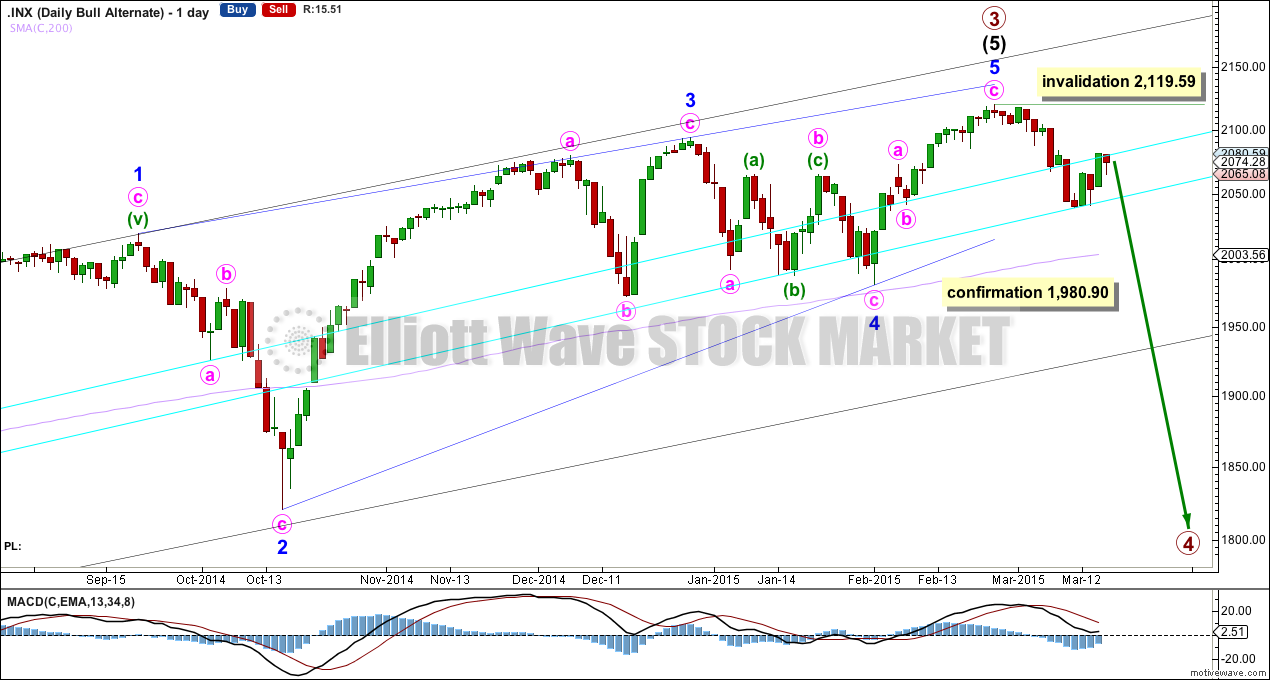
This wave count is identical to the main wave count up to the low labelled minor wave 4. Thereafter, this alternate looks at the possibility that minor wave 5 may be over. Minor wave 5 would have fallen slightly short of the 1-3 trend line. This is unusual but does occasionally happen for fifth waves of contracting diagonals.
A new low below 1,980.90 would invalidate the main wave count. A close below the lower aqua blue trend line of 3% or more of market value would provide added confidence in this wave count. At that stage I would expect that downwards movement may be the early stages of primary wave 4. The bearish wave count below would also be entirely possible, but would require further confirmation.
Primary wave 2 was a 0.41 zigzag correction lasting 62 days in total. I would expect primary wave 4 to be more shallow because it may find support at the lower edge of an Elliott channel (which must be drawn on a weekly chart at this stage). Primary wave 4 should break out of the black channel copied over here from the weekly chart (this is a channel containing primary wave 3). A breach of that channel would provide further confidence that primary wave 3 is over and primary wave 4 is underway.
Primary wave 4 may last about a Fibonacci 55 days if it is a flat correction. If it is a combination or triangle it may be more time consuming, maybe up to a Fibonacci 89 days.
We should always assume the trend remains the same, until proven otherwise. At this early stage we have no confirmation of a big trend change, so this idea must remain an alternate until we do. We should assume the trend remains up.
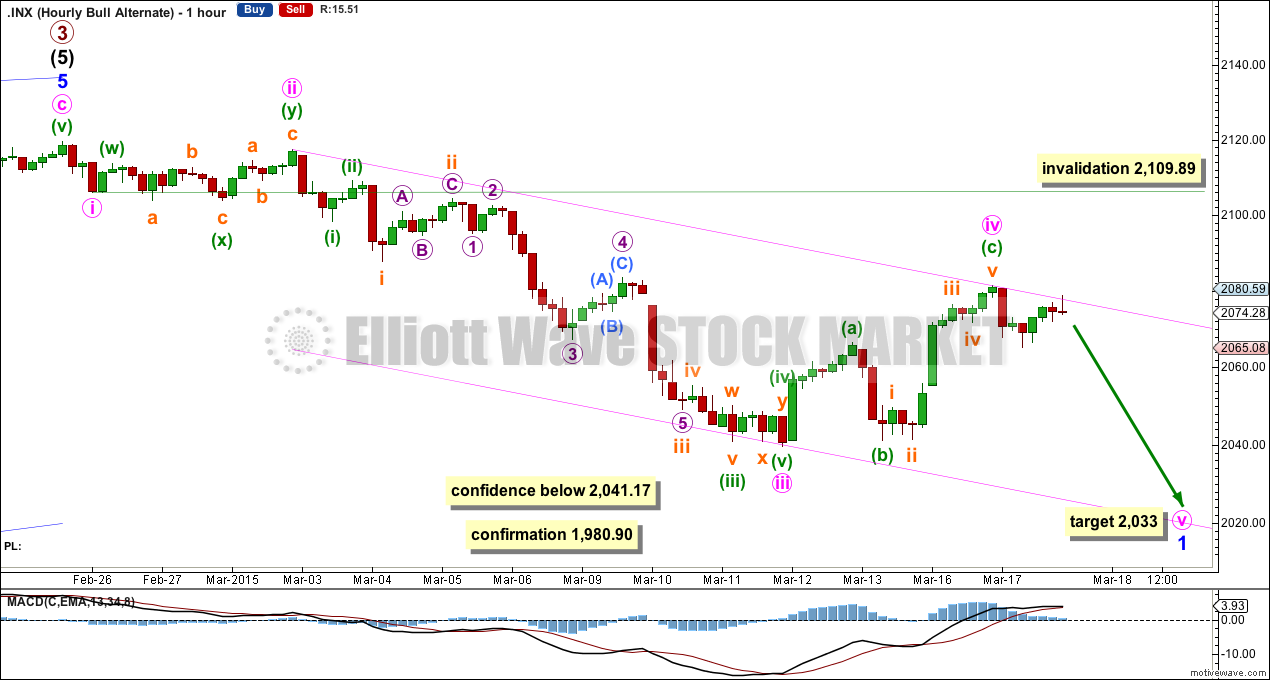
Fourth waves are not always contained within a channel drawn using Elliott’s first technique, which is why he had a second technique. Now that minute wave iv has breached the channel redraw it. Draw the first trend line from the ends of minute waves ii to iv, then place a parallel copy on the end of minute wave iii. Minute wave v may end at the lower edge of this redrawn channel.
At 2,033 minute wave v would reach 0.618 the length of minute wave iii.
A new low below 2,041.17 would invalidate the main hourly wave count and provide confidence in this alternate. This alternate wave count requires a new low below 1,980.90.
Minute wave iv may not move into minute wave i price territory above 2,109.89.
Bear Wave Count
The subdivisions within primary waves A-B-C are seen in absolutely exactly the same way as primary waves 1-2-3 for the bull wave count. The alternate bull wave count idea also works perfectly for this bear wave count.
To see the difference at the monthly chart level between the bull and bear ideas look at the last historical analysis here.
At cycle degree wave b is over the maximum common length of 138% the length of cycle wave a, at 167% the length of cycle wave a. At 2,393 cycle wave b would be twice the length of cycle wave a and at that point this bear wave count should be discarded.
While we have no confirmation of this wave count we should assume the trend remains the same, upwards. This wave count requires confirmation before I have confidence in it.
This analysis is published about 09:11 p.m. EST.
Nice call on the ending diagonal Lara!
Thank you!