
Upwards movement was expected from the main Elliott wave count. Friday ended with a red candlestick, but price continues to find strong support at the two trend lines and remains above the invalidation points.
Summary: The main wave count requires upwards movement on Monday, and the lower blue 2-4 trend line may not be breached for the wave count to remain viable. The target remains the same at 2,178 and it may be met 25th March, give or take up to two trading days either side of this date.
Click charts to enlarge.
Bullish Wave Count
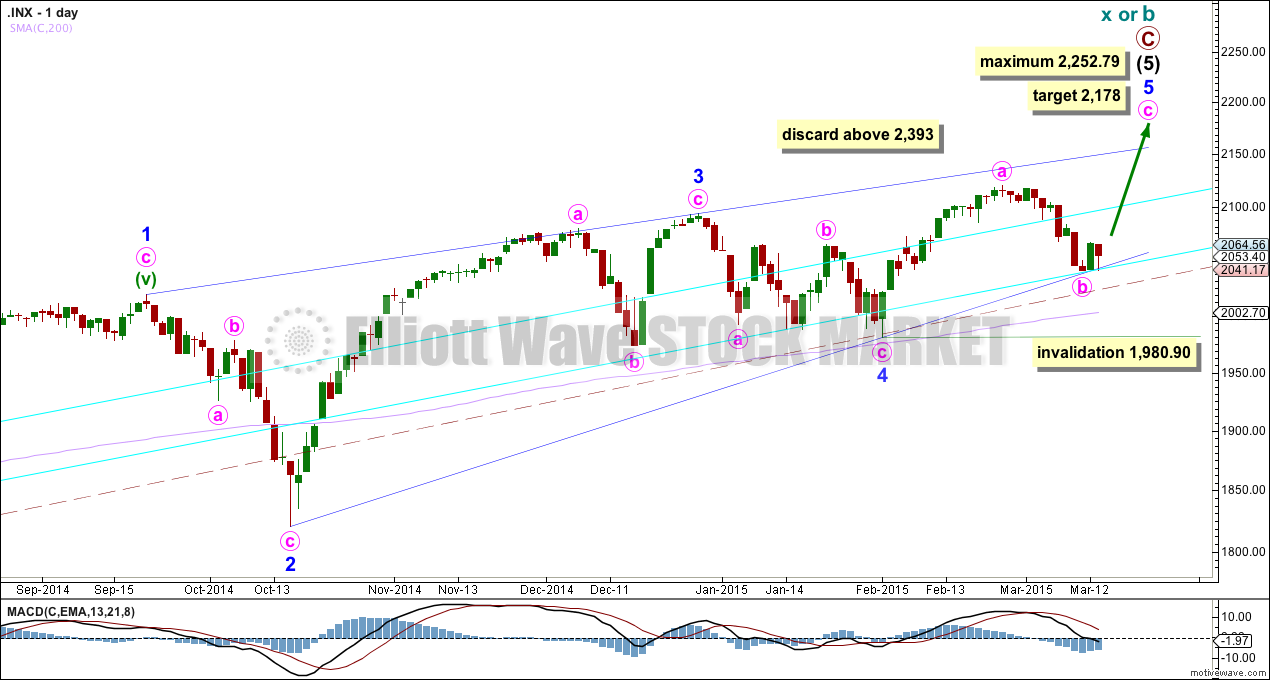
Upwards movement from the low at 666.79 subdivides as an incomplete 5-3-5. For the bull wave count this is seen as primary waves 1-2-3.
The aqua blue trend lines are traditional technical analysis trend lines. These lines are long held (the lower one has its first anchor in November, 2011), repeatedly tested, and shallow enough to be highly technically significant. When the lower of these double trend lines is breached by a close of 3% or more of market value that should indicate a trend change. It does not indicate what degree the trend change should be though. It looks like the last five corrections may have ended about the lower aqua blue trend line, which gives the wave count a typical look. To see a weekly chart where I have drawn these trend lines go here.
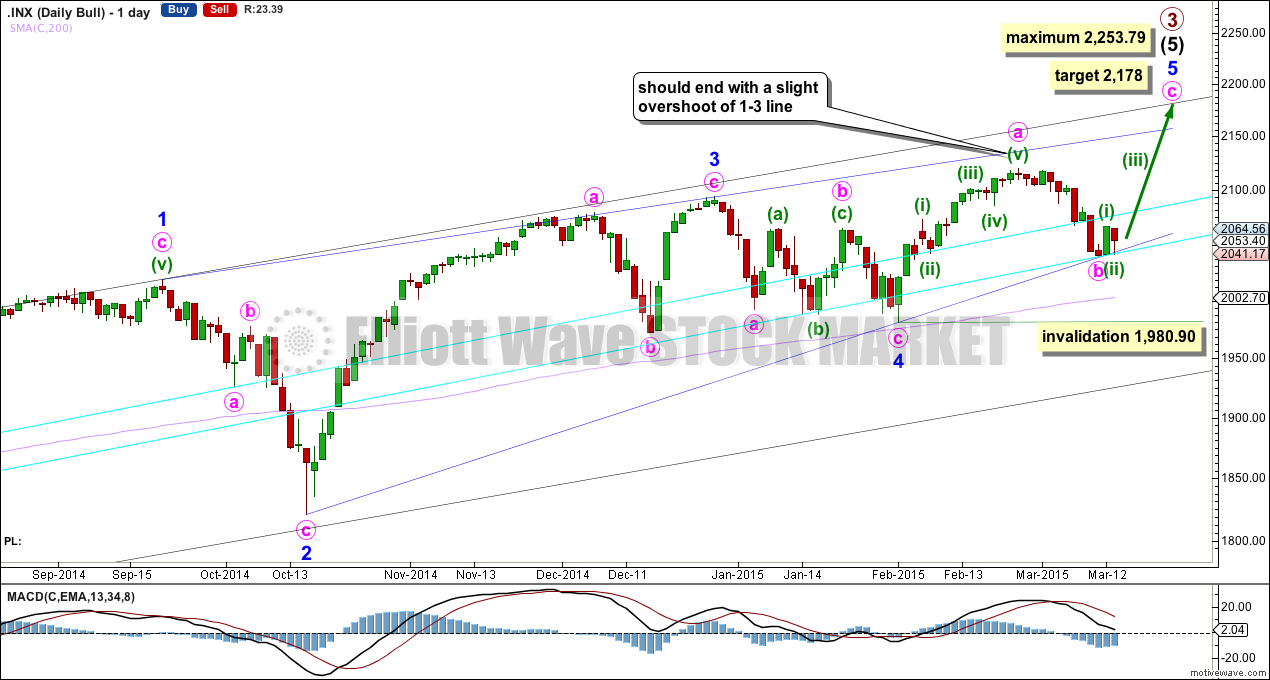
The wave count sees intermediate wave (5) as an ending contracting diagonal. Ending diagonals require all sub waves to be zigzags. So far this is a perfect fit. Minor wave 3 has stronger momentum than minor wave 5 on the daily chart.
The diagonal is contracting. The only problem with this possibility is that minor waves 2 and 4 are more shallow than second and fourth waves within diagonals normally are. In this case they may have been forced to be more shallow by support offered from the double aqua blue trend lines.
Because the third wave within the contracting diagonal is shorter than the first wave and a third wave may never be the shortest wave, this limits the final fifth wave to no longer than equality with the third wave at 2,253.79.
Within intermediate wave (5) minor wave 1 lasted 238 days (5 days longer than a Fibonacci 233), minor wave 2 lasted 18 days (2 short of a Fibonacci 21), minor wave 3 lasted 51 days (4 short of a Fibonacci 55) and minor wave 4 lasted 23 days (2 longer than a Fibonacci 21). While none of these durations are perfect Fibonacci numbers, they are all reasonably close. So far minor wave 5 has lasted 27 days and the structure looks incomplete. It may now end close to a total Fibonacci 34 sessions, so may continue for a further 7 sessions give or take one to two days either side of this expectation. This gives a possible end date of 25th March, 2015.
Within minor wave 5 minute wave b may not move beyond the start of minute wave a below 1,980.90.
Contracting diagonals normally have fifth waves which end with a slight overshoot of the 1-3 trend line. Because this is such a common tendency I will still expect more upwards movement to see this trend line overshot. It is possible that the fifth wave is over already, and this idea is presented as an alternate.
Diagonals almost always adhere well to their trend lines. This one has slight overshoots within minute wave a of minor wave 3, but the 1-3 trend line is not breached. For this diagonal to have the “right look” minute wave c must continue upwards from here. A breach of the lower blue 2-4 trend line would see this wave count substantially reduced in probability in favour of the alternate below.
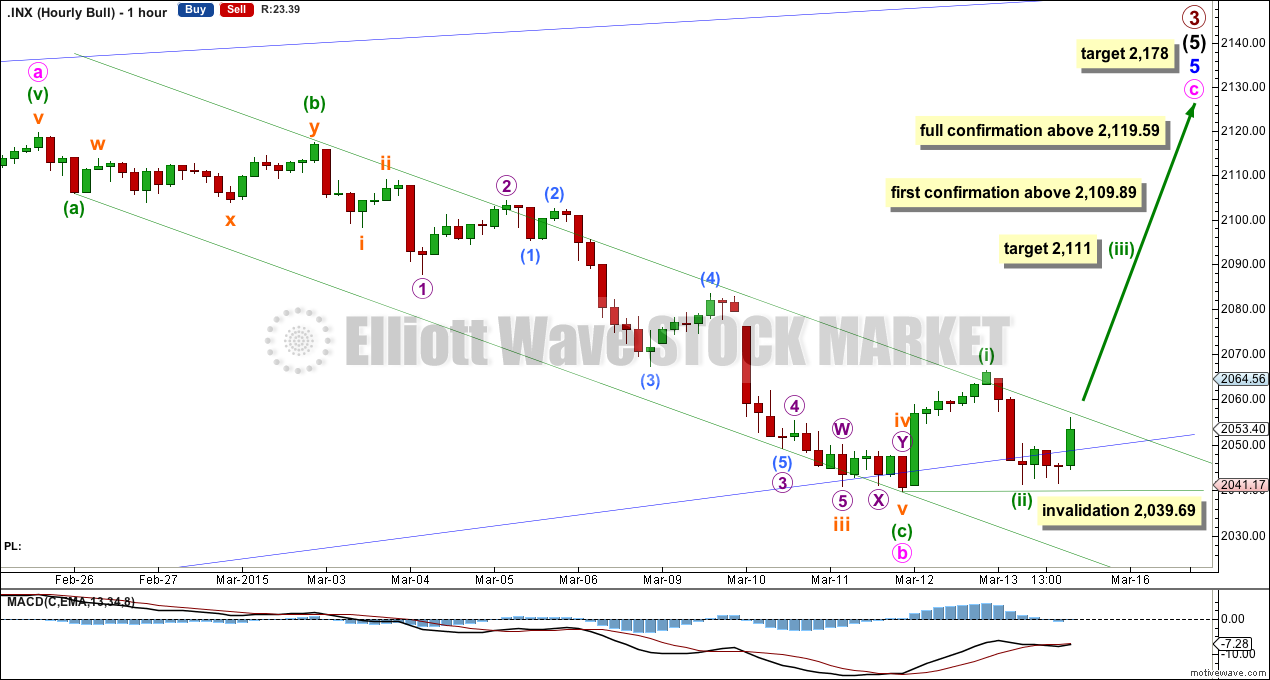
Minute wave c must subdivide as a five wave structure, either an ending diagonal or an impulse. An impulse is more common.
At 2,111 minuette wave (iii) would reach 2.618 the length of minuette wave (i).
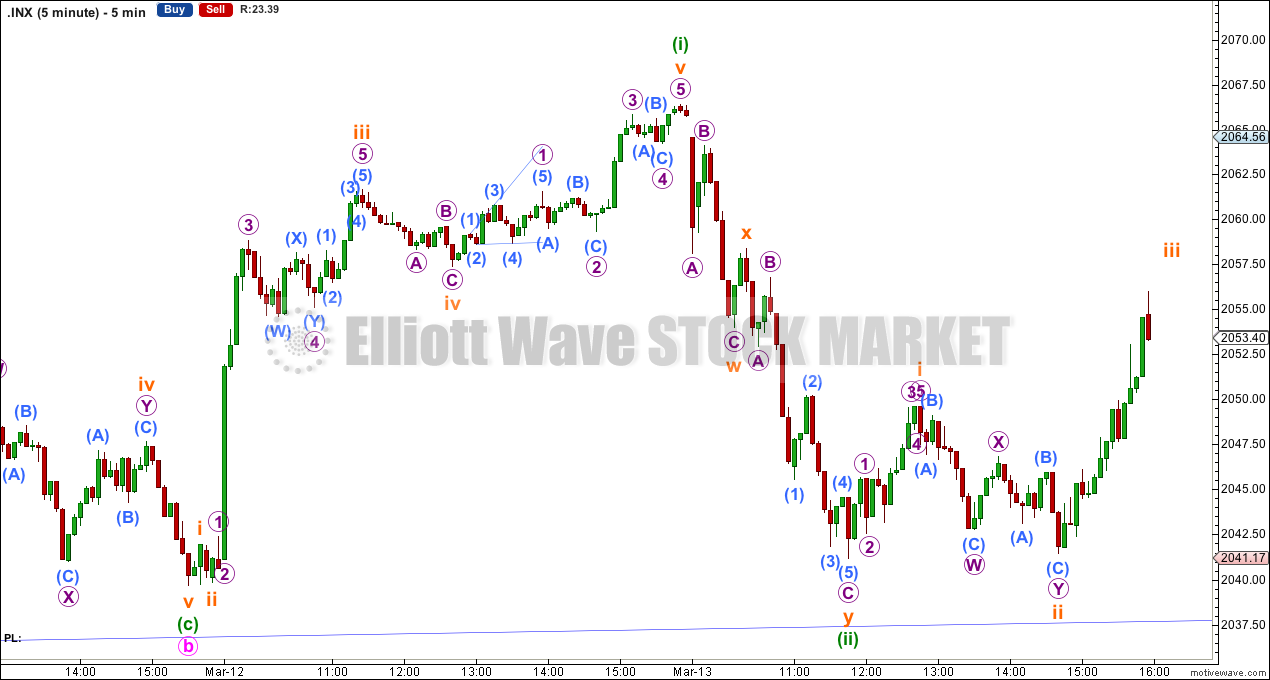
Within minute wave c if minuette waves (ii) and (iv) show up on the daily chart with one or more red candlesticks or doji that would give the wave count a typical look.
The subdivisions within minuette wave (iii) should be clear on the hourly chart, but are unlikely to show up on the daily chart. I don’t expect to see another red candlestick until minuette wave (iii) is a complete impulse.
In the first instance the downwards sloping green best fit channel about minute wave b needs to be breached by upwards movement before I would have confidence in this main wave count and the upwards trend. Thereafter, a new high above 2,109.89 would provide a lot of confidence in this wave count. It would be fully confirmed with a new high above 2,119.59.
At 2,178 minute wave c would reach equality in length with minute wave a. I would not expect minute wave c to end until the upper blue 1-3 trend line of the diagonal is overshot on the daily chart.
Minuette wave (ii) may not move beyond the start of minuette wave (i) below 2,039.69.
Alternate Bullish Wave Count
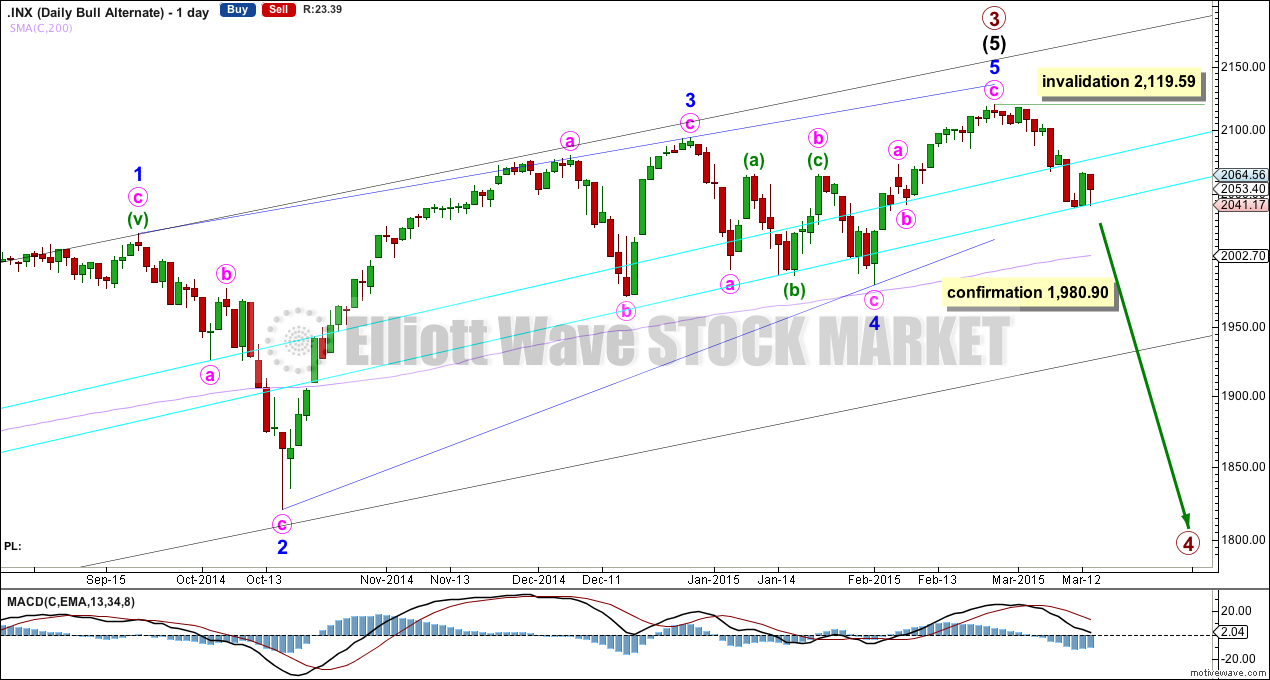
This wave count is identical to the main wave count up to the low labelled minor wave 4. Thereafter, this alternate looks at the possibility that minor wave 5 may be over. Minor wave 5 would have fallen slightly short of the 1-3 trend line. This is unusual but does occasionally happen for fifth waves of contracting diagonals.
A new low below 1,980.90 would invalidate the main wave count. A close below the lower aqua blue trend line of 3% or more of market value would provide added confidence in this wave count. At that stage I would expect that downwards movement may be the early stages of primary wave 4. The bearish wave count below would also be entirely possible, but would require further confirmation.
Primary wave 2 was a 0.41 zigzag correction lasting 62 days in total. I would expect primary wave 4 to be more shallow because it may find support at the lower edge of an Elliott channel (which must be drawn on a weekly chart at this stage). Primary wave 4 should break out of the black channel copied over here from the weekly chart (this is a channel containing primary wave 3). A breach of that channel would provide further confidence that primary wave 3 is over and primary wave 4 is underway.
Primary wave 4 may last about a Fibonacci 55 days if it is a flat correction. If it is a combination or triangle it may be more time consuming, maybe up to a Fibonacci 89 days.
We should always assume the trend remains the same, until proven otherwise. At this early stage we have no confirmation of a big trend change, so this idea must remain an alternate until we do. We should assume the trend remains up.
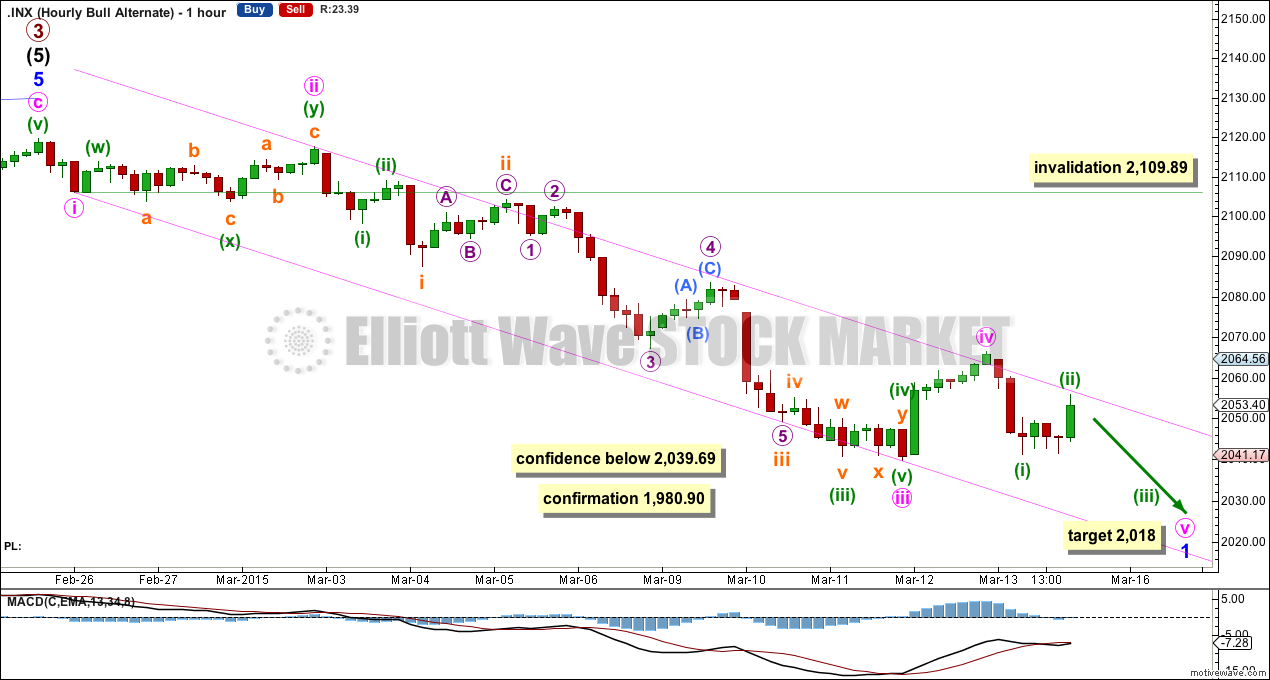
If there has been a trend change at primary degree (or cycle degree for the bear wave count) then we should see a clear five down develop at the hourly and then the daily chart level. So far the first five down is incomplete. The final fifth wave is required.
At 2,018 minute wave v would reach 0.618 the length of minute wave iii. Minute wave v may end midway within the parallel channel which is drawn here using Elliott’s first technique.
A new low below 2,039.69 should come within the next one or two days if this wave count is correct. That would increase confidence in this wave count.
A new low below 1,980.90 would provide further confidence in this wave count. Because of the size of the trend change I would still want to wait for a breach of the lower aqua blue trend line by a close of 3% or more of market value before I have full confidence in it.
Minute wave iv may not move into minute wave i price territory above 2,109.89.
Bear Wave Count
The subdivisions within primary waves A-B-C are seen in absolutely exactly the same way as primary waves 1-2-3 for the bull wave count. The alternate bull wave count idea also works perfectly for this bear wave count.
To see the difference at the monthly chart level between the bull and bear ideas look at the last historical analysis here.
At cycle degree wave b is over the maximum common length of 138% the length of cycle wave a, at 167% the length of cycle wave a. At 2,393 cycle wave b would be twice the length of cycle wave a and at that point this bear wave count should be discarded.
While we have no confirmation of this wave count we should assume the trend remains the same, upwards. This wave count requires confirmation before I have confidence in it.
This analysis is published about 10:32 p.m. EST.
Great analysis. I entered L and look for the swing trade at the end of the 5th wave.
Lara, what is the expected time frame in which the whole ED should be retraced?
Hi Lara. Thank you for the update.
You had considered the movement 2039.69 – 2066 – 2041.17 – (2111) as part of minute c. I am wondering if the jump from 2111 to 2178 is too great for minuette iv and v. It might require that minuette v be an extended wave.
What about if you brought the movement one degree down and call it minuette i instead of minute c, like what I suggested to you in the March 12 update. It means that there are two nested 1-2s, and the Fibonacci ratios become more manageable.
The count works fine for the alternate. It is the same as the one I suggested.
Thanks for considering.
Are you referring to the main hourly wave count? My answer assumes you are.
I have no problem with an extended fifth wave. Or the target for the third wave may be too low.
The main reason why I chose minuette wave degree for minuette waves (i) and (ii) is because of the red candlestick for Friday’s session. While this looks like a clear second wave correction showing up on the daily chart I’ll leave it at this degree.
It’s possible we may have more than just two corrections (one second wave and one fourth wave) show up on the daily chart as minute wave c unfolds. If that’s the case I would consider moving this labelling down one degree.
The other reason I chose that degree is timing. If I expect only another 7 days to the target then I’d only expect one more correction to show on the daily chart.
I’d rather use the blue 1-3 trend line than the target though, and I’d rather not try to estimate duration of waves and ending dates for the S&P because it doesn’t often exhibit Fibonacci numbers in how long it’s waves take. It’s more often off by quite a bit. Unlike Gold, where that technique is a little more reliable.
Thanks Lara for clarifying. Let’s see how this plays out before deciding. Who knows, maybe the alternate may prove to be correct after all.