
A new low was expected to begin the session. The upwards trend should have resumed.
Summary: The short term target is at 2,139. A new high above 2,113.43 would provide price confirmation that the bull market will continue for a little longer, and would provide confidence in the final target at 2,191.
Click on charts to enlarge.
Bull Wave Count
I will favor neither the bull or bear wave count. Both are viable and both expect this current upwards impulse may again be close to complete.
To see a weekly chart with subdivisions and how to draw trend lines and channels click here.
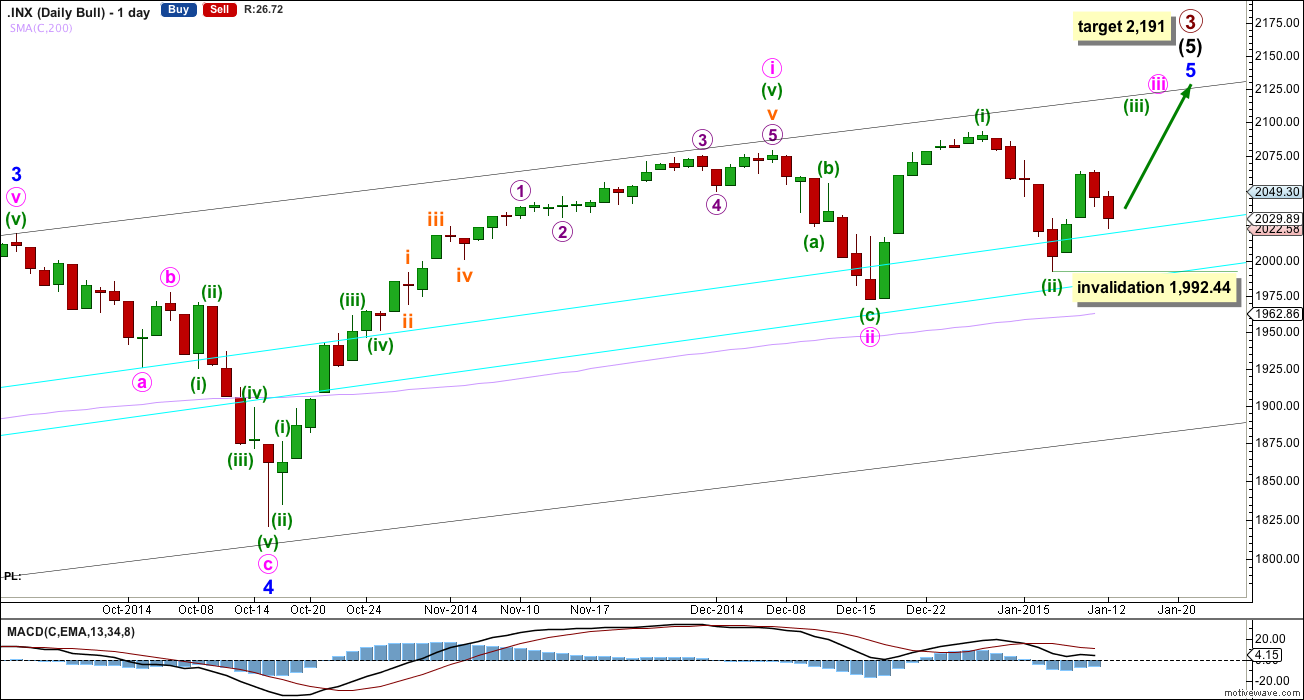
Upwards movement from the low at 666.79 subdivides as an incomplete 5-3-5. For the bull wave count this is seen as primary waves 1-2-3.
The aqua blue trend lines are traditional technical analysis trend lines. These lines are long held, repeatedly tested, and shallow enough to be highly technically significant. When the lower of these double trend lines is breached by a close of 3% or more of market value that should indicate a trend change. It does not indicate what degree the trend change should be though. It looks like the last two corrections may have ended just short of the lower aqua blue trend line, which gives the wave count a typical look.
I have pulled the upper trend line down a little to touch the low of minute wave a within minor wave 4. This may be a better position for recent movement.
There is still triple technical divergence between MACD and price at the weekly chart level.
Minute wave i lasted seven weeks, 36 days, which is two days longer than a Fibonacci 34. Minute wave iii may be even in duration to minute wave i. This would see it continue for a further 17 trading days.
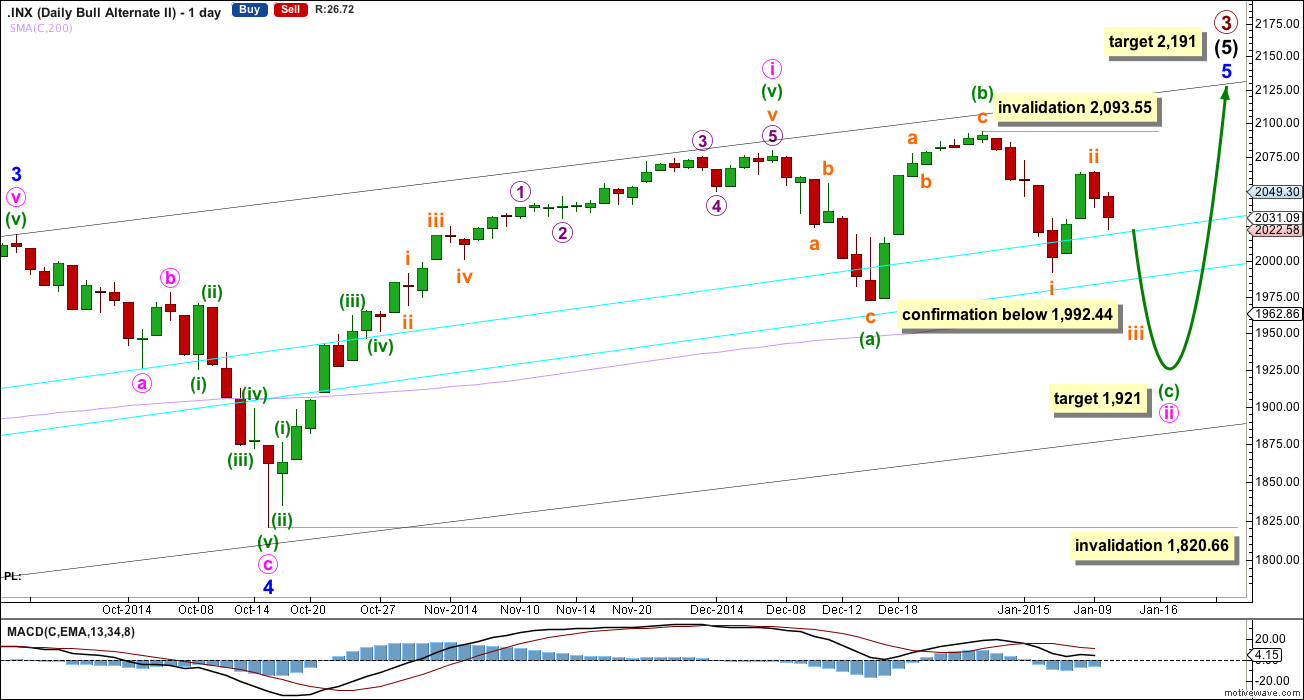
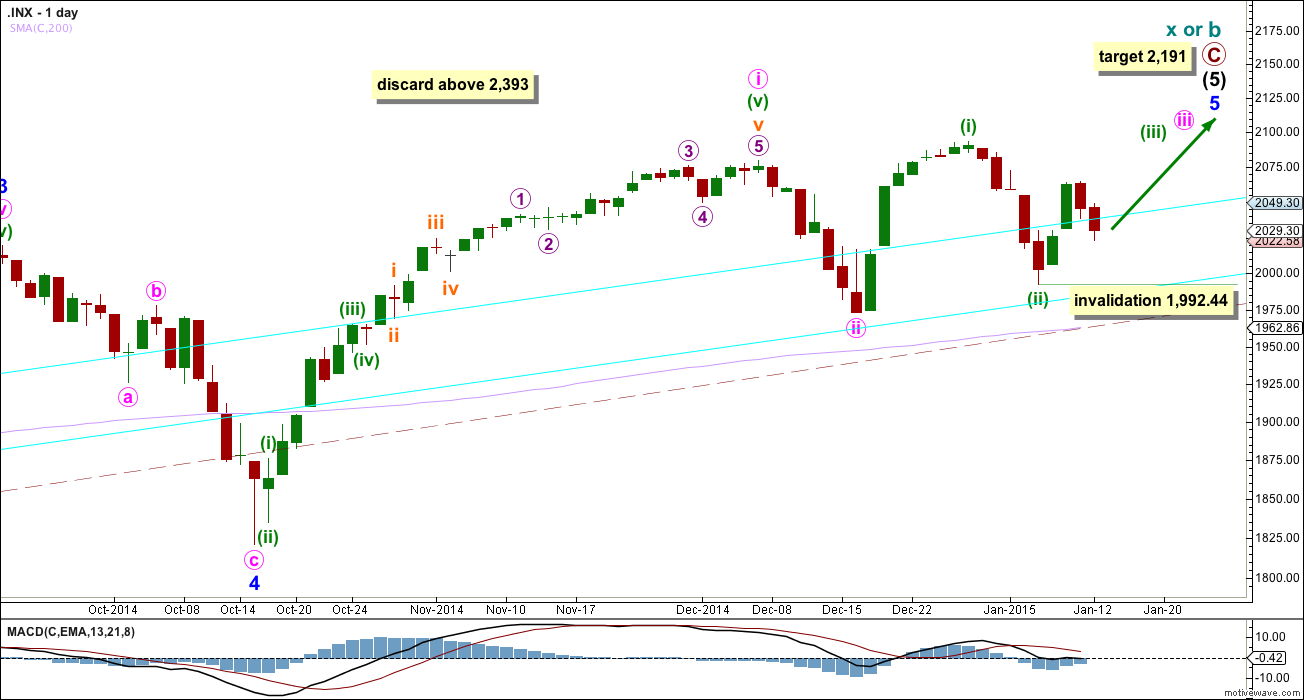
Minute wave iii may show its subdivisions clearly on the daily chart. The middle of it, minuette wave (iii) may also show its subdivisions clearly on the daily chart. Within minuette wave (iii) no second wave correction may move beyond its start below 1,992.44.
At 2,191 primary wave 3 would reach 1.618 the length of primary wave 1. This would expect that within minor wave 5 minute wave iii will be shorter than minute wave i, and minute wave v will be shorter still. Or the target is wrong.
If 1,992.44 is breached the second alternate would be confirmed.
Main Count Hourly Chart
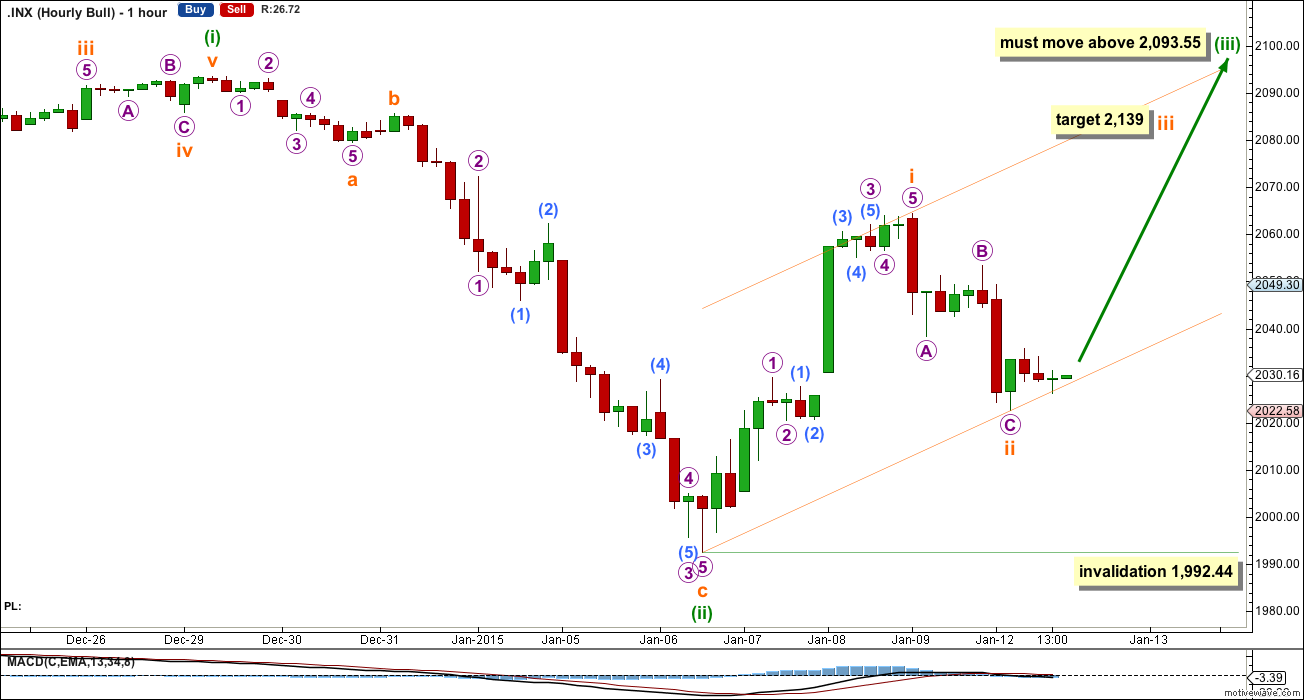
Minuette wave (iii) must move beyond the end of minuette wave (i) above 2,093.55. It must move far enough above this point to allow room for a subsequent fourth wave correction which may not move back into first wave price territory. I am still not calculating a target for minuette wave (iii) for you because it should be longer than equality in length with minuette wave (i) (because minuette wave (ii) was so deep) and were it to reach 1.618 the length of minuette wave (i) it would end too close to the final target at 2,191. I do not think minuette wave (iii) will exhibit a Fibonacci ratio to minuette wave (i). A target for it to end may better be calculated using the waves within it.
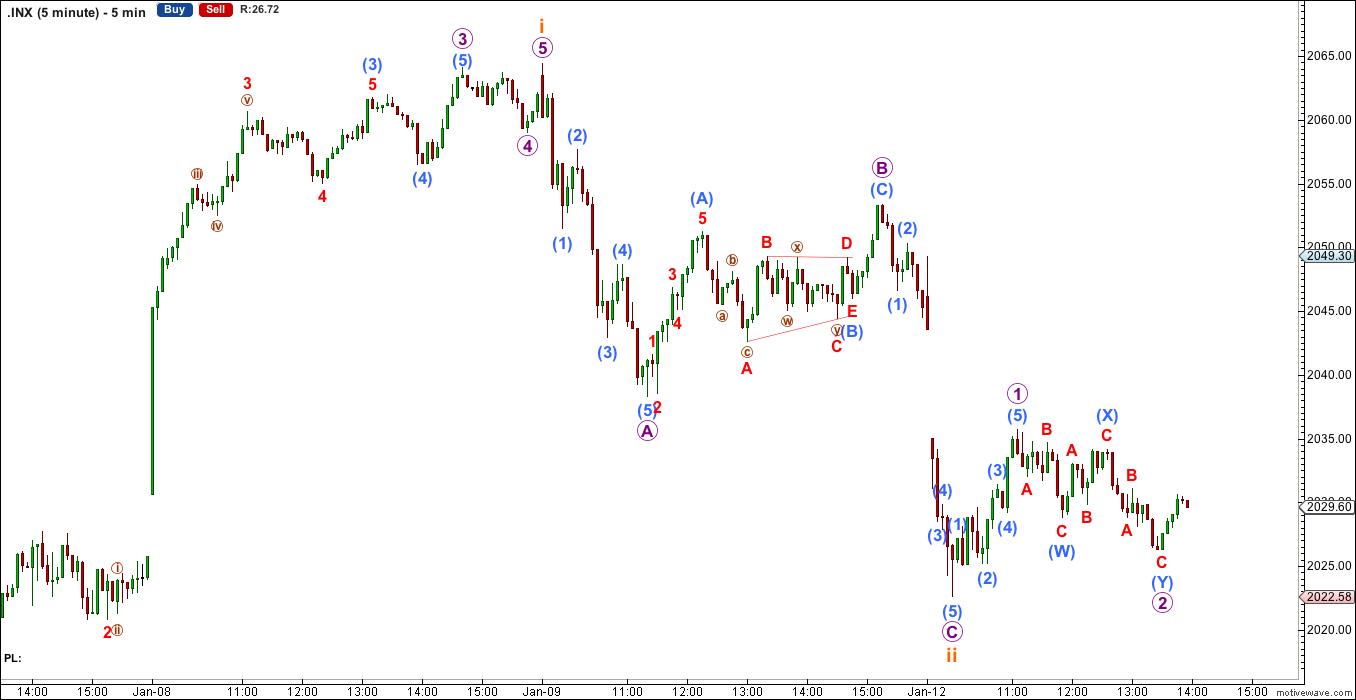
Subminuette wave ii moved lower and is now a complete zigzag. There is no Fibonacci ratio between micro waves A and C within it. It is very likely to be over here because the structure is complete and it is a typically deep second wave correction. However, on the five minute chart the first upwards wave after the end of subminuette wave ii is ambiguous, and may be seen as either a five or a three. So I cannot have full confidence today that subminuette wave ii is over. If it continues lower as a double zigzag then it may not move beyond the start of subminuette wave i below 1,992.44.
If subminuette wave ii is over now and subminuette wave iii has just begun then at 2,139 it would reach 1.618 the length of subminuette wave i. Subminuette wave iii is a third wave within a third wave within a third wave and should show a clear strong increase in upwards momentum.
Alternate Bull Wave Count
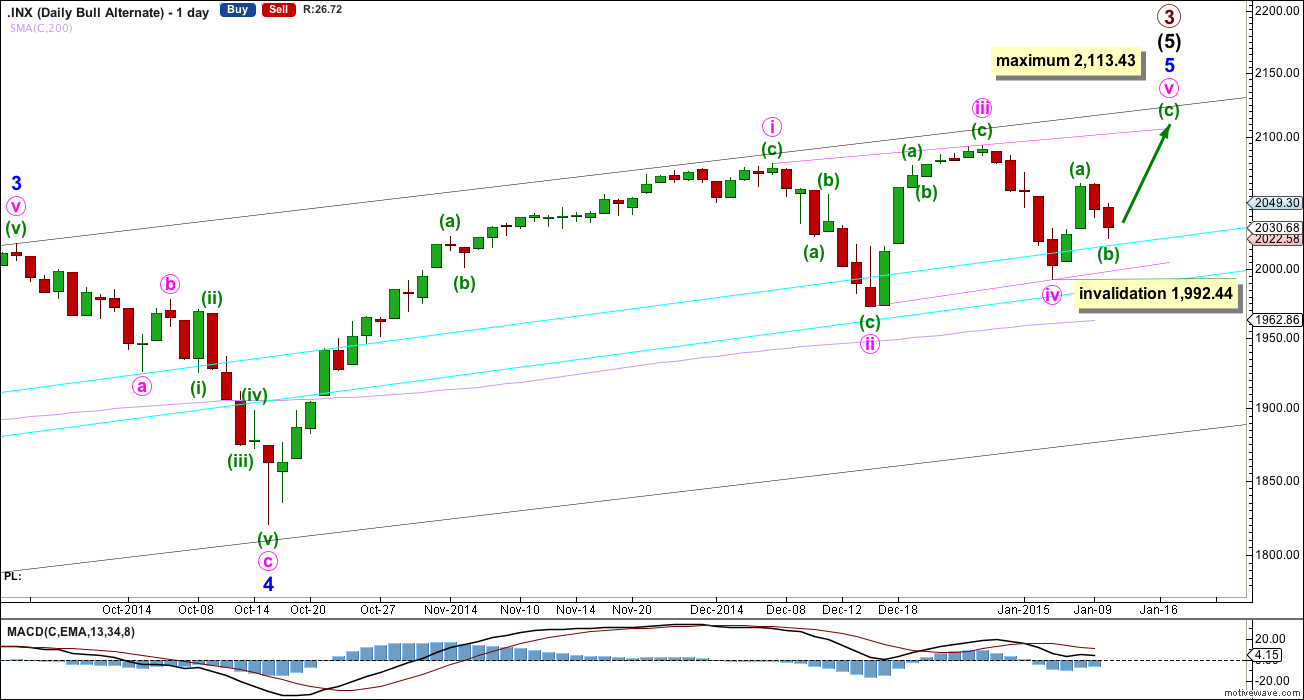
Alternatively, minor wave 5 may be an ending contracting diagonal. Within an ending diagonal all sub waves must be zigzags, and the fourth wave must overlap back into first wave price territory.
Within this diagonal minute wave ii is only .41 of minute wave i, and minute wave iv is now .84 of minute wave iii. Within diagonals the normal depth of second and fourth waves is between 0.66 to 0.81. Minute wave ii is very shallow, and now minute wave iv is a little deeper than normal.
Within minute wave v the final upwards wave for minuette wave (c) is now required. The diagonal is contracting and a third wave may never be the shortest. This limits minute wave v to no longer than equality with minute wave iii at 2,113.43. Within contracting diagonals the final fifth wave commonly ends with a very small overshoot of the 1-3 trend line, so I would expect for this idea for upwards movement to end slightly above the pink i-iii trend line.
Within minute wave v minuette wave (b) may not move beyond its start below 1,992.44.
This alternate may see a swift end to primary wave 3.
Second Alternate Bull Wave Count
If price continues lower and invalidates the main wave count with a new low below 1,992.44 this is the alternate I would use.
It is possible that recent downwards movement is a continuation of minute wave ii as an expanded flat correction. Within it minuette wave (b) is a 113% correction of minuette wave (a). At 1,921 minuette wave (c) would reach 1.618 the length of minuette wave (a). This would see the lower aqua blue trend line again breached, which would be acceptable as long as price does not close below it by 3% or more of market value.
Minute wave ii may not move beyond the start of minute wave i below 1,820.66.
Within minuette wave (c) subminuette wave ii may not move beyond the start of subminuette wave i above 2,093.55.
Bear Wave Count
This bear wave count differs from the bull wave count at the monthly chart level and at super cycle wave degree. To see the historic picture go here.
The subdivisions within primary waves A-B-C are seen in absolutely exactly the same way as primary waves 1-2-3 for the bull wave count.
At cycle degree wave b is over the maximum common length of 138% the length of cycle wave a, at 165% the length of cycle wave a. At 2,393 cycle wave b would be twice the length of cycle wave a and at that point this bear wave count should be discarded.
While we have no confirmation of this wave count we should assume the trend remains the same, upwards. This wave count requires confirmation before I have confidence in it.
This analysis is published about 03:33 p.m. EST.
The action in the VIX can sometimes give good indication of the arrival of terminal waves, especially during declines. It appears based on VIX action today that the decline is not done…