
A little more downwards movement was expected before a resumption of the upwards trend, but a breach of the channel on the hourly chart indicated that downwards movement was over.
Note: Nady Laymoud takes over presentation of the analysis tomorrow until 22nd January, 2015. I will still be looking at this market everyday, and I’ll be discussing the wave count with Nady. This is so I can have a short break while I do some travelling.
Summary: The upwards trend has most likely resumed. Upwards momentum should increase over the next few days and price must make new highs above 2,093.55.
Click on charts to enlarge.
Bull Wave Count
I will favor neither the bull or bear wave count. Both are viable and both expect this current upwards impulse may again be close to complete.
To see a weekly chart with subdivisions and how to draw trend lines and channels click here.
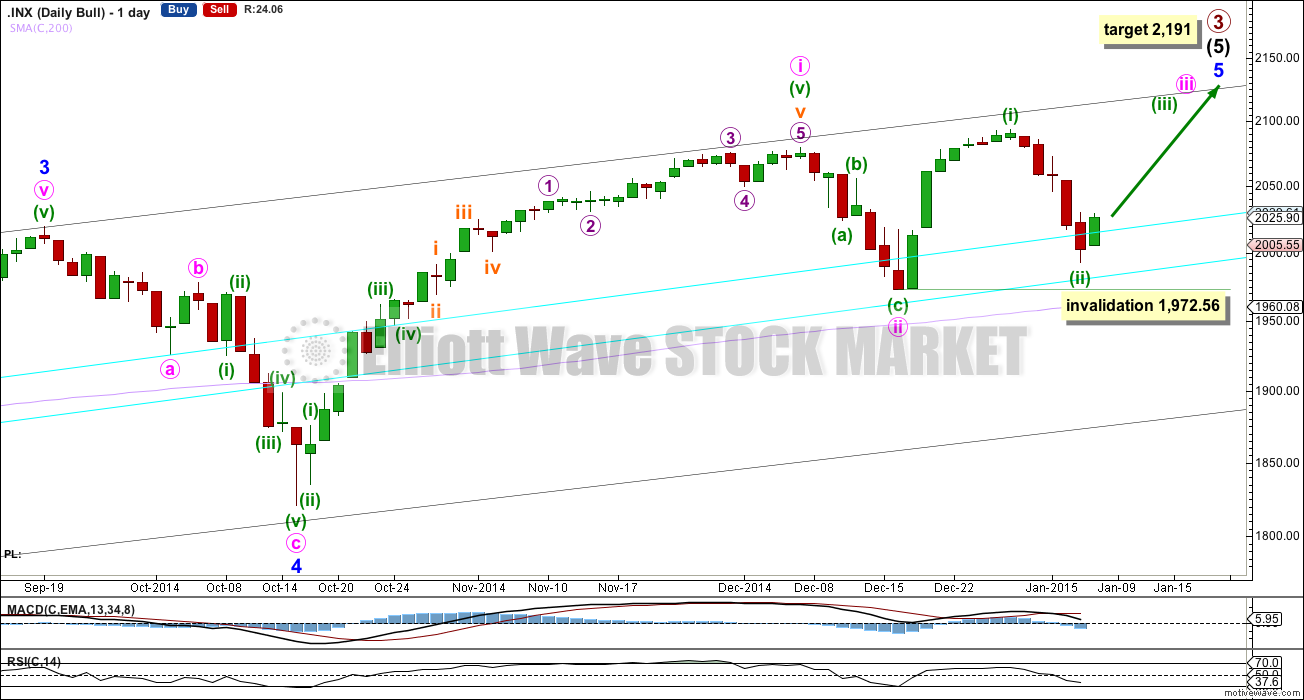
Upwards movement from the low at 666.79 subdivides as an incomplete 5-3-5. For the bull wave count this is seen as primary waves 1-2-3.
Within intermediate wave (5) minor wave 2 is an expanded flat and minor wave 4 is a zigzag. Minor wave 3 is 14.29 points longer than 1.618 the length of minor wave 1.
At intermediate degree there is also a very close relationship between intermediate waves (3) and (1): intermediate wave (3) is just 0.76 points less than 2.618 the length of intermediate wave (1).
The aqua blue trend lines are traditional technical analysis trend lines. These lines are long held, repeatedly tested, and shallow enough to be highly technically significant. When the lower of these double trend lines is breached by a close of 3% or more of market value that should indicate a trend change. It does not indicate what degree the trend change should be though. It looks like minute wave ii may have ended just short of the lower aqua blue trend line, which gives the wave count a typical look.
I have pulled the upper trend line down a little to touch the low of minute wave a within minor wave 4. This may be a better position for recent movement.
There is still triple technical divergence between MACD and price at the weekly chart level.
Minute wave i lasted seven weeks, 36 days, which is two days longer than a Fibonacci 34. Minute wave iii may be even in duration to minute wave i. This would see it continue for a further 20 trading days.
Minute wave iii may show its subdivisions clearly on the daily chart. Recent downwards movement looks like a second wave correction which may not move beyond the start of minuette wave (i) below 1,972.56.
Wednesday’s session produced a bullish belt hold candle, which may be an indicator that the bullish trend has resumed. However, RSI does not show the market is oversold at this time, but it may not move down into oversold territory for a lower degree second wave correction.
At 2,191 primary wave 3 would reach 1.618 the length of primary wave 1. This would expect that minor wave 5 is either an ending contracting diagonal (minute wave i would be seen as a zigzag, which is possible) or within minor wave 5 minute wave iii will be shorter than minute wave i, and minute wave v will be shorter still. Both these scenarios are possible. Or the target is wrong.
If 1,972.56 is breached the second alternate would be confirmed.
Main Count Hourly Chart
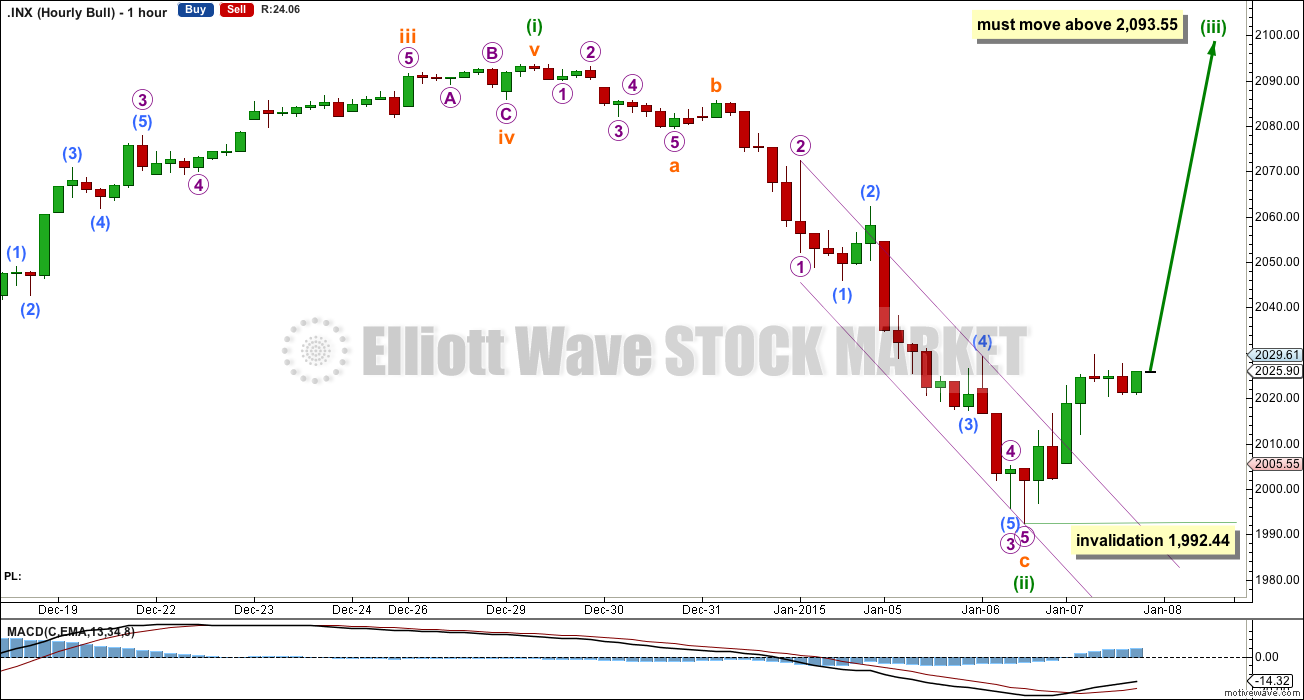
Minuette wave (ii) was complete and this was finally confirmed with a clear breach of the channel on the hourly chart.
Subminuette wave c is just 2.95 points short of 6.854 the length of subminuette wave a.
Ratios within subminuette wave c are: micro wave 3 is 4.39 points longer than 2.618 the length of micro wave 1, and micro wave 5 has no Fibonacci ratio to either of micro waves 3 or 1.
Ratios within micro wave 3 are: submicro wave (3) is 2.37 points longer than 1.618 the length of submicro wave (1), and submicro wave (5) has no Fibonacci ratio to either of submicro waves (1) or (3).
The channel drawn about downwards movement is a best fit and more conservative than a channel using either of Elliott’s techniques (it has a shallower slope). It is clearly breached by upwards movement. This is the trend change confirmation I was waiting for.
This wave count now expects to see an increase in upwards momentum. Minuette wave (iii) must move above the end of minuette wave (i) at 2,093.55. It must move far enough above this point to allow movement for a subsequent fourth wave correction (which should be shallow) that may not move back into first wave price territory.
I am not providing a target yet for minuette wave (iii). It should be longer than equality with minuette wave (i) at 120.99 points, but it may not be as long as 1.618 the length of minuette wave (i) because that would give a target too close to the target for the end of primary wave 3 at 2,191. Minuette wave (iii) may not exhibit a Fibonacci ratio to minuette wave (i) and so a target for it to end may better be calculated using the subminuette waves within it.
Within minuette wave (iii) no second wave correction may move beyond its start below 1,992.44.
Alternate Bull Wave Count
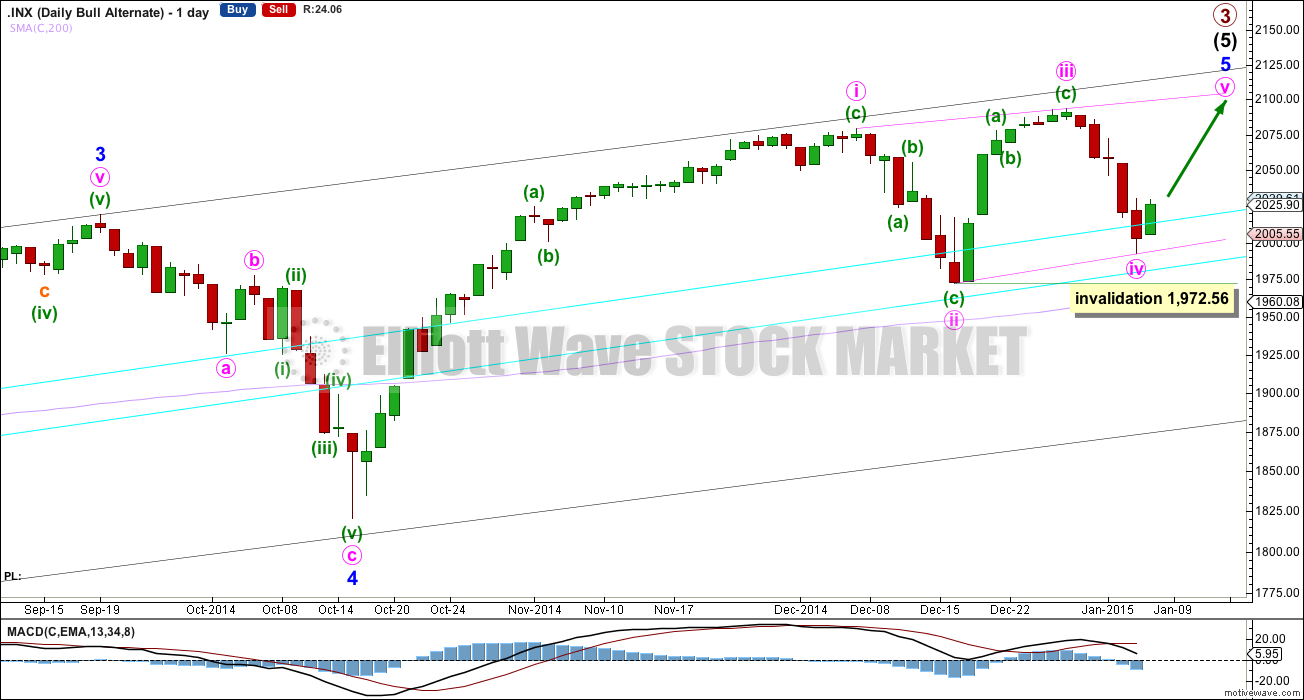
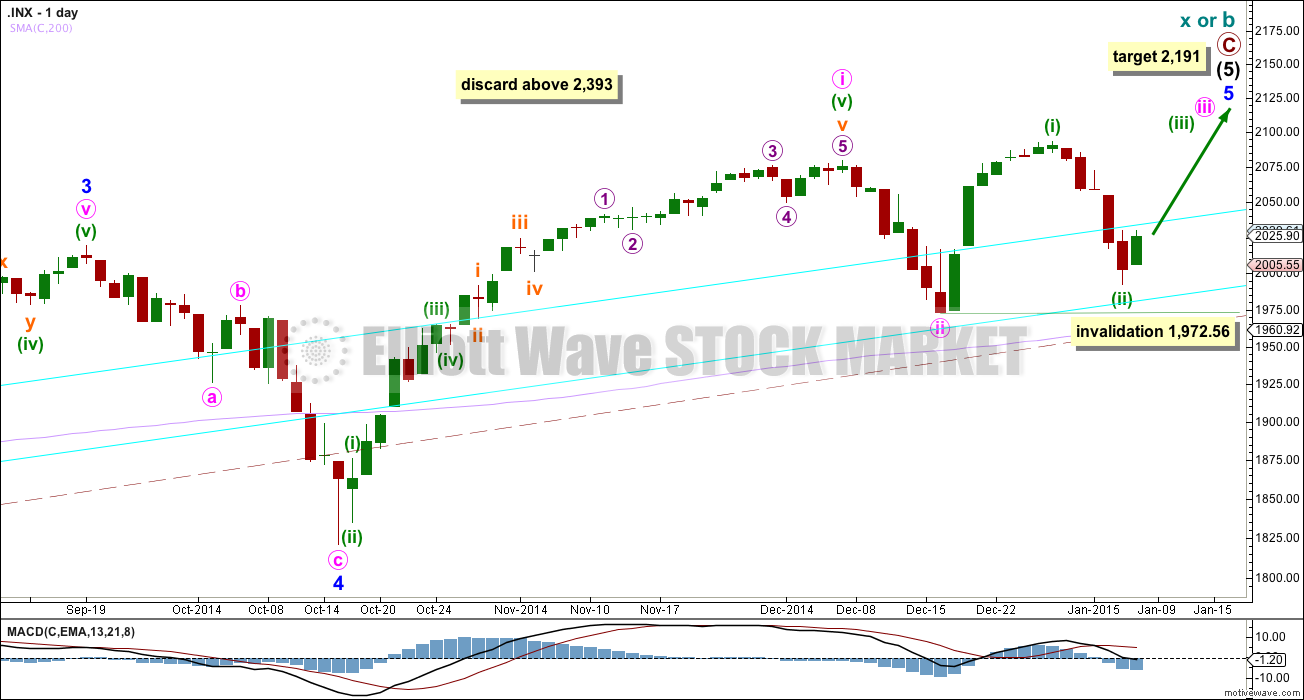
Alternatively, minor wave 5 may be an ending contracting diagonal. Within an ending diagonal all sub waves must be zigzags, and the fourth wave must overlap back into first wave price territory.
Within this diagonal minute wave ii is only .41 of minute wave i, and minute wave iv is now .84 of minute wave iii. Within diagonals the normal depth of second and fourth waves is between 0.66 to 0.81. Minute wave ii is very shallow, and now minute wave iv is a little deeper than normal.
If minute wave iv moves any lower it may not move beyond the end of minute wave ii at 1,972.56.
This alternate may see a swift end to primary wave 3, which may not exhibit a Fibonacci ratio to primary wave 1. The final fifth wave of the diagonal would be very likely to end with a very small overshoot of the upper i-iii diagonal trend line.
Second Alternate Bull Wave Count
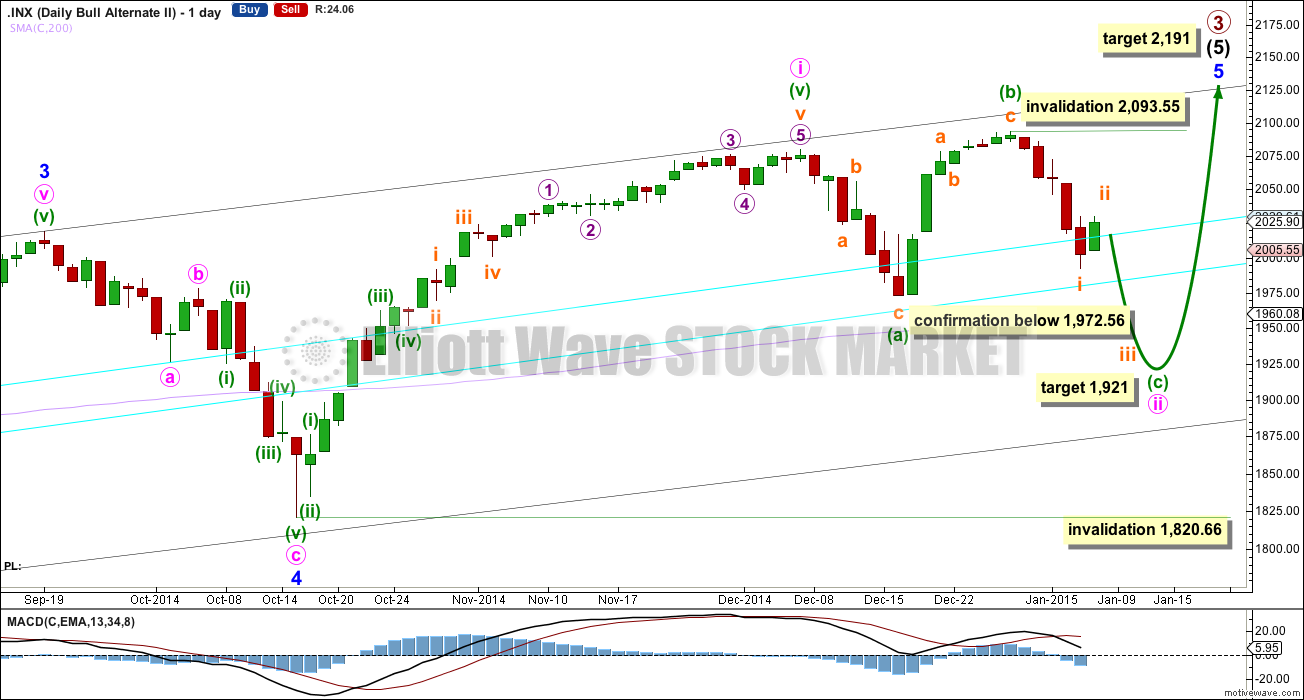
If price continues lower and invalidates the main wave count with a new low below 1,972.56 this is the alternate I would use.
It is possible that recent downwards movement is a continuation of minute wave ii as an expanded flat correction. Within it minuette wave (b) is a 113% correction of minuette wave (a). At 1,921 minuette wave (c) would reach 1.618 the length of minuette wave (a). This would see the lower aqua blue trend line again breached, which would be acceptable as long as price does not close below it by 3% or more of market value.
Minute wave ii may not move beyond the start of minute wave i below 1,820.66.
Within minuette wave (c) subminuette wave ii may not move beyond the start of subminuette wave i above 2,093.55.
Bear Wave Count
This bear wave count differs from the bull wave count at the monthly chart level and at super cycle wave degree. To see the historic picture go here.
The subdivisions within primary waves A-B-C are seen in absolutely exactly the same way as primary waves 1-2-3 for the bull wave count.
At cycle degree wave b is over the maximum common length of 138% the length of cycle wave a, at 165% the length of cycle wave a. At 2,393 cycle wave b would be twice the length of cycle wave a and at that point this bear wave count should be discarded.
While we have no confirmation of this wave count we should assume the trend remains the same, upwards. This wave count requires confirmation before I have confidence in it.
This analysis is published about 09:13 p.m. EST.
Lara I know you have to assume the trend is still up, but this is about as clear an impulse as I’ve seen in awhile. I like your second alternate for various reasons other than wave count by itself. However, minuette ii should continue higher for another da or so after b wave triangle is completed.