
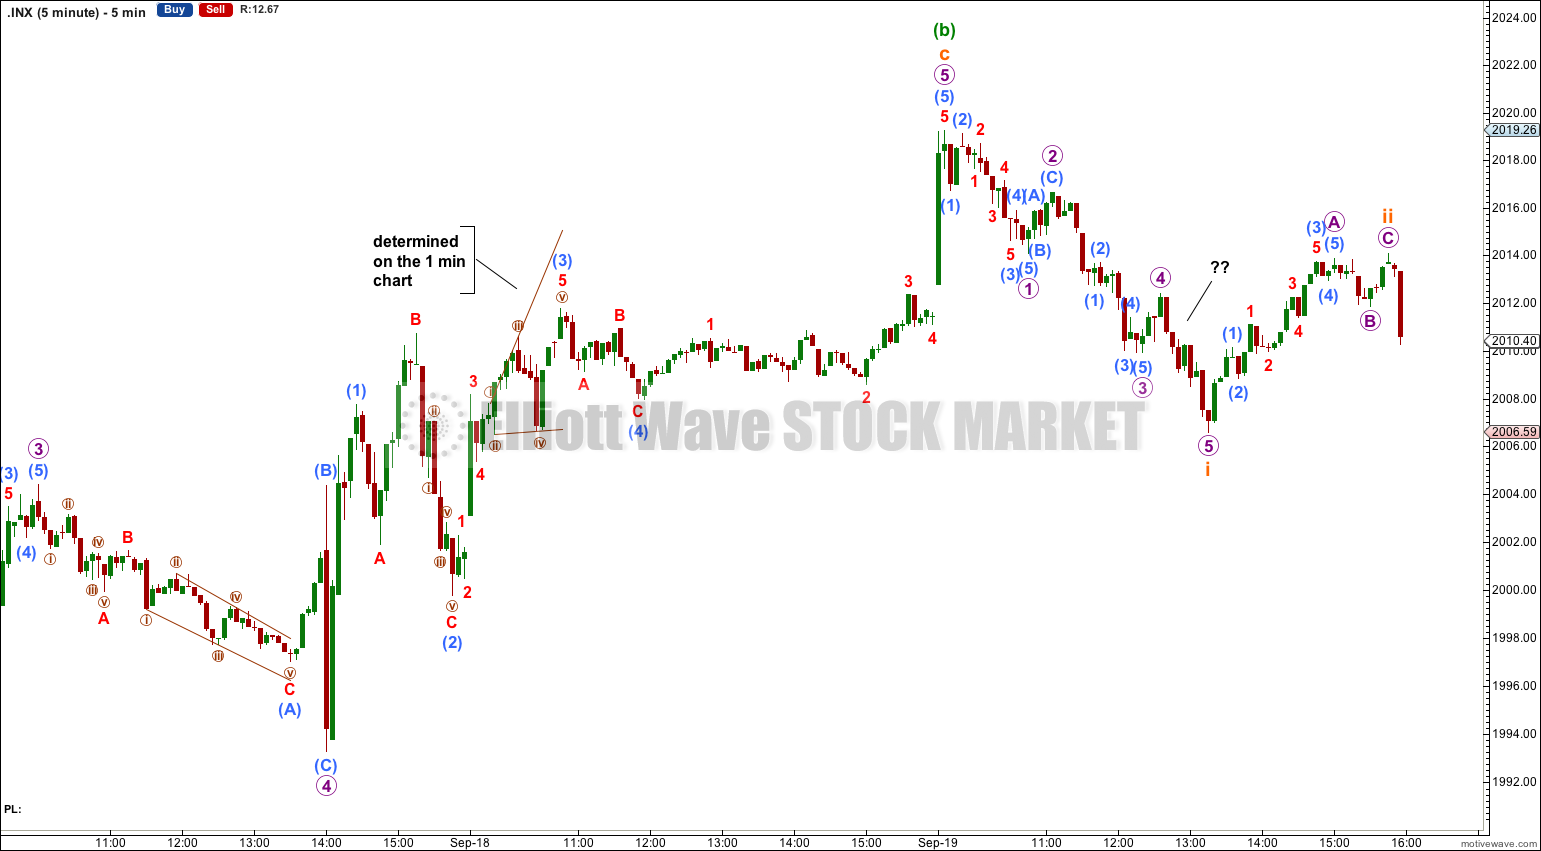
Upwards movement was expected, but the target at 2,013 was comfortably passed. Thereafter, downwards movement to complete a red candlestick for Friday’s session was expected.
Summary: The fourth wave correction is either a flat correction which may end in another week, or a triangle which may end in another two weeks. Overall, I expect either one five wave structure down from here to a target at 1,968 or choppy overlapping sideways movement for maybe up to two weeks. Monday should produce another red candlestick.
Click on charts to enlarge.
Bullish Wave Count
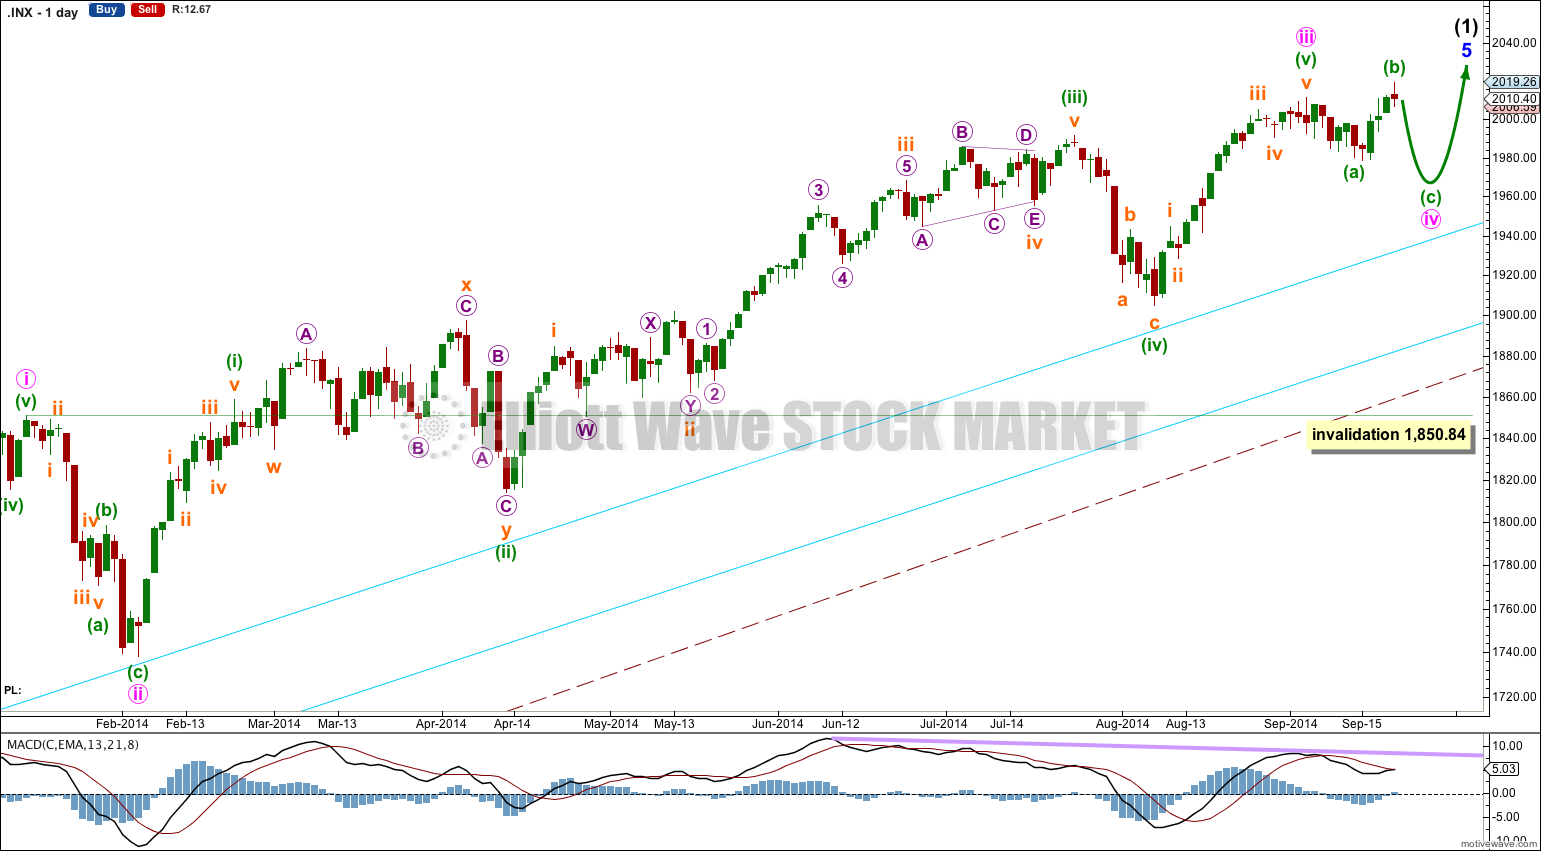
The aqua blue trend lines are critical. Draw the first trend line from the low of 1,158.66 on 25th November, 2011, to the next swing low at 1,266.74 on 4th June, 2012. Create a parallel copy and place it on the low at 1,560.33 on 24th June, 2013. While price remains above the lower of these two aqua blue trend lines we must assume the trend remains upwards. This is the main reason for the bullish wave count being my main wave count.
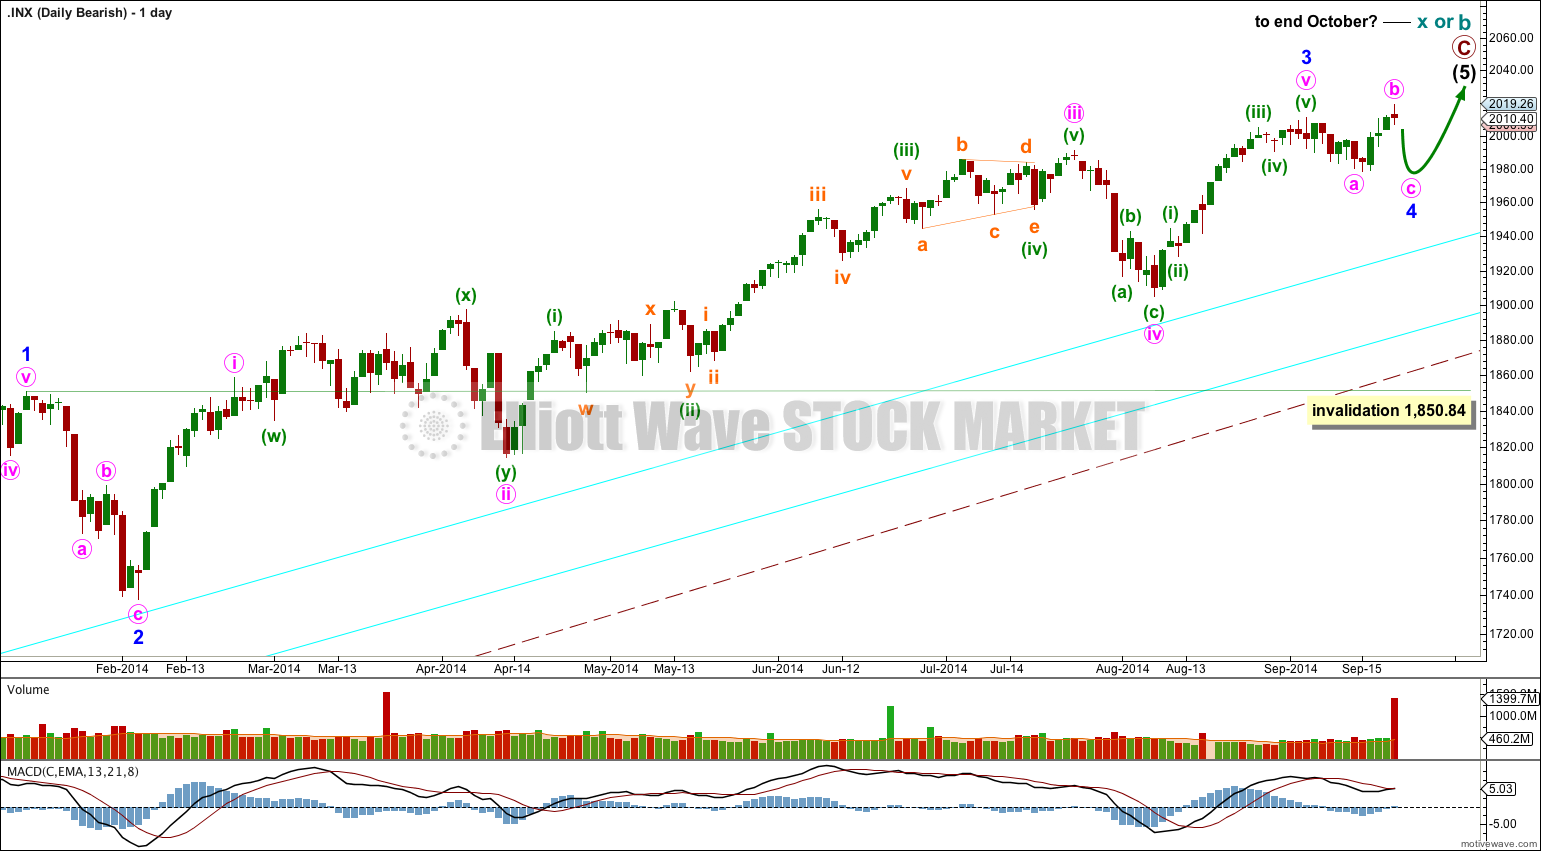
There are a couple of things about this wave count of which I am confident. I see minor wave 3 within intermediate wave (1) as over at 1,729.86 (19th September, 2013). It has the strongest upwards momentum and is just 0.76 longer than 2.618 the length of minor wave 1. At 455 days duration this is a remarkably close Fibonacci ratio. The subdivisions within it are perfect. If this is correct then minor wave 4 ends at 1,646.47 and this is where minor wave 5 begins.
Because there is already a very close Fibonacci ratio between minor waves 1 and 3 I would not actually expect to see a Fibonacci ratio between minor wave 5 to either of 1 or 3. This means that the target for intermediate wave (1) to end would best be calculated at minute wave degree, within minor wave 5. I will not be able to do that until minute wave iv has ended.
Minor wave 5 is unfolding as an impulse. If minor wave 5 has passed its middle then I would expect to see more divergence between price and MACD develop over coming weeks.
There is no Fibonacci ratio between minute waves iii and i. This makes it more likely we shall see a Fibonacci ratio between minute wave v and either of iii or i, so when minute wave iv is complete I should be able to calculate a target with a reasonably good probability.
Minute wave ii lasted 14 sessions and was a relatively deep 55% zigzag correction. Given the guideline of alternation I would expect minute wave iv to be a more shallow sideways correction. It is most likely to be a flat, double flat, combination or triangle. These structures tend to be long lasting, so I would expect it may take longer than three weeks.
Combinations, expanded flat corrections and running triangles may all include new price extremes beyond their starts. The new high above 2,011.17 fits with this wave count. Minute wave iv should be very choppy and overlapping, and will be difficult to analyse (alternate wave counts will be necessary). While it is unfolding the wave count will change. There are still several different structures it may take at this stage.
I would expect minute wave iv to end short of the upper aqua blue trend line, continuing a pattern the S&P has shown now for over a year.
The large maroon – – – channel is copied over from the weekly chart. It is drawn in exactly the same way on bull and bear wave counts. For the bull wave count this channel is termed a base channel about primary waves 1 and 2. A lower degree second wave should not breach the lower edge of a base channel drawn about a first and second wave one or more degrees higher. The lower maroon – – – trend line differentiates the bull and bear wave counts at cycle degree and monthly chart level.
Main Hourly Wave Count
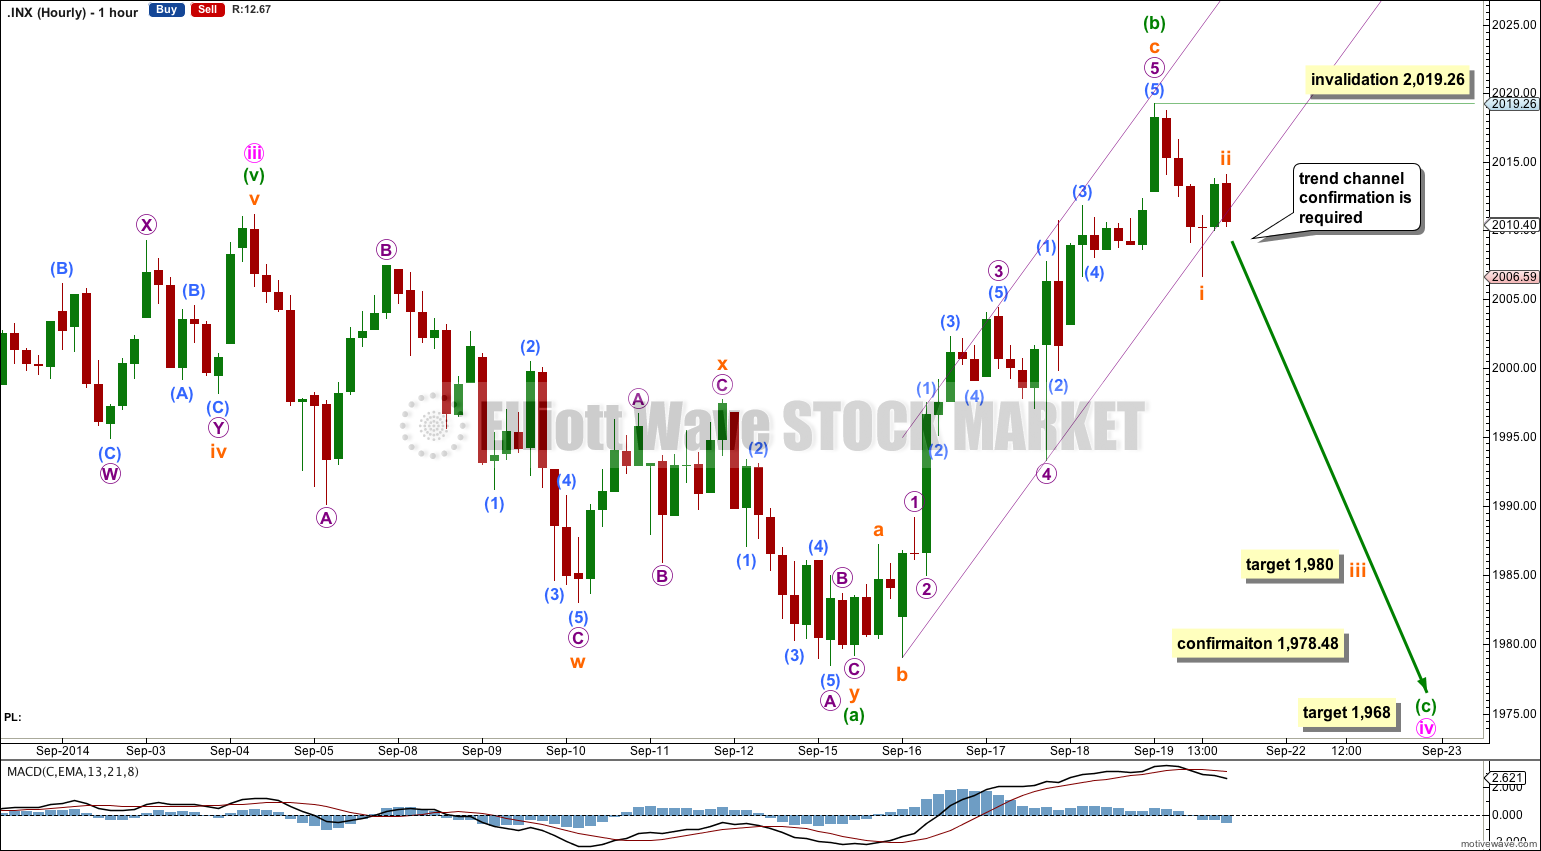
If minute wave iv is unfolding as a flat correction then within it minuette wave (b) is now a 125% correction of minuette wave (a). This is within the normal range of 100% to 138%, and indicates the flat is the most common expanded type.
Expanded flat corrections most commonly have C waves which are 1.618 the length of their A waves. At 1,968 minuette wave (c) would reach 1.618 the length of minuette wave (a). Movement below 1,978.48 would invalidate the triangle wave count below and confirm minute wave iv as a flat correction.
Minuette wave (c) must subdivide as a five wave structure. Within it subminuette wave ii may not move beyond the start of subminuette wave i above 2,019.26.
Within minuette wave (c) at 1,980 subminuette wave iii would reach 2.618 the length of subminuette wave i.
I have drawn a best fit channel about minuette wave (b). Only when this channel is clearly breached with a full hourly candlestick below the lower trend line and not touching it will I have confidence in this trend change at minuette wave degree.
Alternate Hourly Wave Count
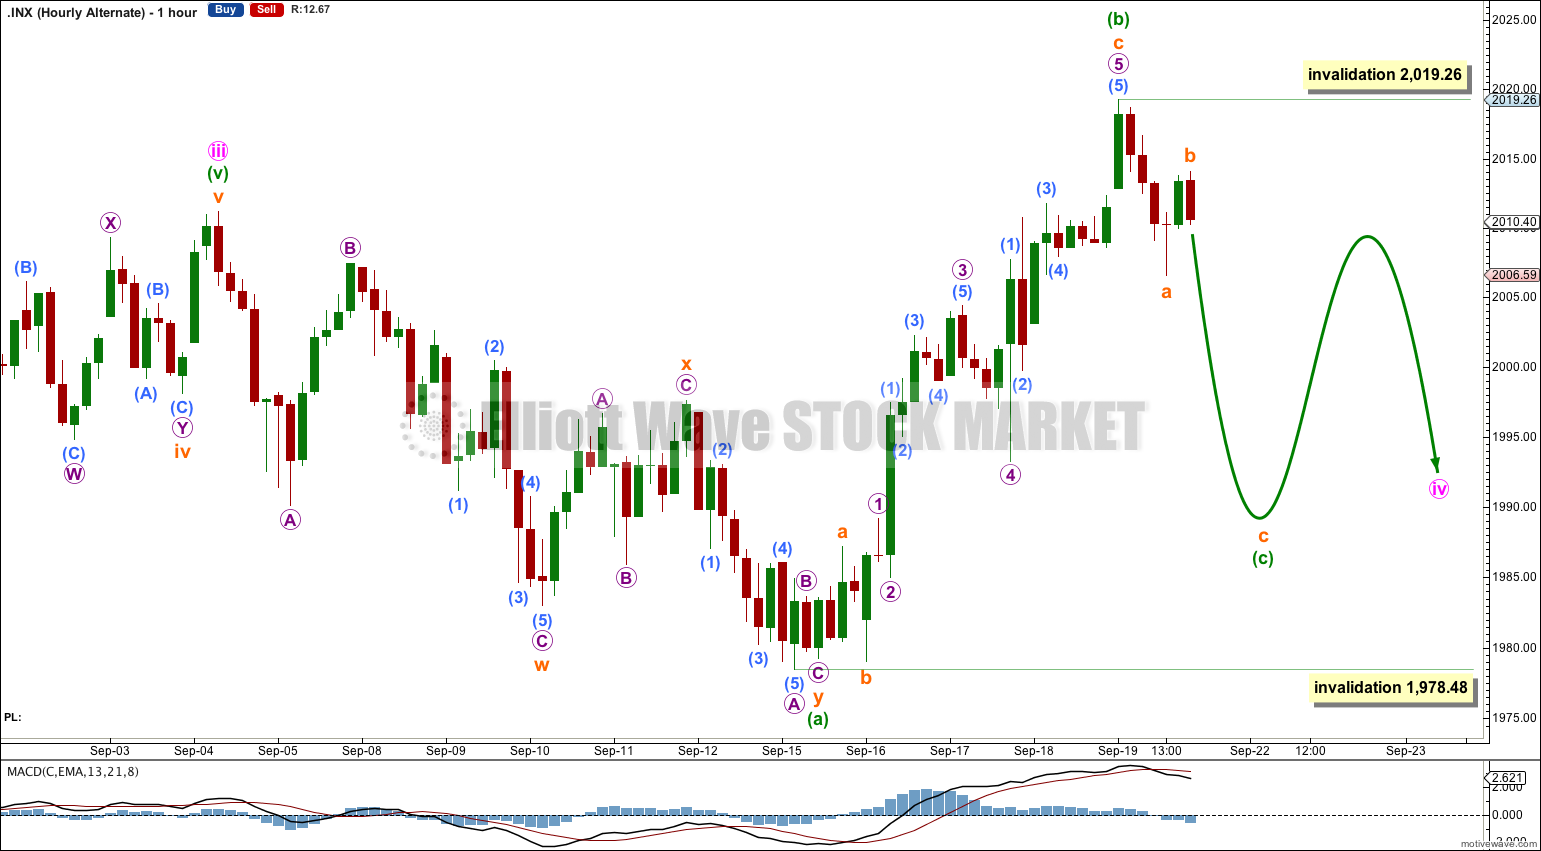
If minute wave iv is unfolding as a triangle then it may be either a running contracting triangle or a running barrier triangle.
Within both contracting and barrier triangles minuette wave (c) may not move beyond the end of minuette wave (a). I will leave this invalidation point at the price low of 1,978.48 to allow for the possibility of an error in my analysis around the end of minuette wave (a).
If minute wave iv is a triangle then minuette wave (c) must subdivide as a zigzag. If the next downwards movement subdivides as a three wave structure this wave count would be correct.
Triangles tend to be more time consuming structures than expanded flats and only a little less common. If minute wave iv is a triangle it may take another one to two weeks to complete.
Bearish Alternate Wave Count
This bearish alternate wave count expects that the correction is not over. The flat correction which ended at 666.79 was only cycle wave a (or w) of a larger super cycle second wave correction.
The structure and subdivisions within primary wave C for the bear wave count are the same as for intermediate wave (1) for the bull wave count. Thus the short to mid term outlook is identical.
The differentiation between the bull and bear wave count is the maroon – – – channel. The bull wave count should see price remain above the lower maroon – – – trend line. The bear wave count requires a clear breach of this trend line. If this trend line is breached by a full weekly candlestick below it and not touching it then this bear wave count would be my main wave count and I would then calculate downwards targets.
We should always assume the trend remains the same until proven otherwise; the trend is your friend. While price remains above the lower maroon – – – trend line I will assume that the S&P 500 remains within a bull market.
This analysis is published about 11:07 p.m. EST.
Hi Lara, are you sure your Minuette wave b is not the end of Minute wave III pink circle on the Daily chart?
Yes. I’m sure.