
Price moved slightly lower overall for Friday to complete a red candlestick, which was expected for the main hourly Elliott wave count.
The wave counts remain the same.
Summary: It is still most likely that minuette wave (iv) is incomplete. I expect downwards movement to end slightly below 1,911.45 in five more trading days. We could see a couple more days of sideways movement before the final wave down.
Click on charts to enlarge.
The aqua blue trend lines are critical. Draw the first trend line from the low of 1,158.66 on 25th November, 2011, to the next swing low at 1,266.74 on 4th June, 2012. Create a parallel copy and place it on the low at 1,560.33 on 24th June, 2013. While price remains above the lower of these two aqua blue trend lines we must assume the trend remains upwards. This is the main reason for the bullish wave count being my main wave count.
Bullish Wave Count.
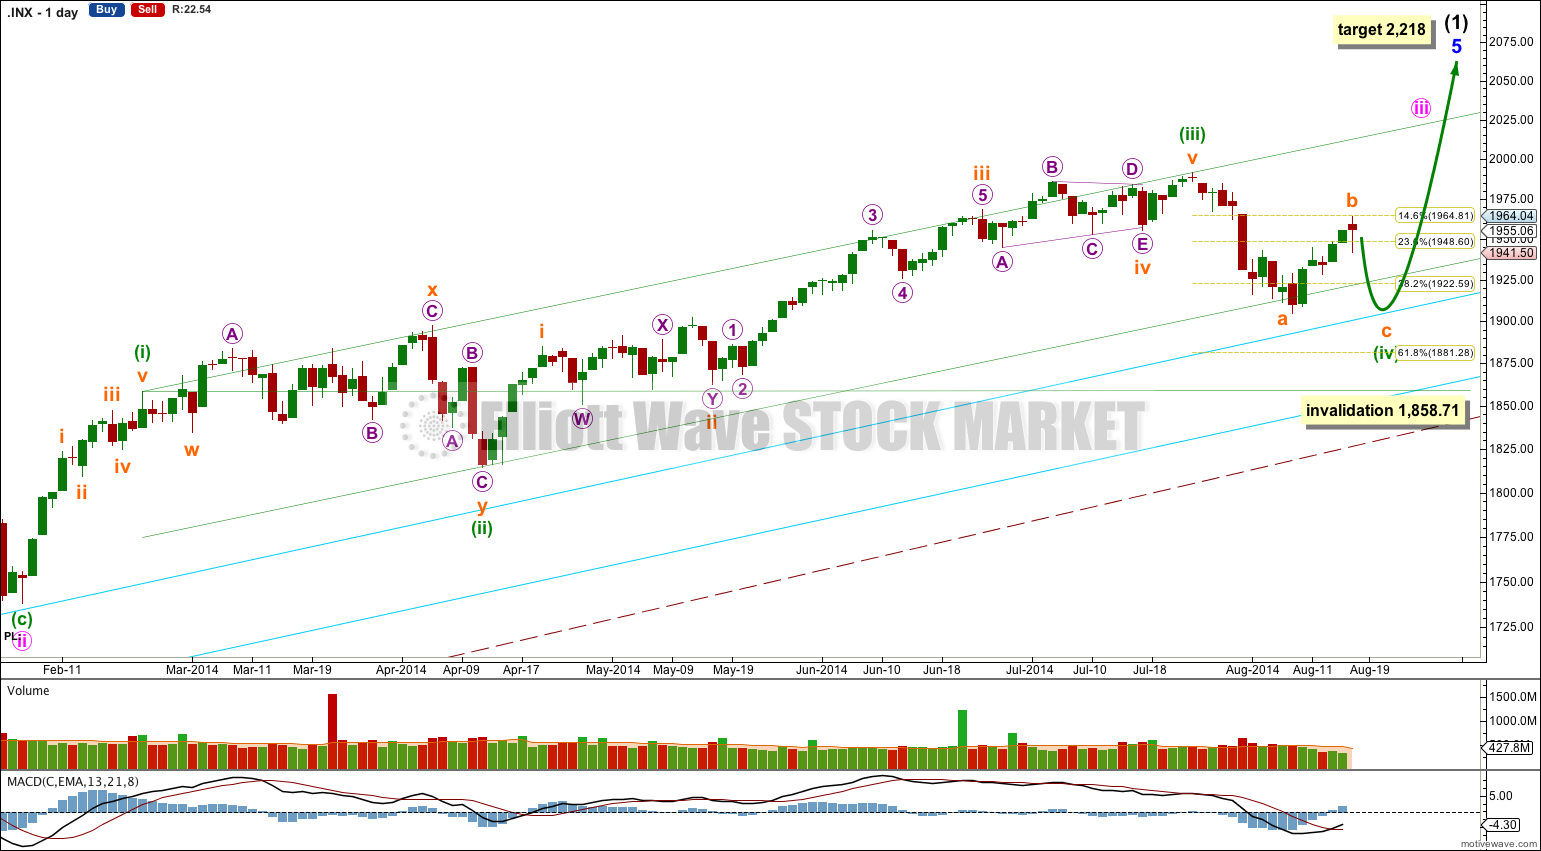
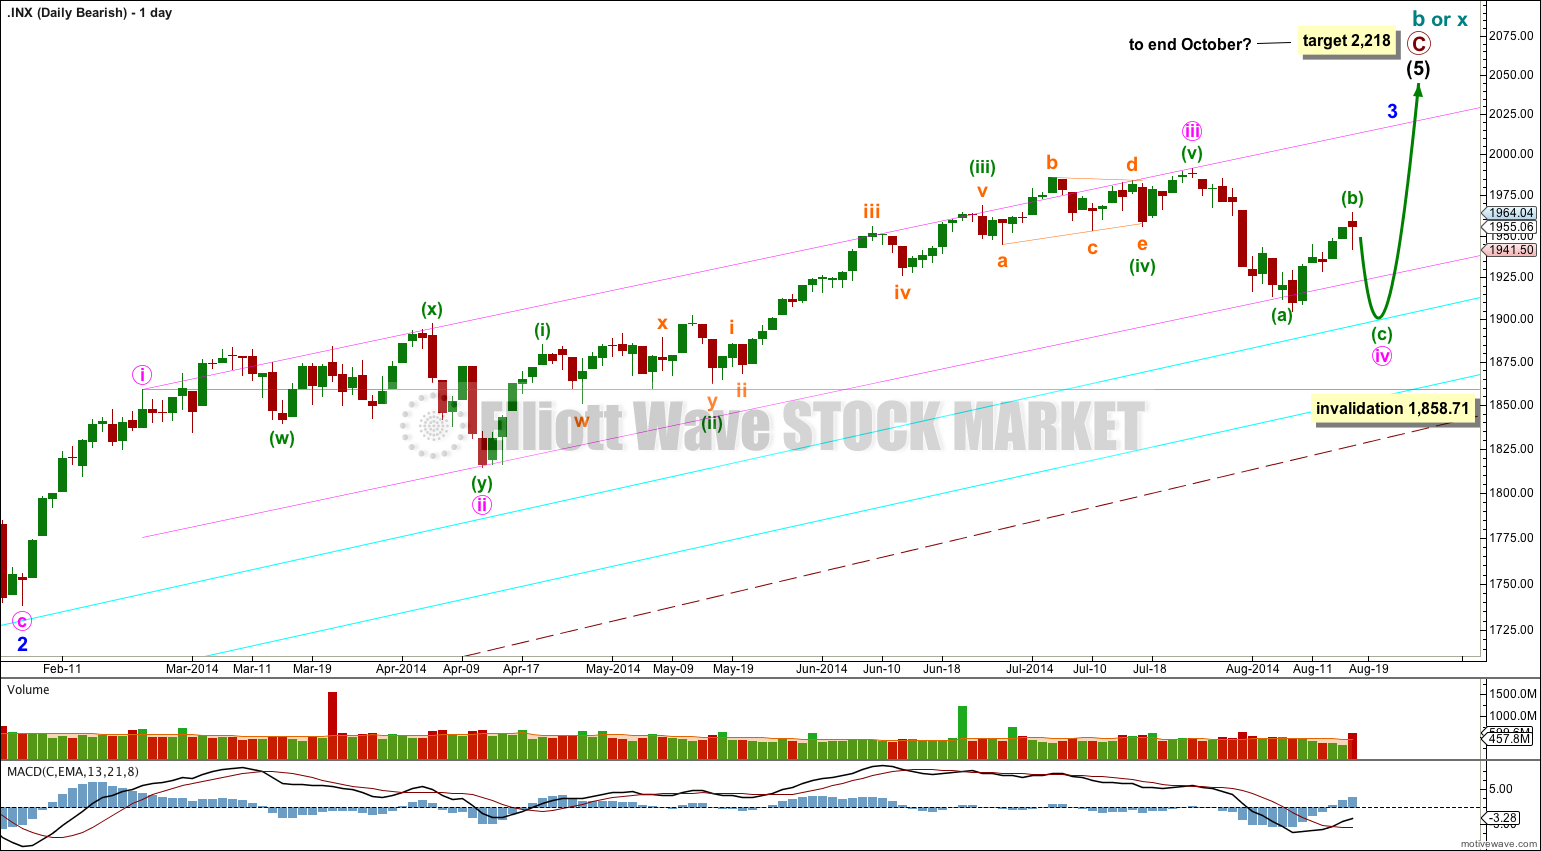
There are a couple of things about this wave count of which I am confident. I see minor wave 3 within intermediate wave (1) as over at 1,729.86 (19th September, 2013). It has the strongest upwards momentum and is just 0.76 longer than 2.618 the length of minor wave 1. At 455 days duration this is a remarkably close Fibonacci ratio. The subdivisions within it are perfect. If this is correct then minor wave 4 ends at 1,646.47 and this is where minor wave 5 begins.
Minor wave 5 is unfolding as an impulse. If minor wave 5 has passed its middle then I would expect to see more divergence between price and MACD develop over coming weeks.
Along the way up towards the final target I would expect to see two more corrections complete: the current correction for minuette wave (iv) and one more for minute wave iv.
Minuette wave (iv) may not move into minuette wave (i) price territory below 1,858.71.
At 2,218 minor wave 5 would reach equality in length with minor wave 3. This target may be met in October.
I have drawn a parallel channel about minute wave iii using Elliott’s first technique: draw the first trend line from the highs of minuette waves (i) to (iii), then place a parallel copy on the low of minuette wave (ii). Minuette wave (iv) so far slightly breaches the lower edge of this channel, and at its end I expect another small breach. This may indicate an overthrow of the channel on the opposite side for the upcoming fifth wave.
Minuette wave (iv) may reach as low as the 0.618 Fibonacci ratio of minuette wave (iii) at 1,881.28, which would provide alternation in depth of correction between minuette waves (ii) and (iv), (minuette wave (ii) was a shallow 37% correction). Downwards movement may find final support about the upper aqua blue trend line, continuing a pattern which has lasted about a year now. If the upper aqua blue trend line is overshot by downwards movement then I would expect price to find support at the lower aqua blue trend line, although it may not get that low.
Minuette wave (ii) lasted exactly a Fibonacci 34 sessions. So far minuette wave (iv) has lasted 16 sessions, and if it continues for another five it will last a Fibonacci 21 sessions and have a 0.618 Fibonacci ratio to the duration of minuette wave (ii).
The large maroon – – – channel is copied over from the weekly chart. It is drawn in exactly the same way on bull and bear wave counts. For the bull wave count this channel is termed a base channel about primary waves 1 and 2. A lower degree second wave should not breach the lower edge of a base channel drawn about a first and second wave one or more degrees higher. The lower maroon – – – trend line differentiates the bull and bear wave counts at cycle degree and monthly chart level.
Main Hourly Wave Count.
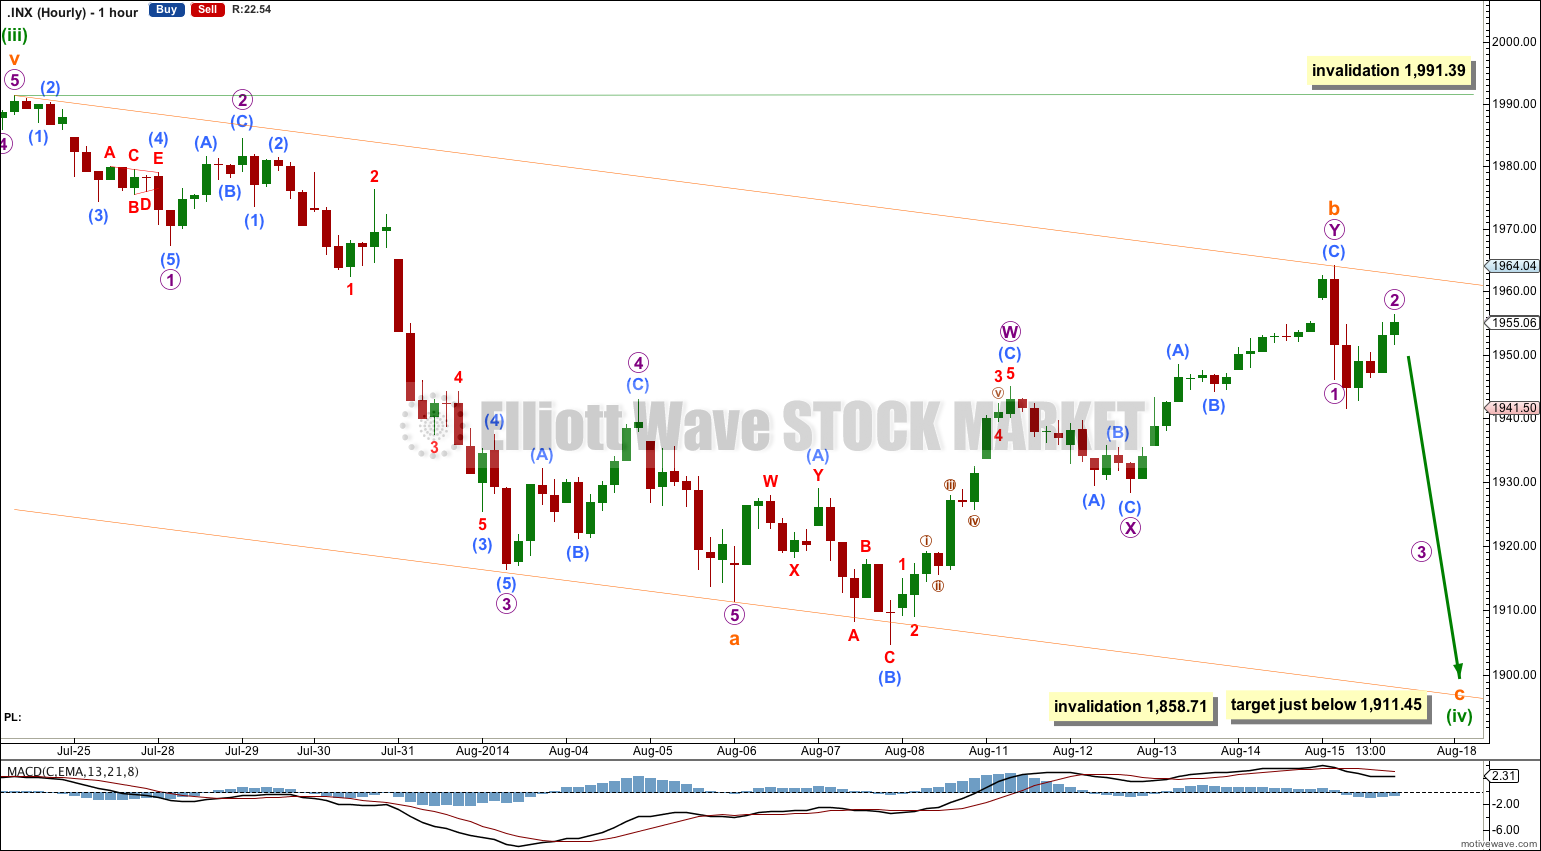
For reasons explained on the alternate hourly chart below this main wave count still has a higher probability, despite subminuette wave b moving higher than expected from yesterday’s analysis.
Subminuette wave a fits perfectly as a five wave impulse. Subminuette wave b may be a complete double combination (flat – X – zigzag) or the second structure of micro wave Y may be an incomplete flat or triangle. In that scenario we could see another day or two of sideways movement before subminuette wave c begins.
If subminuette wave b is over as a double combination then it has an atypical look. The second structure in the double deepens the correction, when normally the second structure only moves sideways. However, combinations for the S&P 500 do not always have the most typical look (see the example of minuette wave (ii) on the daily chart where the second structure moves comfortably below the end of the first).
Subminuette wave c may not exhibit a Fibonacci ratio to subminuette wave a; a 0.618 ratio would see it truncated (unlikely) and equality would see it breach the upper aqua blue trend line on the daily chart (also unlikely). Subminuette wave c is very likely to move at least slightly below the end of subminuette wave a at 1,911.45 to avoid a truncation. The upper aqua blue trend line on the daily chart would be the most likely point for this wave to end.
Because subminuette wave a subdivides as a five wave impulse minuette wave (iv) is a zigzag. Within the zigzag subminuette wave b may not move beyond the start of subminuette wave a above 1,991.39.
Alternate Hourly Wave Count.
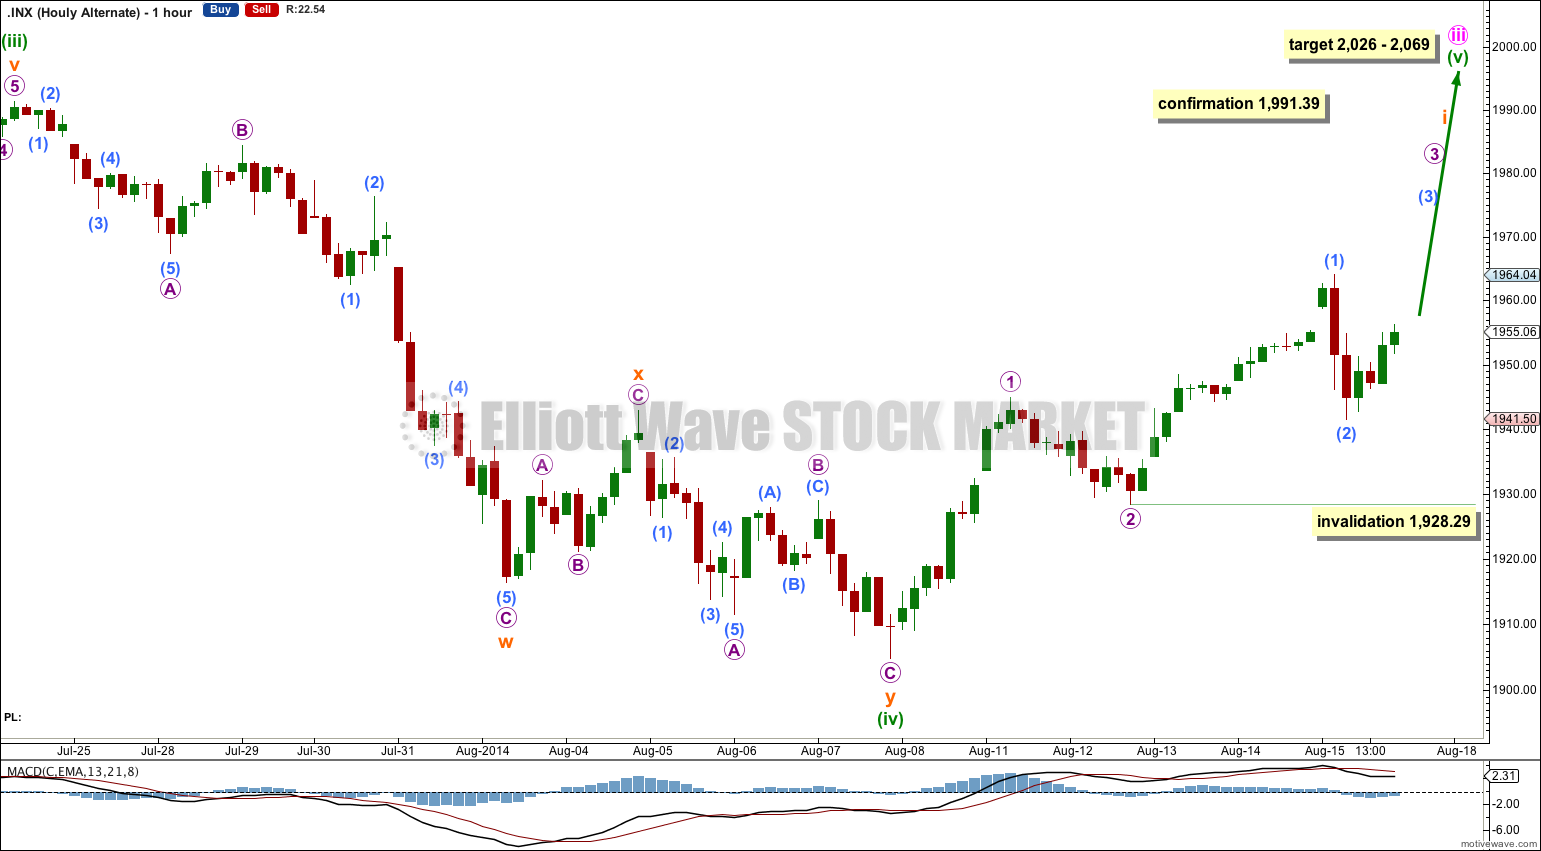
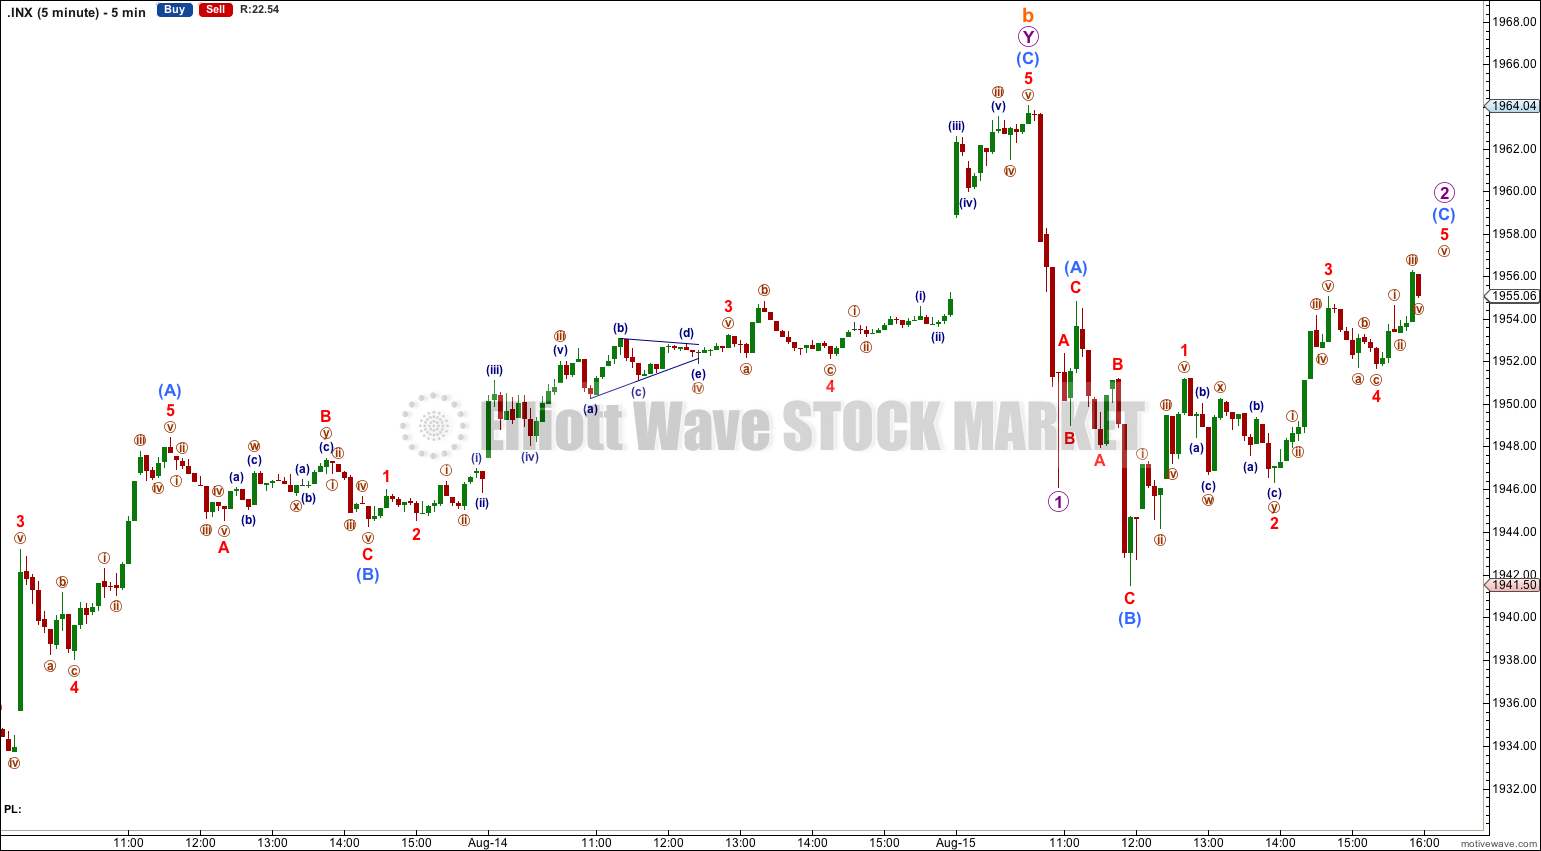
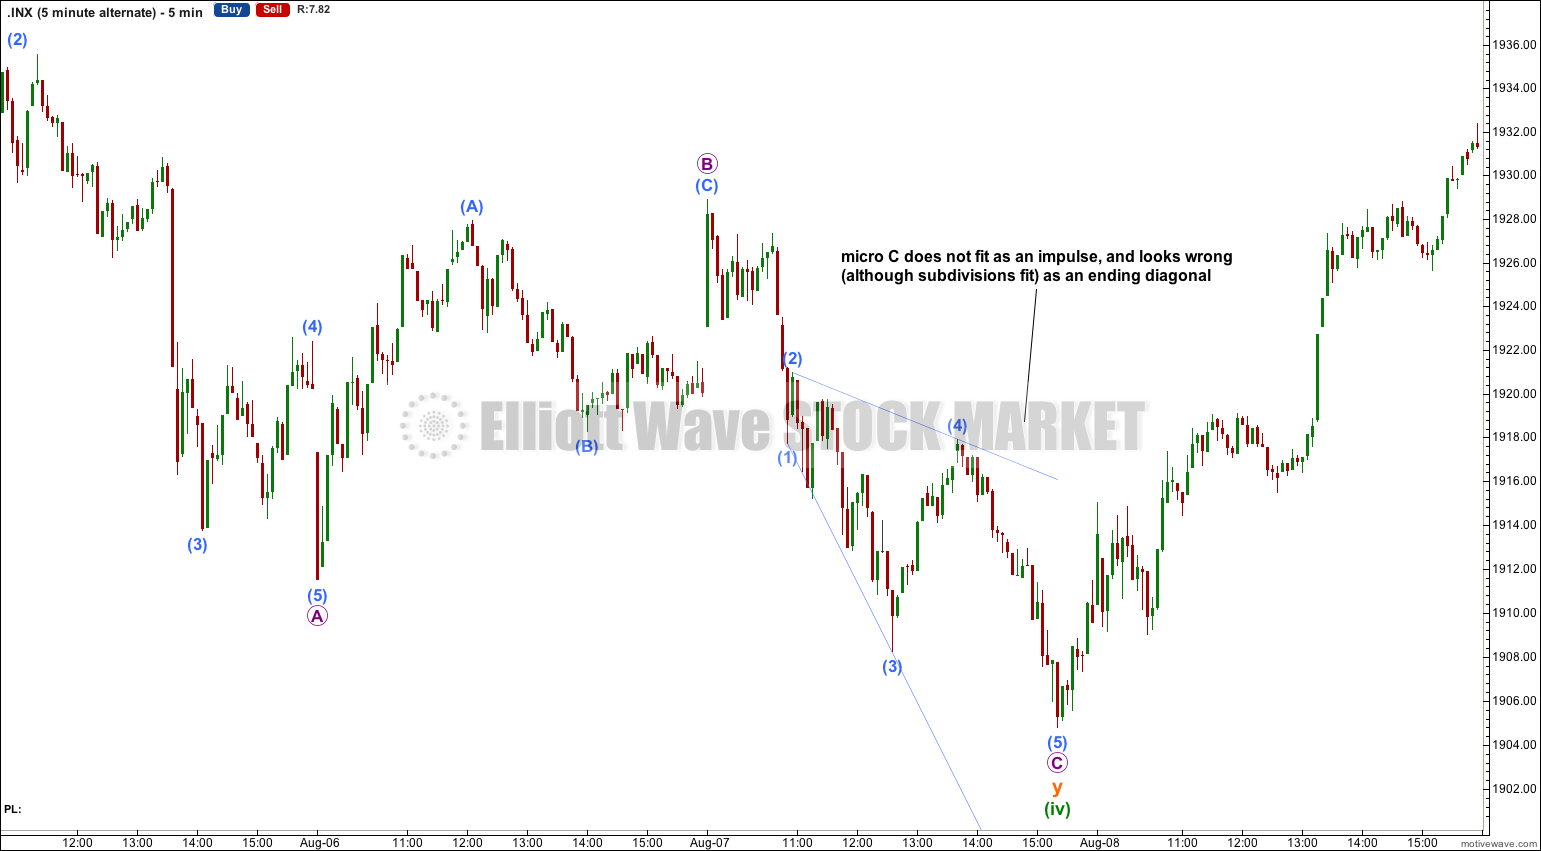
Could minuette wave (iv) be over? If it is then it would fit best as a double zigzag. The problem with this wave count, and it is highly significant, is the structure of the final wave of micro wave C within subminuette wave y. This downwards movement does not fit at all as a five wave structure (either impulse or ending diagonal) on the five minute chart and the hourly chart. It fits very well indeed as a three.
Any wave count which sees minuette wave (iv) as over has to see that last wave down as a five. This has a very low probability, maybe as low as 5%. I attach the 5 minute chart for this piece of movement so you may judge for yourselves.
I will certainly allow for the possibility that I could be wrong, that this fourth wave correction is actually over and my analysis of it is incorrect. This alternate would be confirmed with movement above 1,991.39.
At 2,026 minuette wave (v) would reach equality in length with minuette wave (i). At 2,069 minute wave iii would reach 1.618 the length of minute wave i. This gives a rather wide target zone though and may be narrowed towards the end when the target can be calculated at subminuette wave degree as well.
Within micro wave 3 no second wave correction may move beyond the start of its first wave below 1,928.29.
Bearish Alternate Wave Count
This bearish alternate wave count expects that the correction is not over. The flat correction which ended at 666.79 was only cycle wave a (or w) of a larger super cycle second wave correction.
The structure and subdivisions within primary wave C for the bear wave count are the same as for intermediate wave (1) for the bull wave count. Thus the short to mid term outlook is identical.
The differentiation between the bull and bear wave count is the maroon – – – channel. The bull wave count should see price remain above the lower maroon – – – trend line. The bear wave count requires a clear breach of this trend line. If this trend line is breached by a full weekly candlestick below it and not touching it then this bear wave count would be my main wave count and I would then calculate downwards targets.
We should always assume the trend remains the same until proven otherwise; the trend is your friend. While price remains above the lower maroon – – – trend line I will assume that the S&P 500 remains within a bull market.
This analysis is published about 02:33 a.m. EST.
With a gap up over massive resistance this AM, the DOW looks right to me! However, the short term count on the 5 min chart for each is interesting. I would’ve bet on more downwards movement first so not sure how to count it now.
We will know tomorrow I think.
The alternate wave count would be proven correct if price breaks above 1,991.39.
Dow theory would also see the upwards trend confirmed above that point.
Thx Lara-
I know you are a master of counting waves and focus on that the most. However, you are a CMT level 1 as well. Is there anything you are seeing in the technicals to suggest the alternate is correct? Momentum has stayed overbought through this b wave and reached extremely overbought yesterday. Isn’t this usually indicative of an uptrend and not a b wave? I would appreciate your input setting aside the waves. I completely agree A looks like a textbook 5 waves down. However, I remember last year or late 2012 we got burned thinking the same thing.
TBH I think my Dow count is wrong.
The S&P has better EW structures, they’re clearer and more normal looking, than the Dow.
We can look at volume to see which direction the breakout is most likely to be. Within the last 15 to 20 days highest volume is on down days, indicating more downwards movement. I think that higher volume for 15th Aug and 31st July is significant.
Price is moving higher but momentum is not increasing as much.
However, there is negative divergence between MACD and price on the daily chart; from the low of minuette wave (ii) to the low of subminuette wave a within minuette wave (iv) price is higher but MACD is lower. This would indicate more upwards movement.
The situation is not clear. Yet.