
A slight new high above 1,944.90 invalidated the main hourly Elliott wave count and confirmed the alternate hourly wave count. The alternate Elliott wave count expected not much more upwards movement, only sideways movement, which is what happened.
Summary: This B wave is incomplete. Price should move slightly higher tomorrow to a short term target at 1,952. I do not expect to see significant upwards movement and expect only sideways movement for maybe one more day. After that I expect overall downwards movement to end when price touches the upper aqua blue trend line on the daily chart. This trend line may be touched in seven days time.
Click on charts to enlarge.
The aqua blue trend lines are critical. Draw the first trend line from the low of 1,158.66 on 25th November, 2011 to the next swing low at 1,266.74 on 4th June, 2012. Create a parallel copy and place it on the low at 1,560.33 on 24th June, 2013. While price remains above the lower of these two aqua blue trend lines we must assume the trend remains upwards. This is the main reason for the bullish wave count being my main wave count.
Bullish Wave Count.
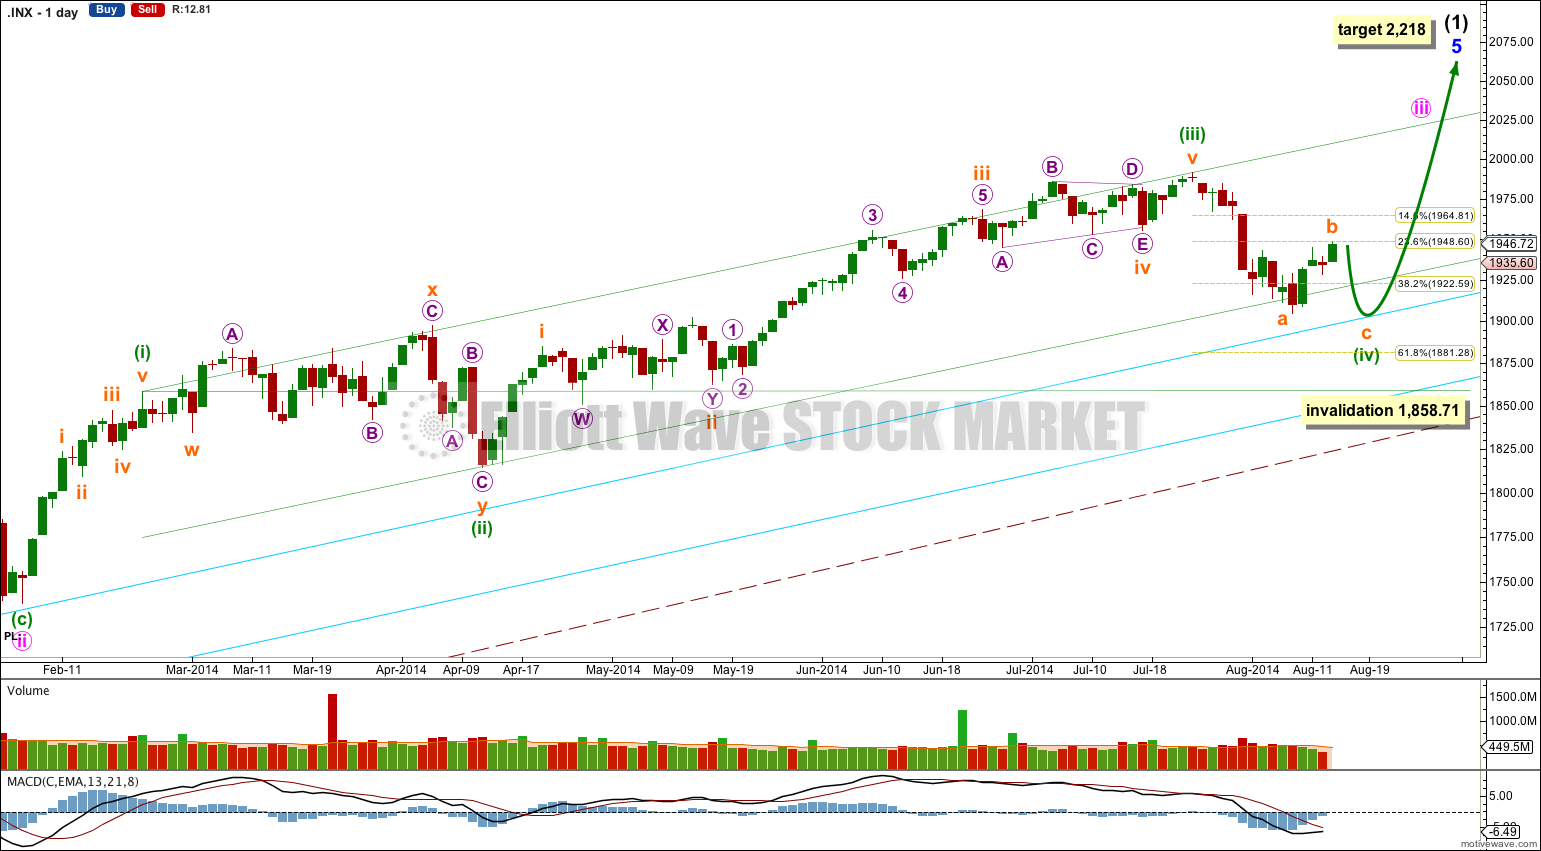
There are a couple of things about this wave count of which I am confident. I see minor wave 3 within intermediate wave (1) as over at 1,729.86 (19th September, 2013). It has the strongest upwards momentum and is just 0.76 longer than 2.618 the length of minor wave 1. At 455 days duration this is a remarkably close Fibonacci ratio. The subdivisions within it are perfect. If this is correct then minor wave 4 ends at 1,646.47 and this is where minor wave 5 begins.
Minor wave 5 is unfolding as an impulse. If minor wave 5 has passed its middle then I would expect to see more divergence between price and MACD develop over coming weeks.
Along the way up towards the final target I would expect to see two more corrections complete: the current correction for minuette wave (iv) and one more for minute wave iv.
Minuette wave (iv) may not move into minuette wave (i) price territory below 1,858.71.
At 2,218 minor wave 5 would reach equality in length with minor wave 3. This target may be met in October.
I have drawn a parallel channel about minute wave iii using Elliott’s first technique: draw the first trend line from the highs of minuette waves (i) to (iii), then place a parallel copy on the low of minuette wave (ii). Minuette wave (iv) so far slightly breaches the lower edge of this channel, and at its end I expect another small breach. This may indicate an overthrow of the channel on the opposite side for the upcoming fifth wave.
Minuette wave (iv) may reach as low as the 0.618 Fibonacci ratio of minuette wave (iii) at 1,881.28, which would provide alternation in depth of correction between minuette waves (ii) and (iv), (minuette wave (ii) was a shallow 37% correction). Downwards movement may find final support about the upper aqua blue trend line, continuing a pattern which has lasted about a year now. If the upper aqua blue trend line is overshot by downwards movement then I would expect price to find support at the lower aqua blue trend line, although it may not get that low.
Minuette wave (ii) lasted exactly a Fibonacci 34 sessions. So far minuette wave (iv) has lasted 14 sessions, and if it continues for another seven it will last a Fibonacci 21 sessions and have a 0.618 Fibonacci ratio to the duration of minuette wave (ii).
The large maroon – – – channel is copied over from the weekly chart. It is drawn in exactly the same way on bull and bear wave counts. For the bull wave count this channel is termed a base channel about primary waves 1 and 2. A lower degree second wave should not breach the lower edge of a base channel drawn about a first and second wave one or more degrees higher. The lower maroon – – – trend line differentiates the bull and bear wave counts at cycle degree and monthly chart level.
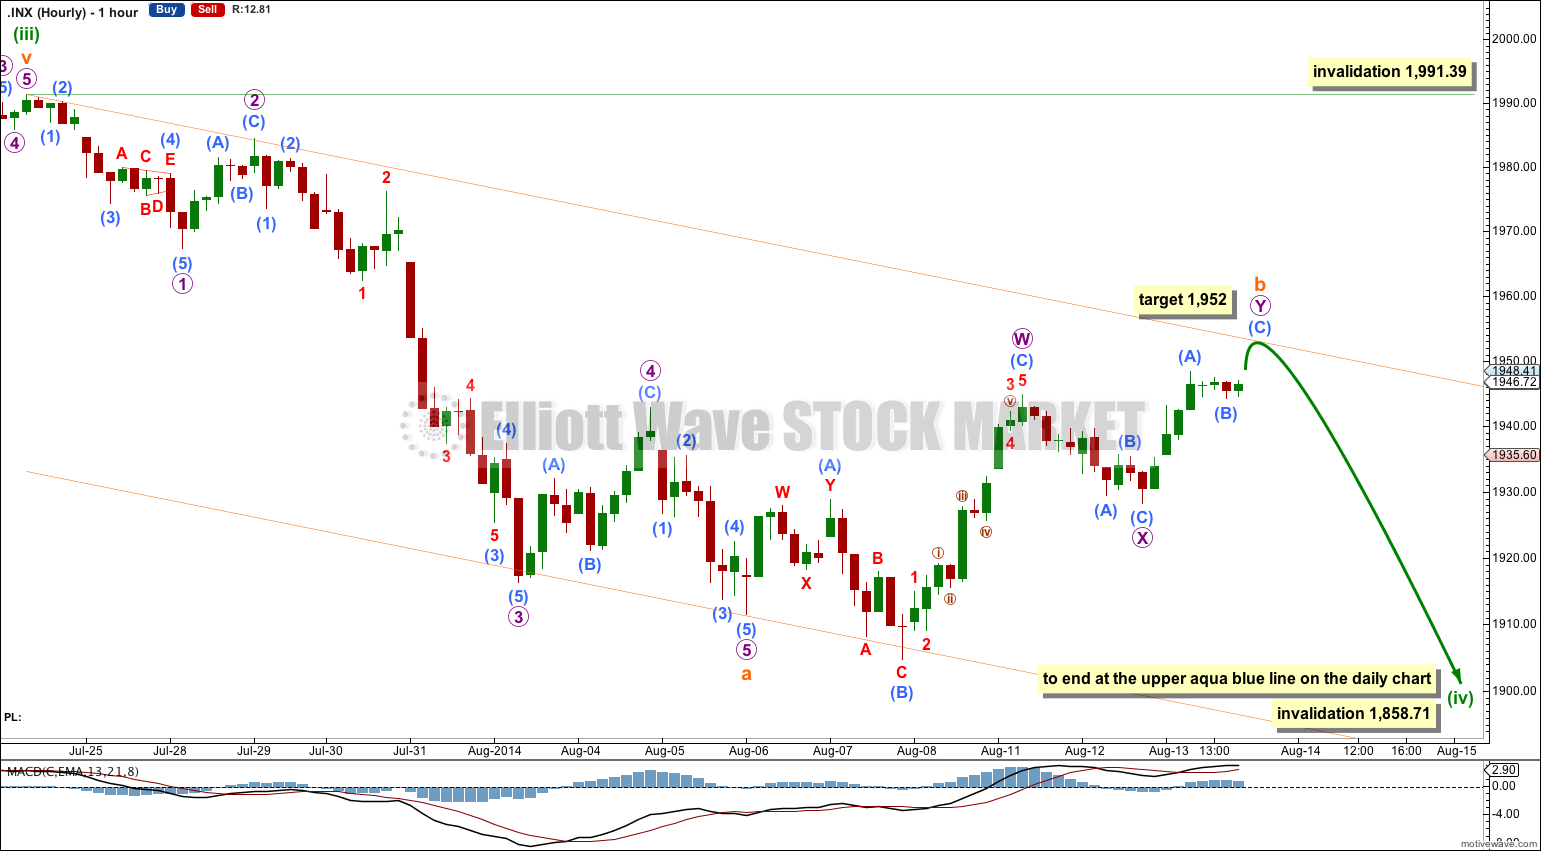
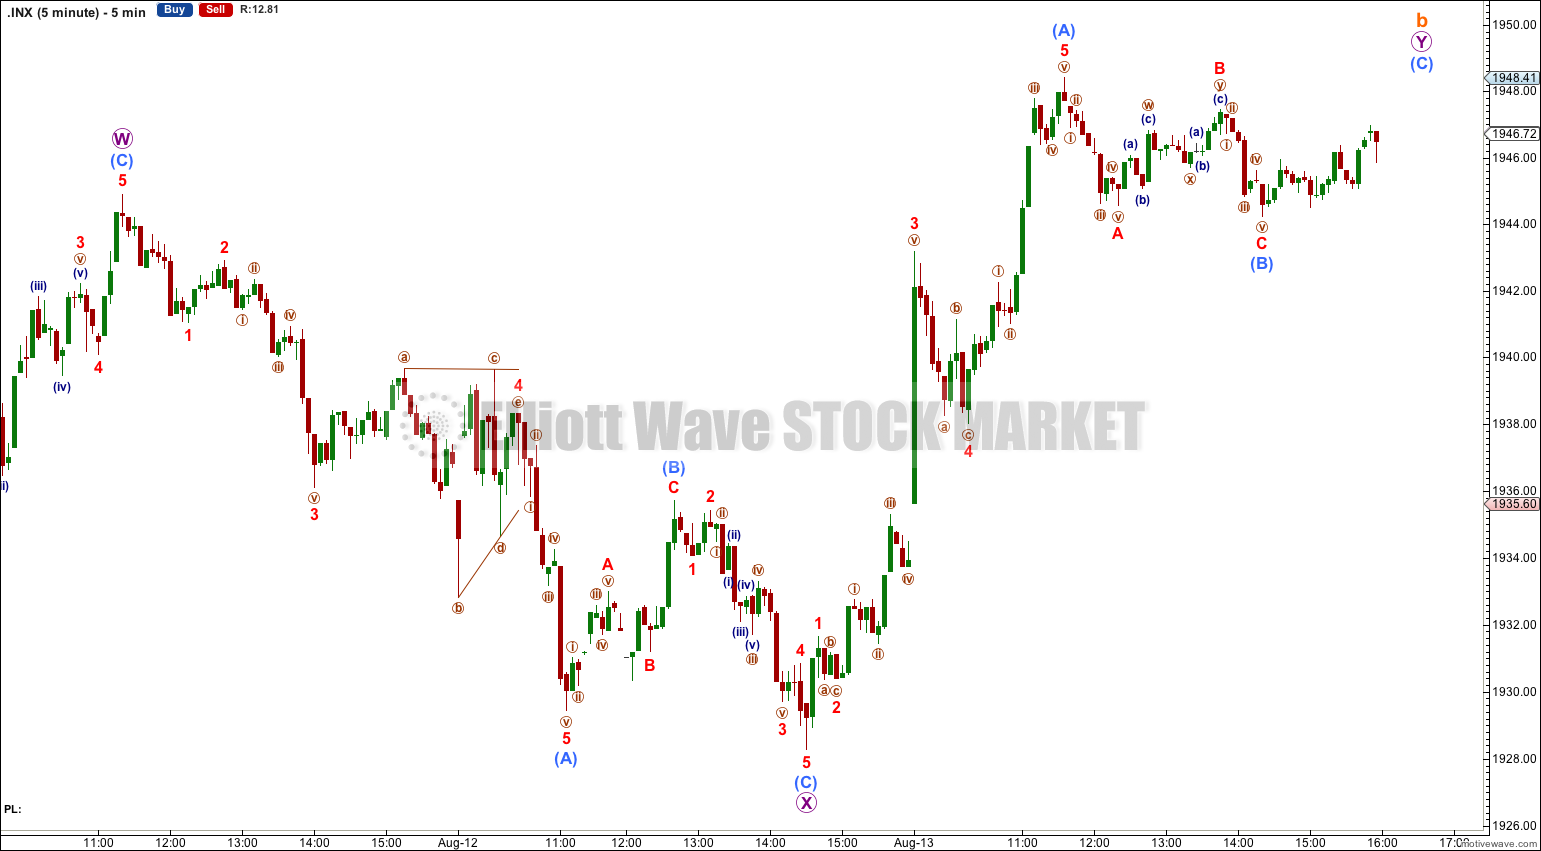
Subminuette wave b has continued slightly higher. It subdivides as a double combination: flat correction – X – zigzag. The second structure within the combination, the zigzag of micro wave Y, is incomplete. At 1,952 submicro wave (C) would reach 0.382 the length of submicro wave (A).
Double combinations have the purpose of taking up time and moving price sideways. This may allow for minuette wave (iv) to be longer lasting in total, maybe to reach a Fibonacci 21 days and exhibit a Fibonacci ratio to the duration of minuette wave (ii).
Double combinations move price sideways so I am not expecting significant upwards movement for subminuette wave b, which should mostly move price sideways.
Because subminuette wave a subdivides as a five wave impulse minuette wave (iv) is a zigzag. Within the zigzag subminuette wave b may not move beyond the start of subminuette wave a above 1,991.39.
Bearish Alternate Wave Count
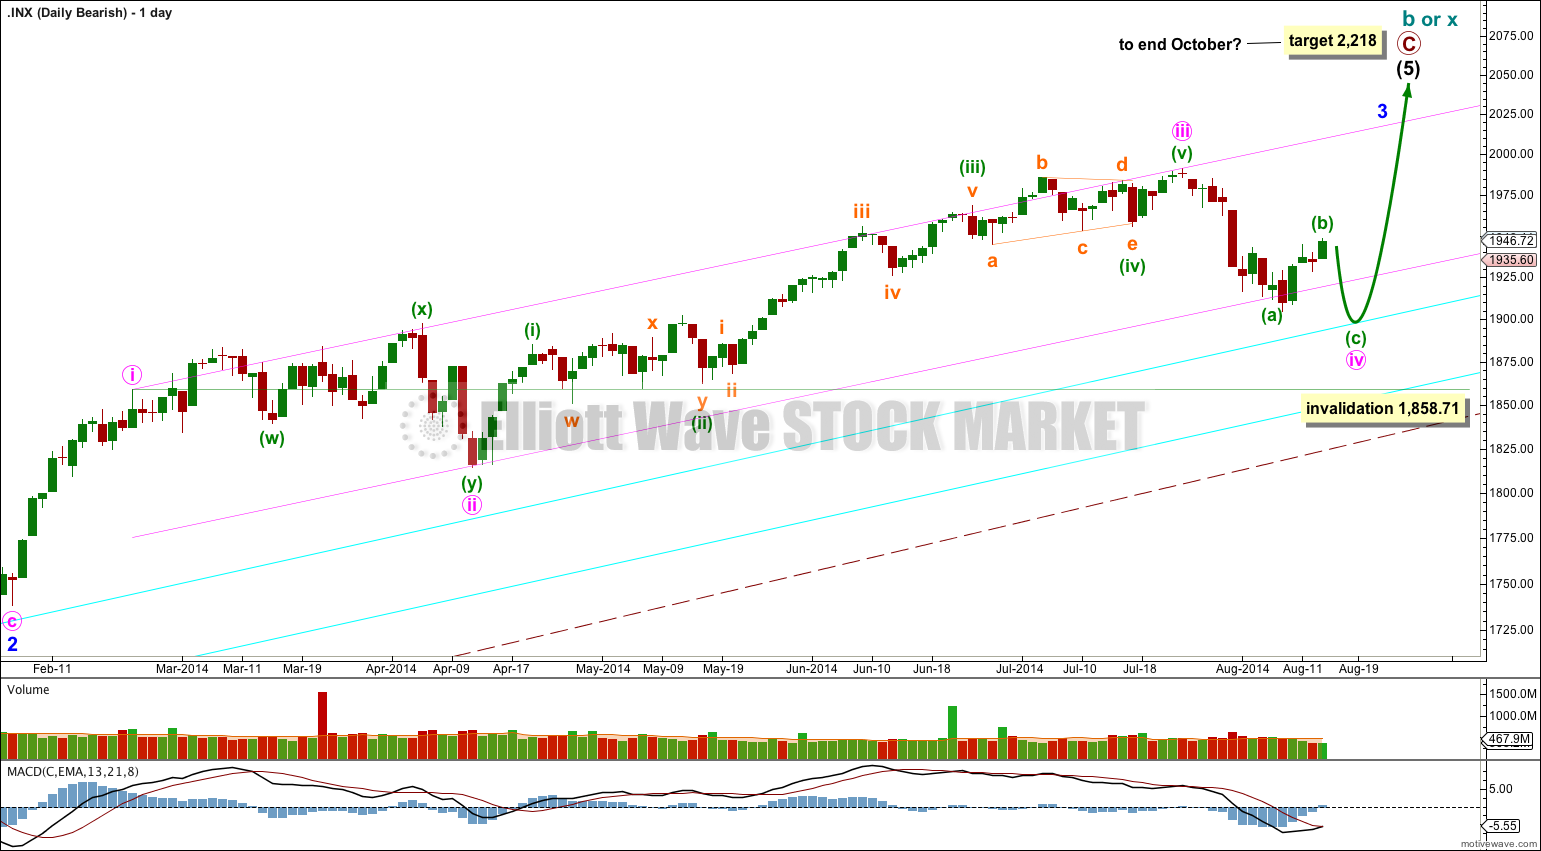
This bearish alternate wave count expects that the correction is not over. The flat correction which ended at 666.79 was only cycle wave a (or w) of a larger super cycle second wave correction.
The structure and subdivisions within primary wave C for the bear wave count are the same as for intermediate wave (1) for the bull wave count. Thus the short to mid term outlook is identical.
The differentiation between the bull and bear wave count is the maroon – – – channel. The bull wave count should see price remain above the lower maroon – – – trend line. The bear wave count requires a clear breach of this trend line. If this trend line is breached by a full weekly candlestick below it and not touching it then this bear wave count would be my main wave count and I would then calculate downwards targets.
We should always assume the trend remains the same until proven otherwise; the trend is your friend. While price remains above the lower maroon – – – trend line I will assume that the S&P 500 remains within a bull market.
This analysis is published about 06:52 p.m. EST.
Dear Lara,
At this point, it is fair to assume that the corrective wave iv is over and that we are in early stages of wave v upwards. Please present an alternate that assumes that wave iv was only 9 days, and where wave (a) was only a 3-wave structure lasting only 7 days, and then subsequent waves (b) and (c) lasted only 1 day each.
Thank you!
“Please present an alternate that assumes wave iv was only 9 days”
No. Thats not how it works.
I have looked for it. I have concluded the subdivisions quite simply do not fit.
I cannot develop and publish a wave count which tells you want you want to see, if that is not how the EW structures fit. I will not publish anything which breaks EW rules.
The other possibility is that minuette wave (iv) is over and has fives that look strongly like threes on the hourly chart, in short, my analysis is wrong. We will know my analysis is wrong if the wave count is invalidated with movement above 1,991.39.
Okay, I’ll publish such a wave count today.
But it does not have a good fit.
It has to see a clear three as a five.
Maybe I’m wrong (its certainly happened before) but I would judge this idea to have a low probability, maybe as low as 5%. I’ll publish it and point out whats right and wrong with it, and you can then judge for yourself.
The reason I brought this up is because I see clearly an inverted head and shoulders pattern, with head located at the 1904 low and with a slightly inclined neckline near 1944. We broke the neckline yesterday with the move above 1944.9. That puts the upside target to 1984, at least. I know TA better than EW analysis, which is why I asked for an alternative hourly wave count. The move from yesterday above 1944.9 had a 10% probability, so I would consider seriously your new alternative wave count with 5% probability. I guess, that is how the market works nowadays – it choses the least probable route just to keep investors surprised/confused.
Thank you, I greatly appreciate your hard work!
Yeah, I see that H&S too.
The difference between traditional TA structures and EW structures is in the detail; the rules of EW are much more black and white, much clearer, than traditional TA.
That structure certainly fits for a reversal in traditional TA, but not for EW. When they align we have higher probability. When they don’t we have uncertainty.
At least, thats how I look at it. That seems logical.