
The correction may now be complete. The target for the next wave up remains the same.
Summary: I expect upwards movement from here towards 2,010. This may be met in another 23 trading days.
Click on charts to enlarge.
The aqua blue trend lines are critical. Draw the first trend line from the low of 1,158.66 on 25th November, 2011 to the next swing low at 1,266.74 on 4th June, 2012. Create a parallel copy and place it on the low at 1,560.33 on 24th June, 2013. While price remains above the lower of these two aqua blue trend lines we must assume the trend remains upwards. This is the main reason for the bullish wave count being my main wave count.
Bullish Wave Count.
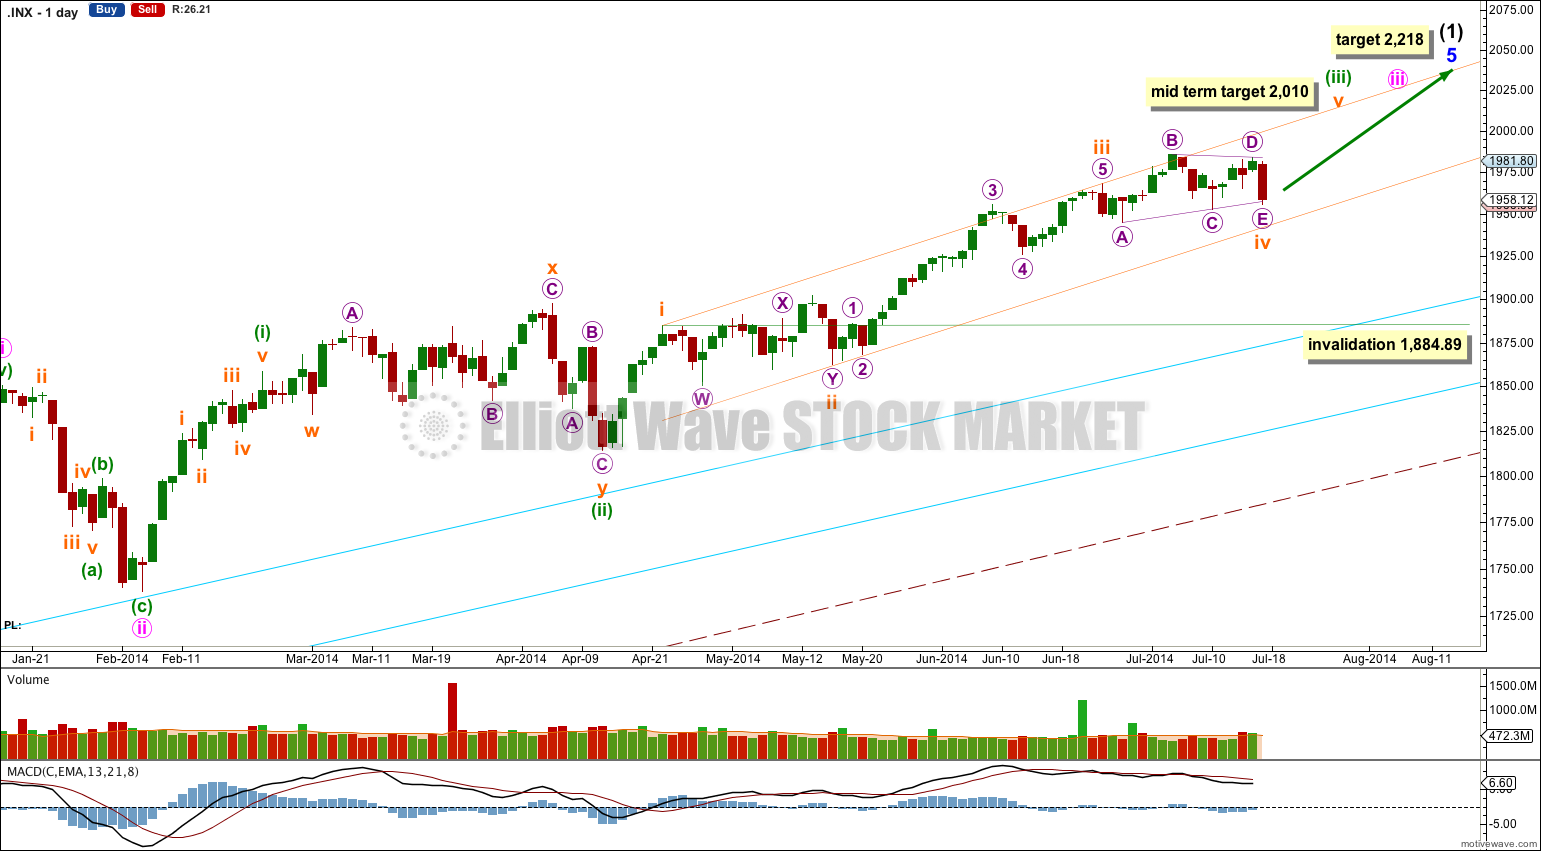
There are a couple of things about this wave count of which I am confident. I see minor wave 3 within intermediate wave (1) as over at 1,729.86 (19th September, 2013). It has the strongest upwards momentum and is just 0.76 longer than 2.618 the length of minor wave 1. At 455 days duration this is a remarkably close Fibonacci ratio. The subdivisions within it are perfect. If this is correct then minor wave 4 ends at 1,646.47 and this is where minor wave 5 begins.
Minor wave 5 may be only one of two structures: a simple impulse or an ending diagonal. At this stage an ending diagonal looks less likely, and most recent upwards movement is looking like a third wave so a more common impulse is more likely. If minor wave 5 has passed its middle then I would expect to see more divergence between price and MACD develop over coming weeks.
Along the way up towards the final target I would expect to see two more corrections complete: the next for minuette wave (iv) and the last for minute wave iv.
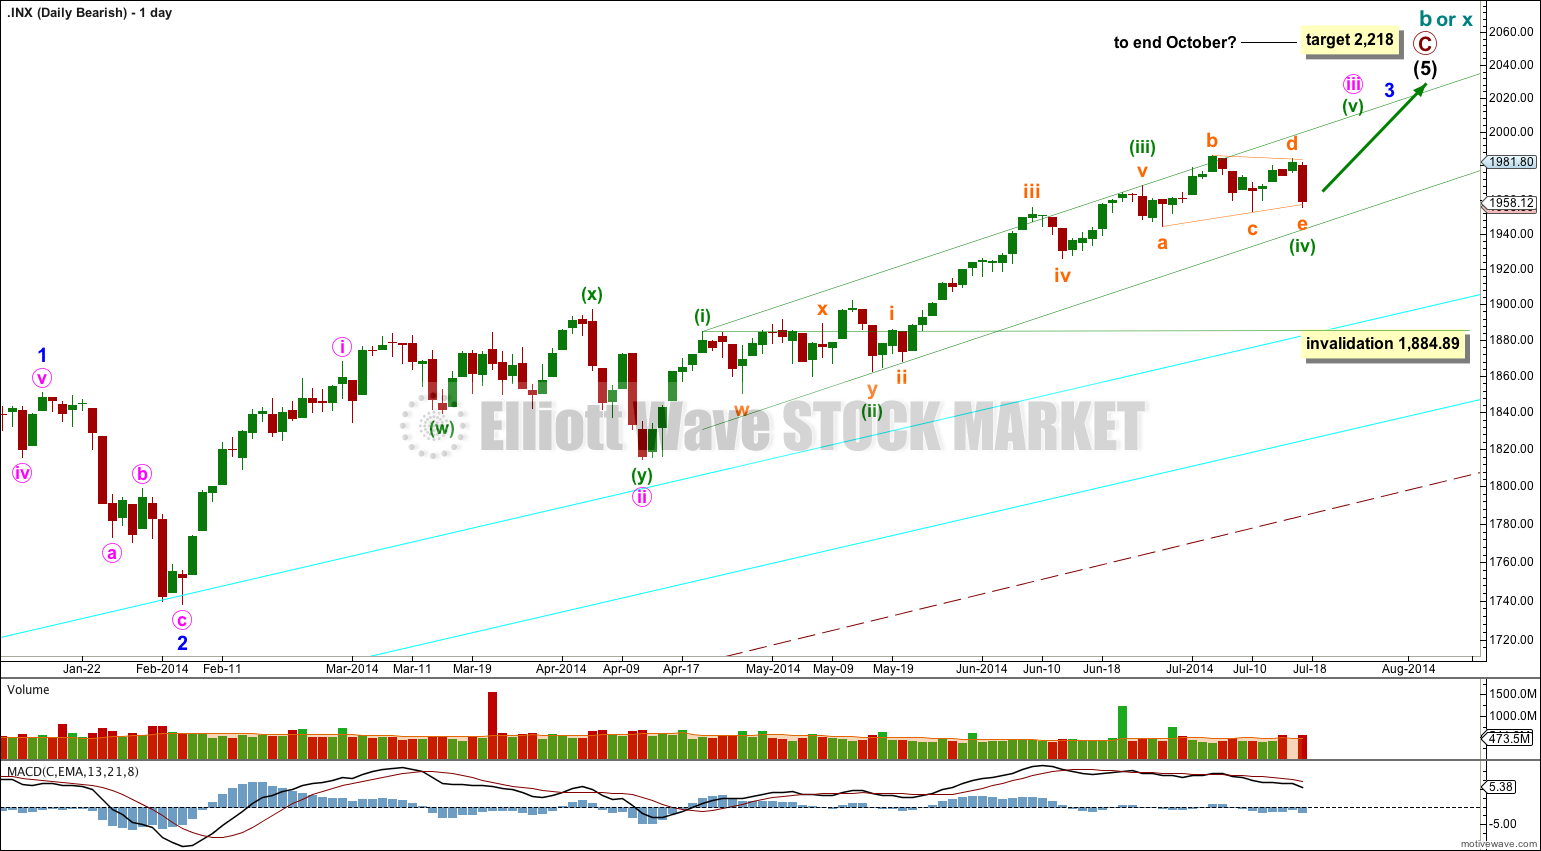
At this stage today I expect now that subminuette wave iv is complete. Once this is confirmed with a new high above 1,983.94 I will move the invalidation point on the daily chart up to the beginning of subminuette wave v. While the end of subminuette wave iv is unconfirmed it may continue, and it may not move into subminuette wave i price territory below 1,884.89.
At 2,010 minuette wave (iii) would reach 1.618 the length of minuette wave (i). Within minuette wave (iii) subminuette wave iii is 8.31 points short of 1.618 the length of subminuette wave i, and so I would not expect to see a Fibonacci ratio for subminuettte wave v. I will leave the target calculation at minuette wave degree.
At 2,218 minor wave 5 would reach equality in length with minor wave 3. This target may be met in October.
I have drawn a parallel channel about minuette wave (iii) using Elliott’s first technique: draw the first trend line from the highs of subminuette waves i to iii, then place a parallel copy on the low of subminuette wave ii. Subminuette wave iv may have remained mostly contained within the channel. Subminuette wave v may end about the upper edge of this channel.
Minuette wave (i) lasted 12 days, just one short of a Fibonacci 13. Minuette wave (ii) lasted a Fibonacci 34 days. Minuette wave (iii) so far has lasted 66 days. The next Fibonacci relationship could see it end in a total 89 days, which now is in 23 days time. This would also see minuette waves (i), (ii) and (iii) exhibit Fibonacci ratios to each other, as those ratios are derived by the relationship between Fibonacci numbers.
The large maroon – – – channel is copied over from the weekly chart. It is drawn in exactly the same way on bull and bear wave counts. For the bull wave count this channel is termed a base channel about primary waves 1 and 2. A lower degree second wave should not breach the lower edge of a base channel drawn about a first and second wave one or more degrees higher. The lower maroon – – – trend line differentiates the bull and bear wave counts at cycle degree and monthly chart level.
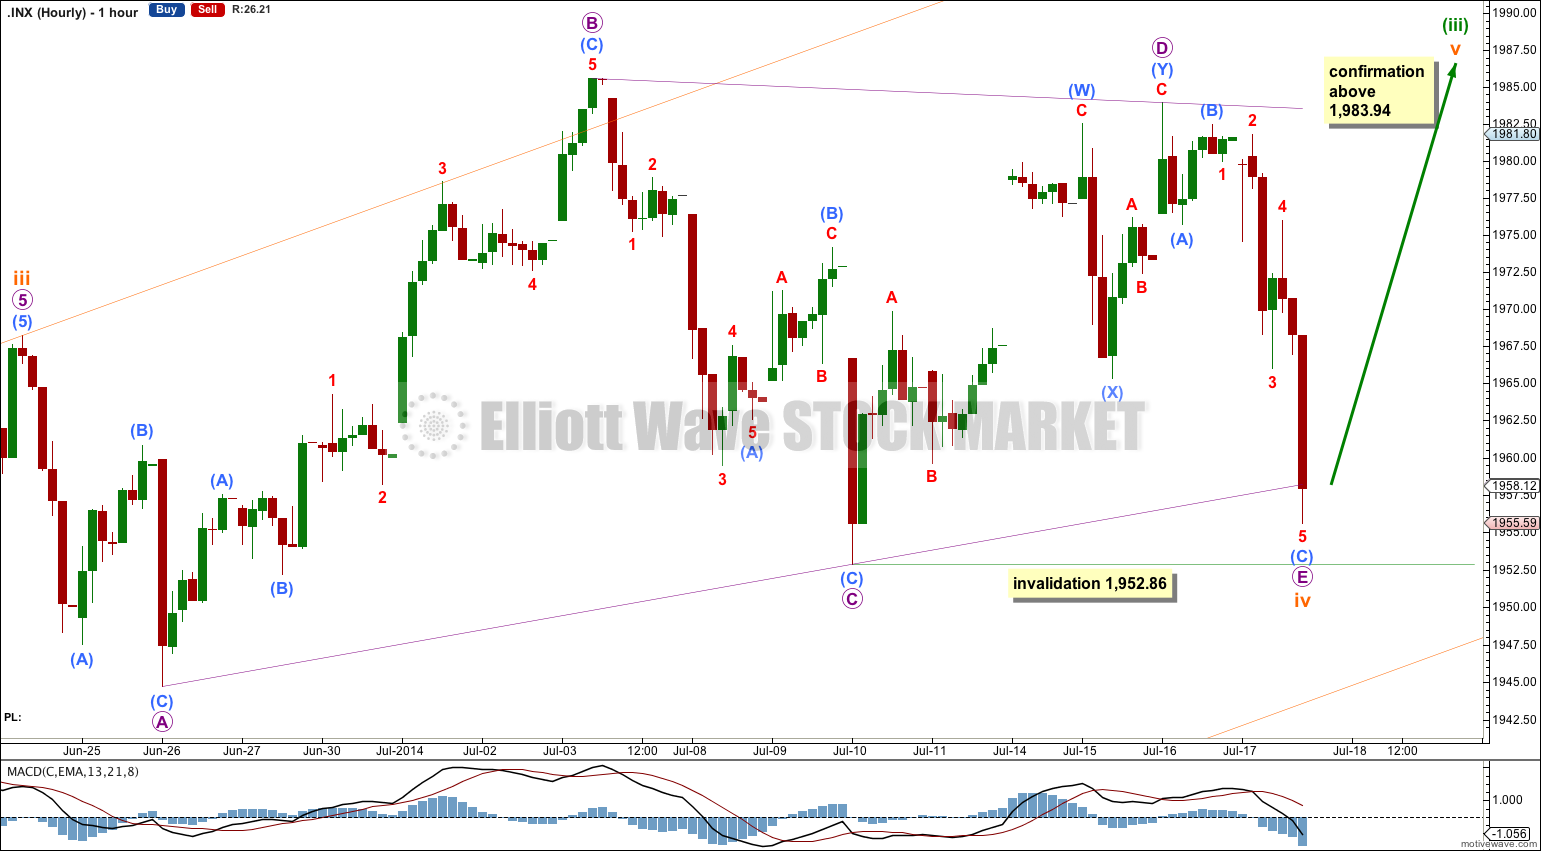
At the hourly chart level subminuette wave iv now subdivides nicely as a running contracting triangle (the B-D trend line is sloped and not flat enough to term this a barrier triangle).
Tomorrow micro wave E may move very slightly lower at the start of the session. It may not move beyond the end of micro wave C at 1,952.86 for the triangle to remain valid.
Micro wave E slightly overshoots the A-C trend line which is the second common place for E waves of triangles to end.
If this analysis is correct then we should see a fifth wave begin upwards tomorrow. This would be confirmed with movement above 1,983.94.
This main wave count has a higher probability because it has a great fit and sees subminuette wave iv at 16 days, almost perfectly in proportion to subminuette wave ii at 17 days. They show great alternation: subminuette wave ii was a shallow 32% combination and subminuette wave iv is a more shallow 12% triangle. The orange channel is showing nicely where price is finding support and resistance.
Alternate Hourly Wave Count
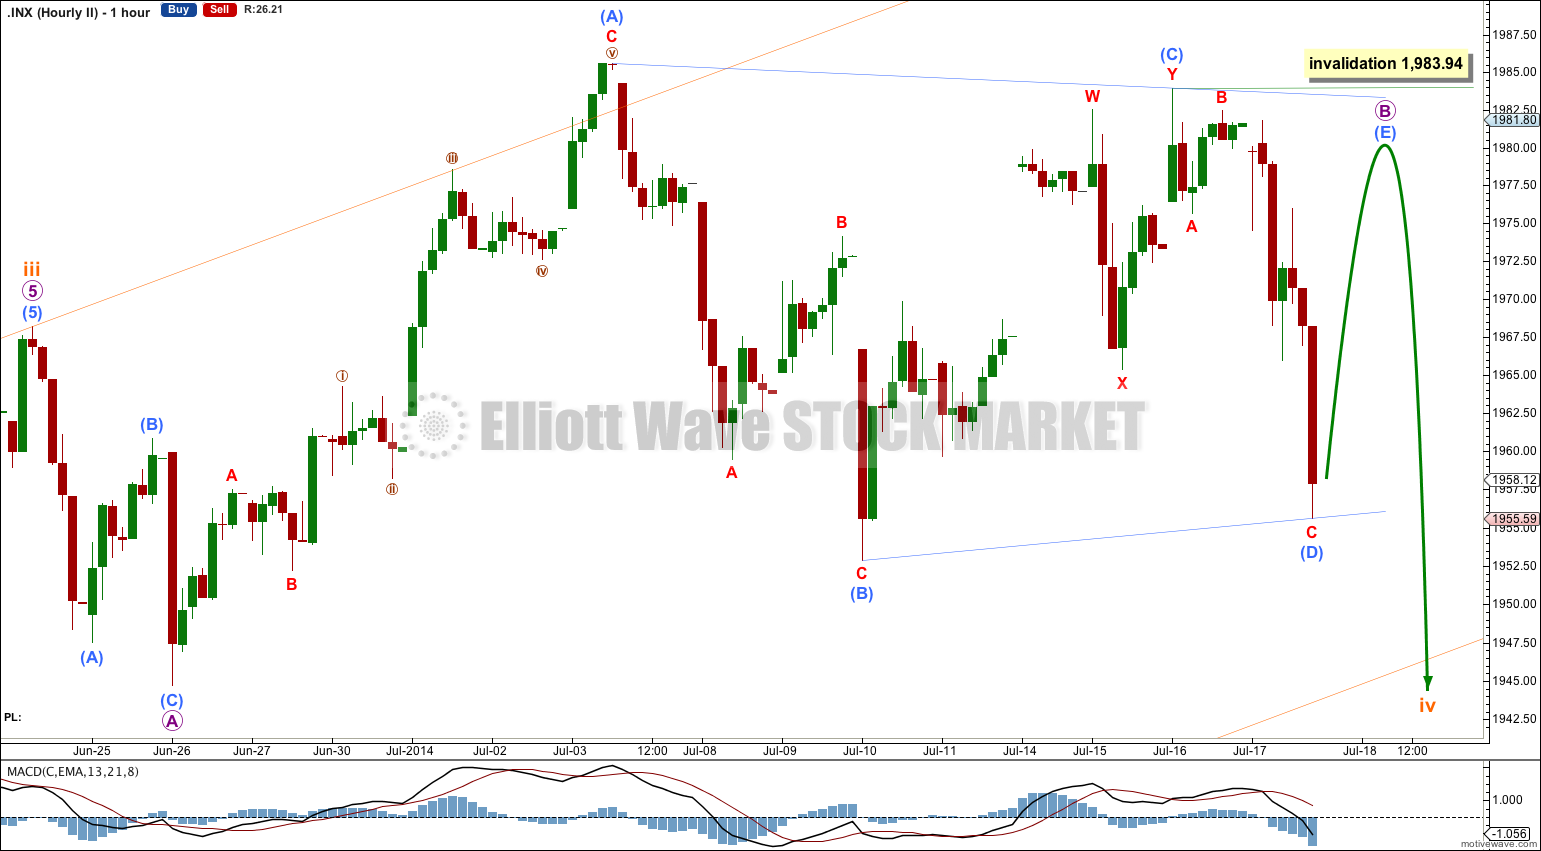
I have learned the hard way to not trust triangles on the S&P. Too many times I have labeled a movement as a complete or unfolding triangle only to have the wave count invalidated. I must consider all possibilities.
It may be that only micro wave B within subminuette wave iv is a triangle. Within micro wave B triangle submicro wave (E) may not move beyond the end of submicro wave (C) at 1,983.94.
This alternate sees another day or so of sideways movement, before a five wave movement downwards to complete subminuette wave iv. Subminuette wave iv may end when it slightly overshoots the lower edge of the orange channel copied over here from the daily chart.
At this stage this hourly wave count has a low probability because both the A-C and B-D trend lines of this possible triangle have a shallow slope. Triangle trend lines normally have a steeper slope than this.
Bearish Alternate Wave Count
This bearish alternate wave count expects that the correction is not over. The flat correction which ended at 666.79 was only cycle wave a (or w) of a larger super cycle second wave correction.
The structure and subdivisions within primary wave C for the bear wave count are the same as for intermediate wave (1) for the bull wave count. Thus the short to mid term outlook is identical.
The differentiation between the bull and bear wave count is the maroon – – – channel. The bull wave count should see price remain above the lower maroon – – – trend line. The bear wave count requires a clear breach of this trend line. If this trend line is breached by a full weekly candlestick below it and not touching it then this bear wave count would be my main wave count and I would then calculate downwards targets.
We should always assume the trend remains the same until proven otherwise; the trend is your friend. While price remains above the lower maroon – – – trend line I will assume that the S&P 500 remains within a bull market.
This analysis is published about 09:10 p.m. EST.
I disagree on all wave counts. Now that we are finally starting to go down with momentum and volume we are supposed to expect the market to go up form here because some Elliott Wave Count out of a 100 different ways it could be? Kuku.
Volume is supposed to be declining at the end of a triangle, not increasing. I bet this wave count gets invalidated in the next few days if not tomorrow. Traditional technical analysis suggest we are going lower. Hey, we just close below the 20 day moving average for the first time in about 2.5 months. That suggest we are either going to the 50 or the 100 day moving average if not lower.
I guess will find out the wave count after the fact, as always. I´m not getting caught up on this Elliott Wave paranoia. Common sense beats pattern confusion anytime.
I´m staying short, despite and against this Elliott Wave Count.
Cheers
I think to go down we need to break the trendline that Lara has drawn and preferably low from last week around 1952. There is always a chance of bounce.
Oh right, oh right. I cover.
I guess emotions get carried out sometimes, at least for me.
Still made a nice profit shorting the Russell 2,000 futures, TF, september contracts.
Lets see if this wave count turns to be right and I can get short again at a better price.
The S&P 500 recapture the 20 day MA, so that means I have to cover anyways. Staying in cash for now.
Good luck to you all
Let’s give credit where credit is due, looks like this could be right. You are getting killed being short.
Your tone here is unnecessarily rude.
Please read the comments policy.
If you wouldn’t talk to your grandmother like that, don’t do it here.
I insist on a polite and respectful tone in comments at all times. This is not youtube.