
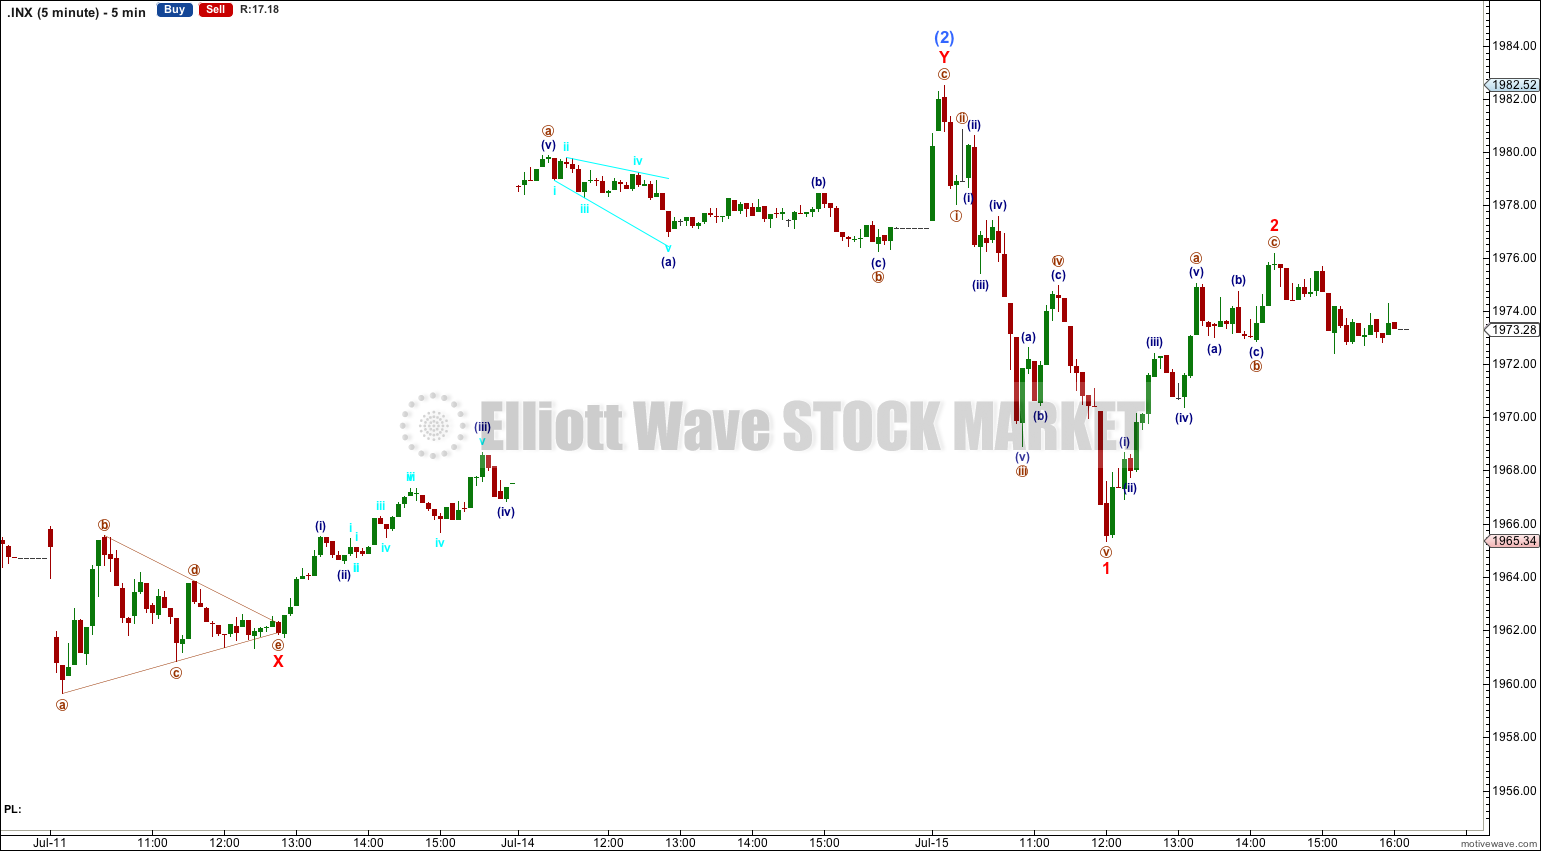
Downwards movement was expected. It subdivides as a five wave impulse on the five minute chart and so this fits the main wave count nicely.
Summary: My main wave count which has a higher probability expects downwards movement to begin to show an increase in downwards momentum over the next couple of days. The target at 1,924 may be met by the end of this week or early next week. If we see a new high above 1,985.59 this week then the alternate would be confirmed. At that stage the target for upwards movement to see a temporary interruption is 2,010.
Click on charts to enlarge.
The aqua blue trend lines are critical. Draw the first trend line from the low of 1,158.66 on 25th November, 2011 to the next swing low at 1,266.74 on 4th June, 2012. Create a parallel copy and place it on the low at 1,560.33 on 24th June, 2013. While price remains above the lower of these two aqua blue trend lines we must assume the trend remains upwards. This is the main reason for the bullish wave count being my main wave count.
Bullish Wave Count.
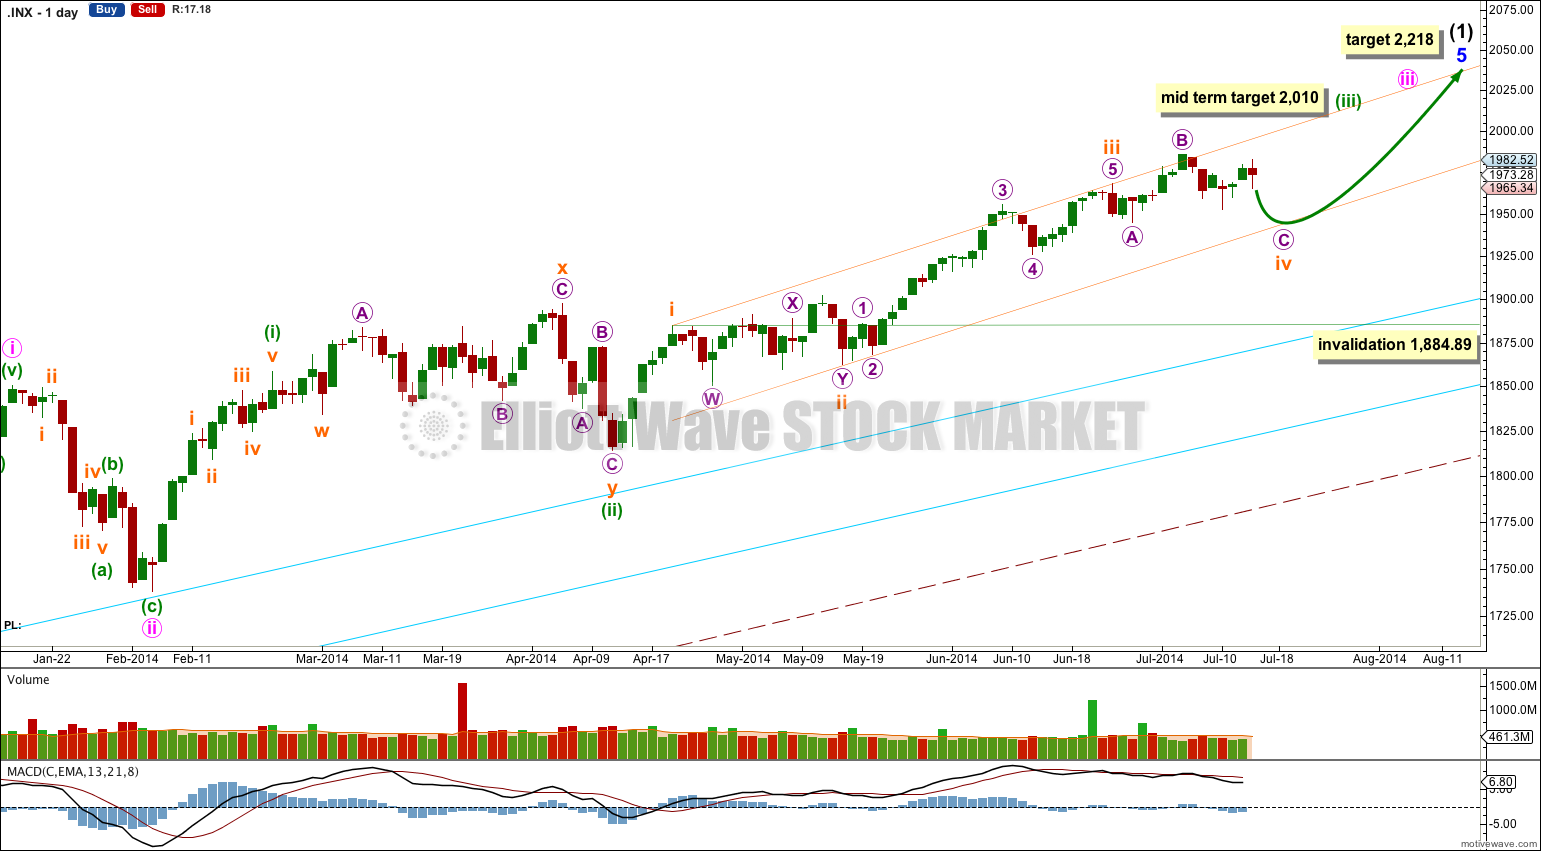
There are a couple of things about this wave count of which I am confident. I see minor wave 3 within intermediate wave (1) as over at 1,729.86 (19th September, 2013). It has the strongest upwards momentum and is just 0.76 longer than 2.618 the length of minor wave 1. At 455 days duration this is a remarkably close Fibonacci ratio. The subdivisions within it are perfect. If this is correct then minor wave 4 ends at 1,646.47 and this is where minor wave 5 begins.
Minor wave 5 may be only one of two structures: a simple impulse or an ending diagonal. At this stage an ending diagonal looks less likely, and most recent upwards movement is looking like a third wave so a more common impulse is more likely.
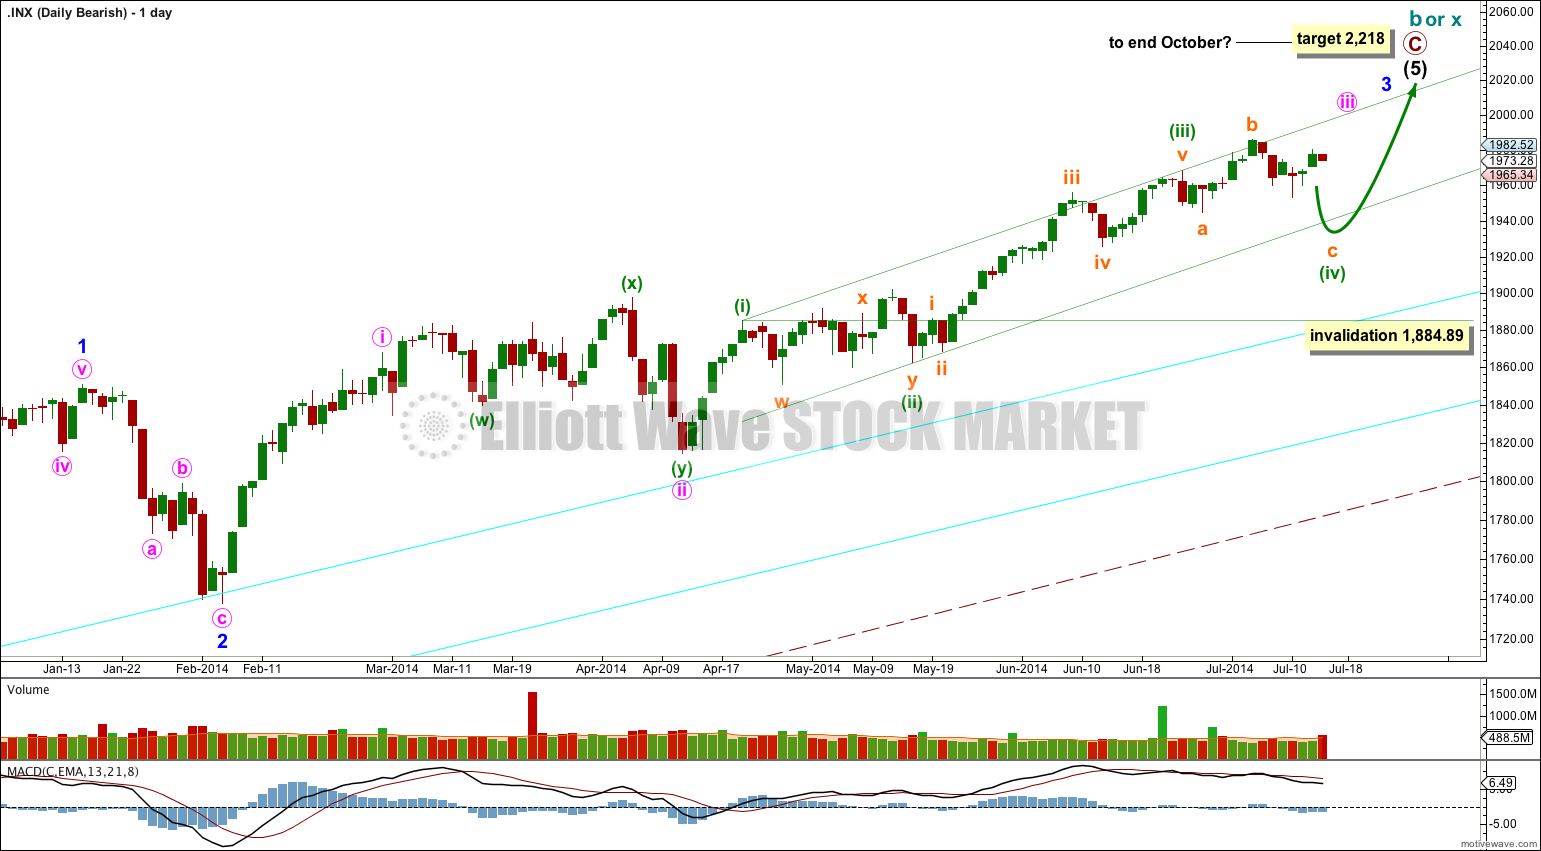
Along the way up towards the final target I would expect to see three more corrections complete. The first for subminuette wave iv is most likely to be somewhat in proportion to subminuette wave ii which lasted 17 days. So far subminuette wave iv has lasted 14 days and is very likely to continue.
Subminuette wave iv may not move into subminuette wave i price territory below 1,884.89.
At 2,010 minuette wave (iii) would reach 1.618 the length of minuette wave (i).
At 2,218 minor wave 5 would reach equality in length with minor wave 3. This target may be met in October.
I have drawn a parallel channel about minuette wave (iii) using Elliott’s first technique: draw the first trend line from the highs of subminuette waves i to iii, then place a parallel copy on the low of subminuette wave ii. The upper edge of this channel is slightly overshot, and this may indicate an overshoot on the opposite side may happen when subminuette wave iv ends.
There is still divergence with price trending higher and MACD trending lower on the weekly chart, and a little on the daily chart for most recent movement. This classic technical divergence indicates that a correction should unfold.
The large maroon – – – channel is copied over from the weekly chart. It is drawn in exactly the same way on bull and bear wave counts. For the bull wave count this channel is termed a base channel about primary waves 1 and 2. A lower degree second wave should not breach the lower edge of a base channel drawn about a first and second wave one or more degrees higher. The lower maroon – – – trend line differentiates the bull and bear wave counts at cycle degree and monthly chart level.
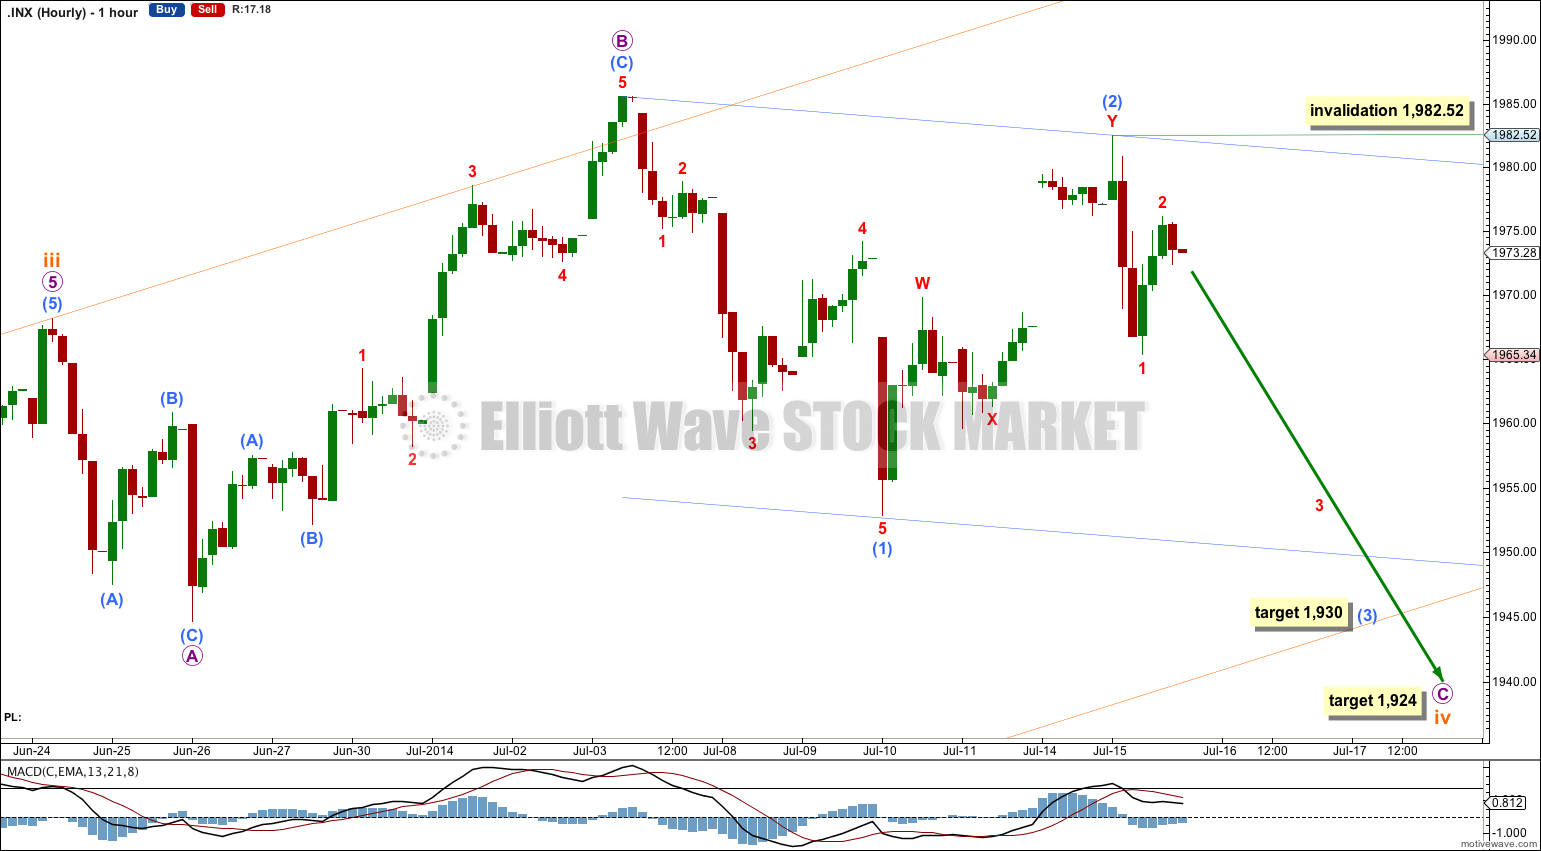
Subminuette wave iv may be unfolding as an expanded flat correction; micro wave B within it is a 174% correction of micro wave A. This is longer than the maximum common length of 138% but still entirely viable.
The overshoot of the upper edge of the channel may indicate an overshoot of the lower edge to come.
At 1,924 micro wave C would reach 2.618 the length of micro wave A. This could see subminuette wave iv slightly overshoot the channel at the lower edge.
Submicro wave (2) moved a little higher and is still a complete double zigzag. Within the double minuscule wave X subdivides as a triangle on the five minute chart.
On the five minute chart minuscule wave 1 now subdivides nicely as a five wave impulse. This gives me confidence today that submicro wave (2) is now over. I expect to see a strong increase in downwards momentum tomorrow as the middle of a third wave unfolds.
At 1,930 submicro wave (3) would reach 1.618 the length of submicro wave (1). Submicro wave (3) should have the power to break support at the lower edge of the light blue base channel drawn about submicro waves (1) and (2).
Thereafter, submicro wave (4) should be shallow and sideways, and should last at least one day and probably longer. It should show up on the daily chart as one or more green candlesticks or doji’s.
Within submicro wave (3) minuscule wave 2 may not move beyond the start of minuscule wave 1 above 1,982.52.
Alternate Bullish Wave Count.
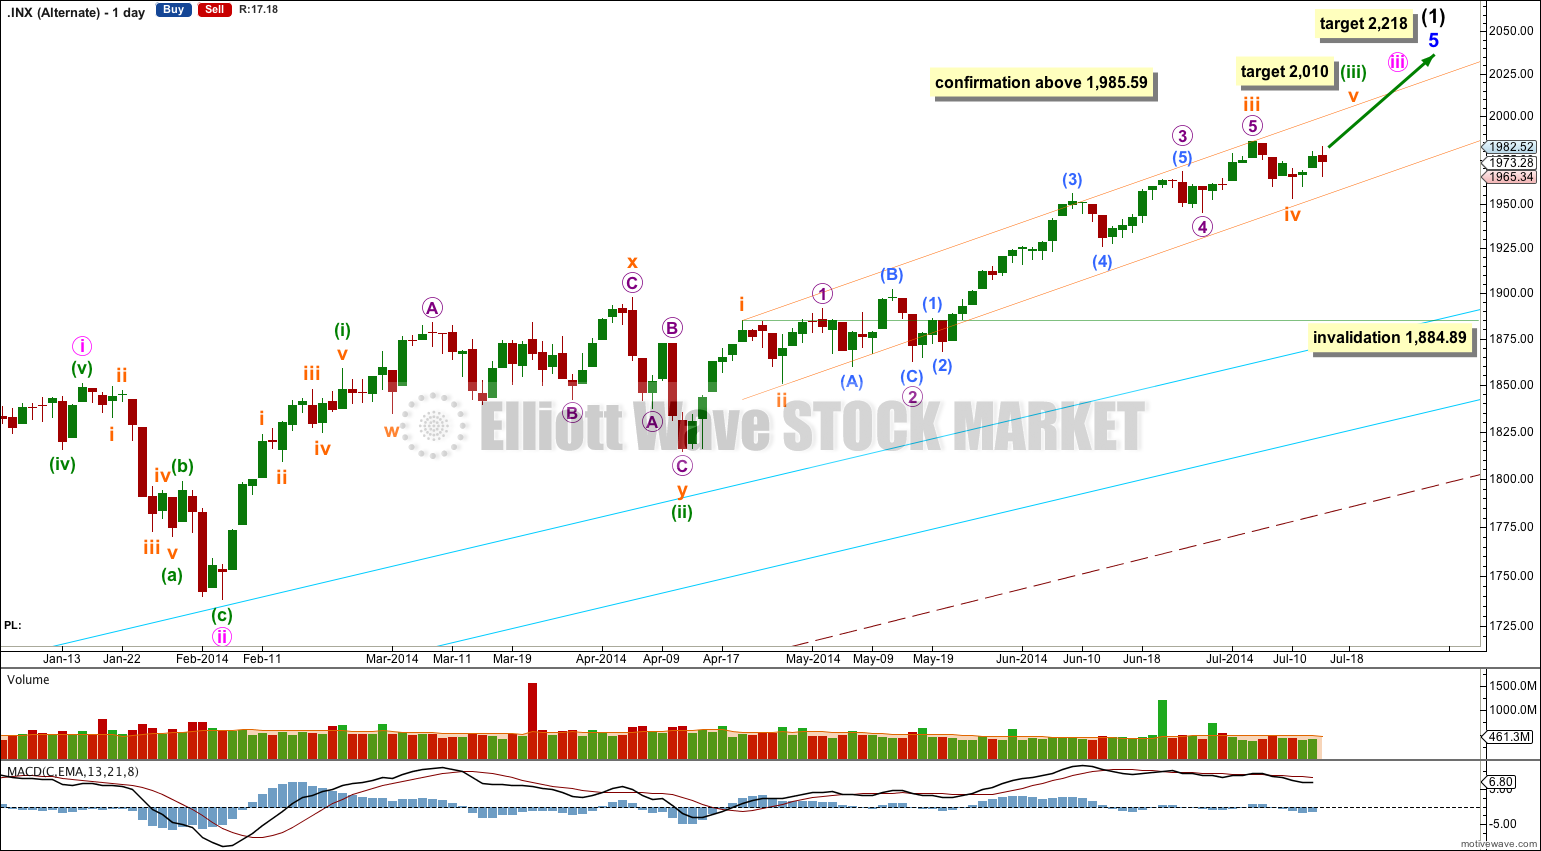
It is possible that subminuette wave iv is complete, as a zigzag that’s nicely in proportion with subminuette wave ii (both waves lasted four days).
Within subminuette wave iii this wave count sees micro wave 2 as a very rare running flat correction. Normally running flats only show up in the middle of very strong movements, but this one is not exactly in the middle of a very strong movement. This reduces the probability significantly for this wave count.
At this stage this wave count would be confirmed with a new high above 1,985.59. If this price point is passed my target for the trend to be interrupted by the next fourth wave correction is 2,010. At that point minuette wave (iii) would reach 1.618 the length of minuette wave (i).
Bearish Alternate Wave Count.
This bearish alternate wave count expects that the correction is not over. The flat correction which ended at 666.79 was only cycle wave a (or w) of a larger super cycle second wave correction.
The structure and subdivisions within primary wave C for the bear wave count are the same as for intermediate wave (1) for the bull wave count. Thus the short to mid term outlook is identical.
The differentiation between the bull and bear wave count is the maroon – – – channel. The bull wave count should see price remain above the lower maroon – – – trend line. The bear wave count requires a clear breach of this trend line. If this trend line is breached by a full weekly candlestick below it and not touching it then this bear wave count would be my main wave count and I would then calculate downwards targets.
We should always assume the trend remains the same until proven otherwise; the trend is your friend. While price remains above the lower maroon – – – trend line I will assume that the S&P 500 remains within a bull market.
This analysis is published about 10:09 p.m. EST.
One of the problems with this market is that everyone is expecting a major downturn in the market, which means it won’t happen. I work next to Wall Street in NYC, and trust me, everyone is maintaining a healthy short position as a hedge, while buying momentum stocks. Everyone is saying that we have come too far too fast. Just today, Bloomberg, the largest financial publication in the world, published an article titled Bubble Paranoia Setting in as S&P 500 Surge Stirs Angst.” In the article, a survey of financial professionals found that three in five believe the market is on the verge of a bubble or already in one. So when the market has a mild sell off, the shorts cover and bring the market back up. Incredibly, the S&P short level is at a record high. There has never been a large drop in the market when the short position has been this high. Elliott Waves theory is very flexible.. We may look back on this period and say that we had a continual series of WXY waves that made no one money.. It wore out the shorts and the longs.
I absolutely completely agree.
I notice a fair bit of comment in the mainstream media (the little I do read) here in New Zealand expecting our property and stock markets here to pop. Our property market is rising strongly.
When mainstream commentators mention that the market may have a big correction, or possibly crash, or a bubble might burst, then an EW contrarian approach is that it will not happen.
Only when everyone is in agreement (or the only dissenting voices are very few and not mainstream) that the bull market is here to stay, will a big correction be possible.
I wonder of the last bearish sentiment could be shaken out by October? Perhaps, if the main wave count finishes this small correction, and keeps going up, the next two fourth wave corrections could shake out the bears? Perhaps then everyone could be very bullish… and then maybe we would see a bigger correction or maybe even a crash.
I don’t think this market is ripe for it yet.
Yes. I don’t think we are at a euphoric high which signifies a market top either. Unfortunately I thought we were and have been burned trying to time it. The problem with possibly looking at October for a market top is that once again everyone knows that, historically, major drops have occurred during that time period. So once again, everyone will be predicting that it will happen during that month. Either way, over the next month or so, unlike what seems to be a growing chorus expecting a correction, I don’t see major downside from here. But then again, I think the upside could be limited, too, in the immediate weeks ahead. So I will be looking for a trading range between 1935 and 1985. One telling sign that we may be getting a small pullback soon to the lower part of that range is that the Russell 2000 has not participated in the recent rally.
I remember here in New Zealand the 1987 stock market crash was really significant. That happened in October.
I agree that if analysts are looking at October for a possible trend change then it would be less likely to happen, but it has happened three times at least now. The first time may have been a surprise, as could the second. But the third?
And finally, theres another point to consider. As bull markets rise the popularity of fundamental analysis increases and technical analysis decreases. At the high technical analysis will be at a low in respect and following. What we are doing here on this website will be derided as “reading tea leaves” or similar. At that stage technical anlaysis which expects a big trend change will be disregarded by most analysts and investors.
But still, I agree with you, we’re not there yet.
Hello Lara,
I agree spx is not behaving normally. All the 3rd waves are aborted prematurely and the price swings are becoming smaller and smaller. This still looks like your original idea of rising wedge/ ending diagonal. Only problem is wave 4 does not overlap in wave 1 territory but after doing some research it says its common but not necessary to overlap.
Every day looking at chart it feels bulls dont want to lose control but they are not as strong as they used to be. until it breaks upper line is it still a possibility. It is much more clear on dow chart. Ill post dow chart for u to look at.
Thanks
Aseem
Also I wanted to show this chart of the S&P 500 (it is not a wave count), where you can see that we have more than a month old negative divergence on the MACD of the S&P 500.
The last two times that happened we got about a 100 points drop on the S&P 500.
Not making a prediction, just an observation.
Thank you for your comments.
I completely agree. I’m noticing the strong persistent divergence with MACD and price as well.
I agree that it should herald a strong drop.
One of these fourth waves should do that.
Hello, Lara, I have a question for you. Is it possible that we have just finished or are very close to finish an ending diagonal triangle on the S&P 500 as shown in this chart?
I think this wave count would make more sense in the DJIA, but I think it fits the S&P 500 as well. As well as the one month old S&P 500 negative divergence on the MACD.
Thank you for your answer.
Yes, thats possible. And it would explain the last three days movement rather nicely.
It has a couple of problems though; the second wave lasted 17 days and the fourth wave is out of proportion lasting only three days. Thats a big difference.
Also, the first wave within that diagonal looks better as a five rather than a three.
But yeah, overall its possible.
Actually, looking at that possible diagonal more closely theres another problem with it.
The third wave is shorter than the first wave.
But the fourth wave is longer than the second wave.
So the diagonal is neither expanding nor contracting.
Because a third wave may never be the shortest that idea would be invalidated above 1,993.78.