
I had expected to see an increase in downwards momentum for Friday’s session, but this is not what happened. Price remains below the invalidation point on the hourly chart, but upwards movement slightly changes the Elliott wave count on the hourly chart.
Summary: I expect downwards movement to continue for a few days to a target at 1,924. I have an alternate which expects a continuation of upwards movement, and it would be confirmed with movement above 1,985.59. I expect Monday to open with a little upwards movement before a third wave down begins.
Click on charts to enlarge.
The aqua blue trend lines are critical. Draw the first trend line from the low of 1,158.66 on 25th November, 2011 to the next swing low at 1,266.74 on 4th June, 2012. Create a parallel copy and place it on the low at 1,560.33 on 24th June, 2013. While price remains above the lower of these two aqua blue trend lines we must assume the trend remains upwards. This is the main reason for the bullish wave count being my main wave count.
Bullish Wave Count.
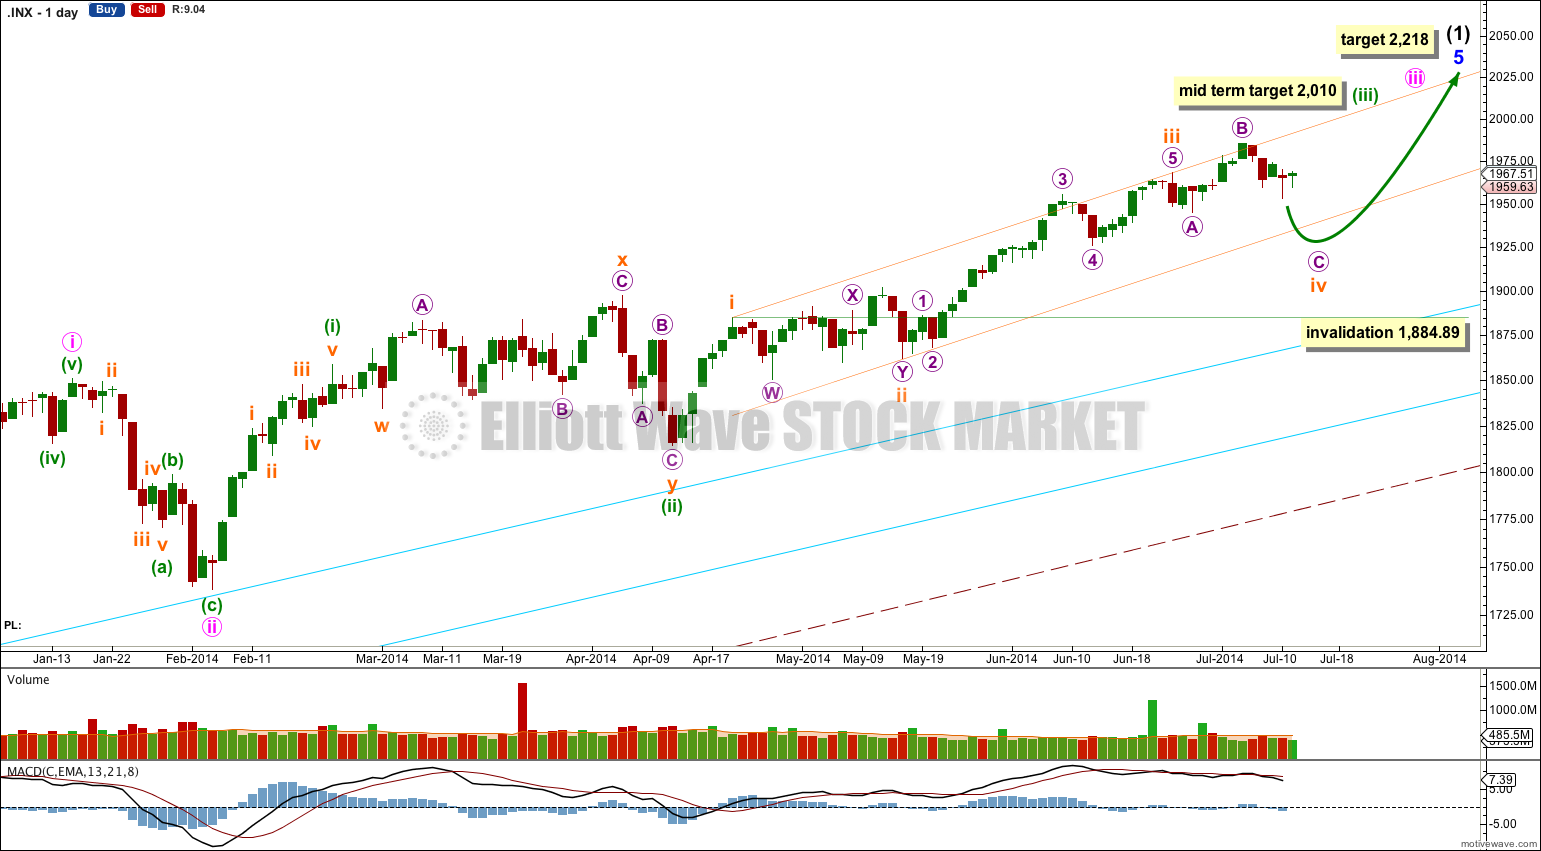
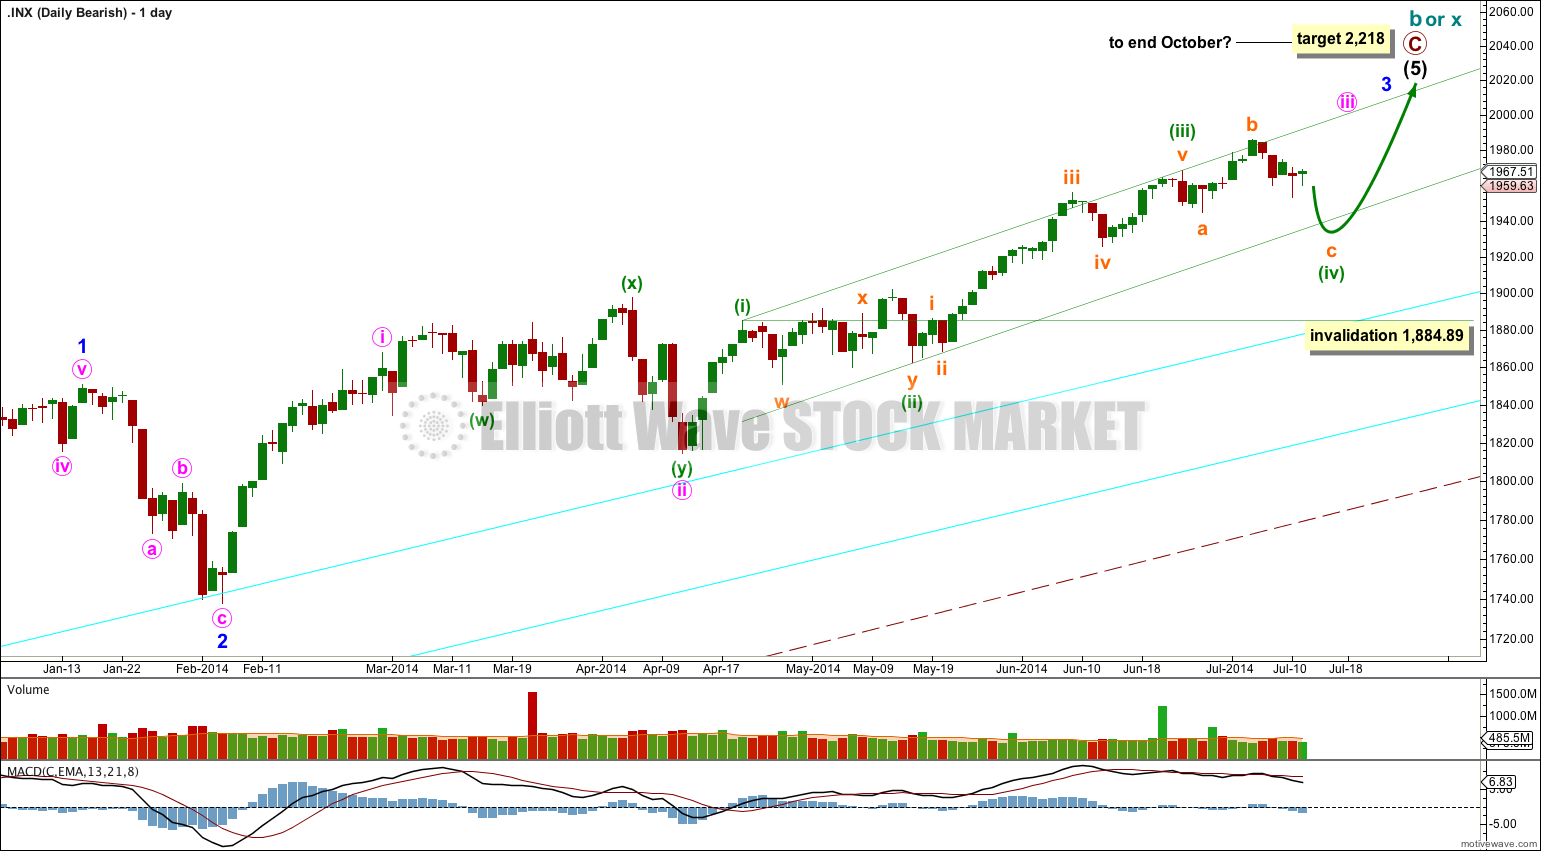
There are a couple of things about this wave count of which I am confident. I see minor wave 3 within intermediate wave (1) as over at 1,729.86 (19th September, 2013). It has the strongest upwards momentum and is just 0.76 longer than 2.618 the length of minor wave 1. At 455 days duration this is a remarkably close Fibonacci ratio. The subdivisions within it are perfect. If this is correct then minor wave 4 ends at 1,646.47 and this is where minor wave 5 begins.
Minor wave 5 may be only one of two structures: a simple impulse or an ending diagonal. At this stage an ending diagonal looks less likely, and most recent upwards movement is looking like a third wave so a more common impulse is more likely.
Along the way up towards the final target I would expect to see three more corrections complete. The first for subminuette wave iv is most likely to be somewhat in proportion to subminuette wave ii which lasted 17 days. So far subminuette wave iv has lasted only 12 days and is very likely to continue.
Subminuette wave iv may not move into subminuette wave i price territory below 1,884.89.
At 2,010 minuette wave (iii) would reach 1.618 the length of minuette wave (i).
At 2,218 minor wave 5 would reach equality in length with minor wave 3. This target may be met in October.
I have drawn a parallel channel about minuette wave (iii) using Elliott’s first technique: draw the first trend line from the highs of subminuette waves i to iii, then place a parallel copy on the low of subminuette wave ii. The upper edge of this channel is slightly overshot, and this may indicate an overshoot on the opposite side may happen when subminuette wave iv ends.
There is still divergence with price trending higher and MACD trending lower on the weekly chart, and a little on the daily chart for most recent movement. This classic technical divergence indicates that a correction should unfold.
The large maroon – – – channel is copied over from the weekly chart. It is drawn in exactly the same way on bull and bear wave counts. For the bull wave count this channel is termed a base channel about primary waves 1 and 2. A lower degree second wave should not breach the lower edge of a base channel drawn about a first and second wave one or more degrees higher. The lower maroon – – – trend line differentiates the bull and bear wave counts.
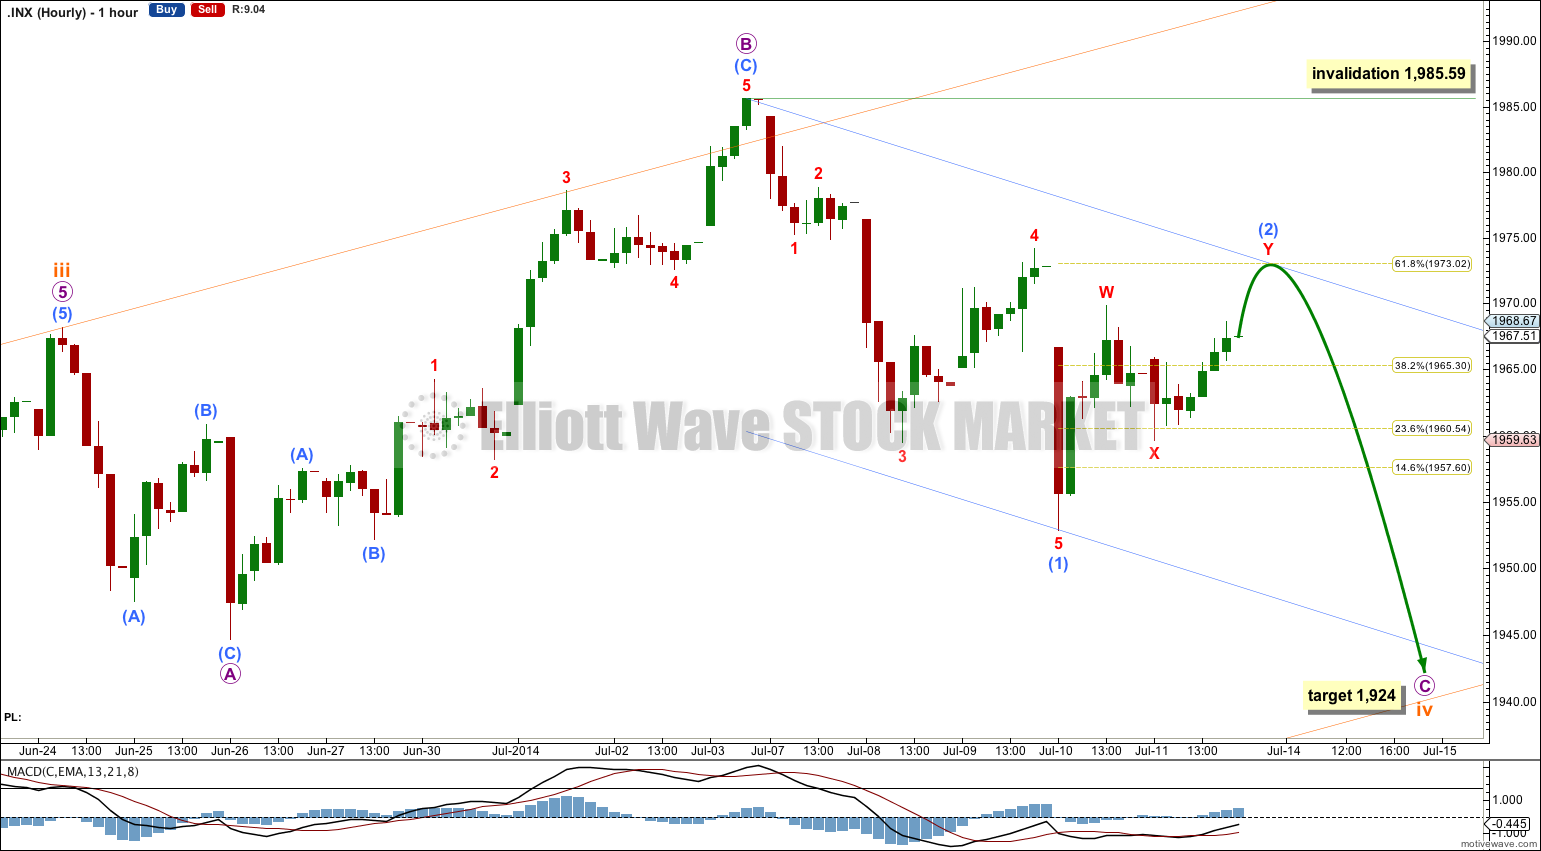
Subminuette wave iv may be unfolding as an expanded flat correction; micro wave B within it is a 174% correction of micro wave A. This is longer than the maximum common length of 138% but still entirely viable.
The overshoot of the upper edge of the channel may indicate an overshoot of the lower edge to come.
At 1,924 micro wave C would reach 2.618 the length of micro wave A. This could see subminuette wave iv slightly overshoot the channel at the lower edge.
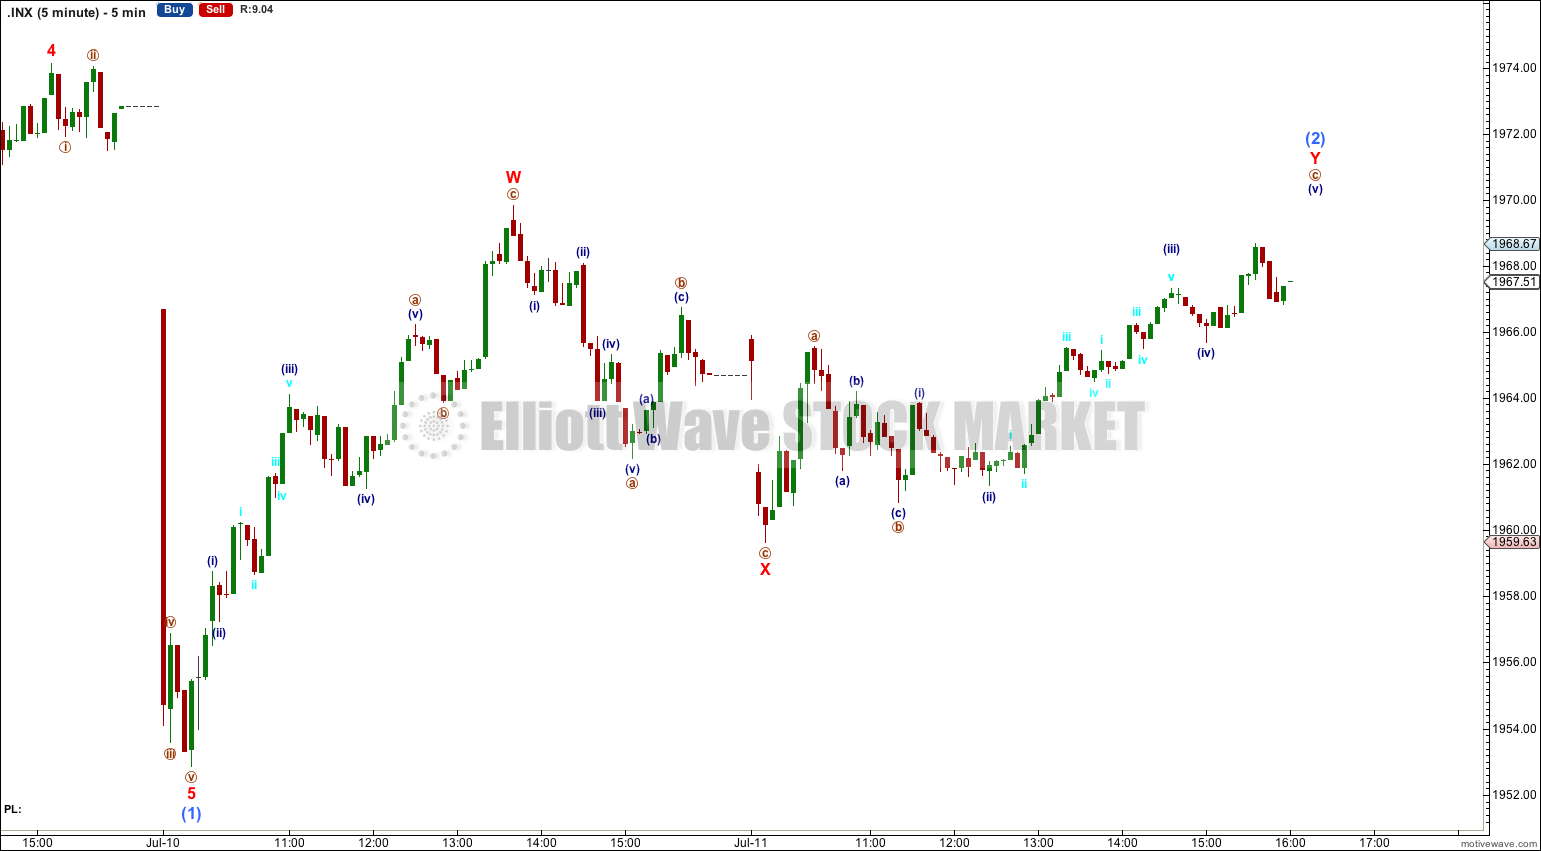
I have adjusted the labeling of the structure of submicro wave (1) to see it as ending lower down. Although it has a slightly odd look in that its second and fourth wave corrections are disproportionate, the structure for submicro wave (2) then makes more sense.
Submicro wave (2) may be an incomplete double zigzag. The second zigzag in the double should move price higher. It may end about the 0.618 Fibonacci ratio of submicro wave (1) at 1,973.02.
When submicro wave (2) is done then I would expect to see an increase in downwards momentum as a third wave unfolds.
Submicro wave (2) may not move beyond the start of submicro wave (1) above 1,985.59.
Alternate Bullish Wave Count.
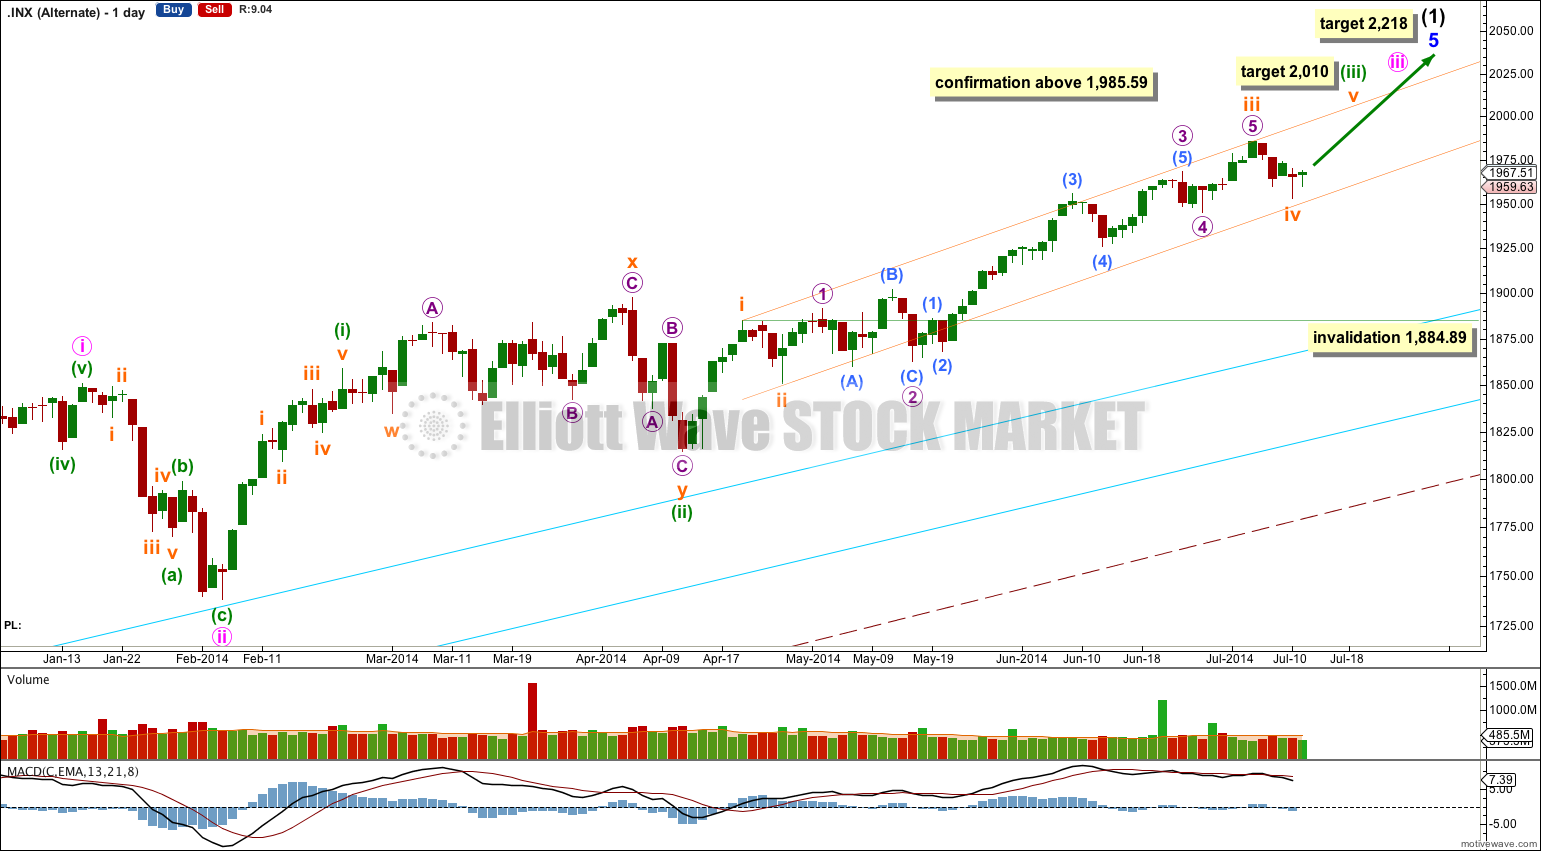
It is possible that subminuette wave iv is complete, as a zigzag that’s nicely in proportion with subminuette wave ii (both waves lasted four days).
Within subminuette wave iii this wave count sees micro wave 2 as a very rare running flat correction. Normally running flats only show up in the middle of very strong movements, but this one is not exactly in the middle of a very strong movement. This reduces the probability significantly for this wave count.
At this stage this wave count would be confirmed with a new high above 1,985.59. If this price point is passed my target for the trend to be interrupted by the next fourth wave correction is 2,010. At that point minuette wave (iii) would reach 1.618 the length of minuette wave (i).
Bearish Alternate Wave Count.
This bearish alternate wave count expects that the correction is not over. The flat correction which ended at 666.79 was only cycle wave a (or w) of a larger super cycle second wave correction.
The structure and subdivisions within primary wave C for the bear wave count are the same as for intermediate wave (1) for the bull wave count. Thus the short to mid term outlook is identical.
The differentiation between the bull and bear wave count is the maroon – – – channel. The bull wave count should see price remain above the lower maroon – – – trend line. The bear wave count requires a clear breach of this trend line. If this trend line is breached by a full weekly candlestick below it and not touching it then this bear wave count would be my main wave count and I would then calculate downwards targets.
We should always assume the trend remains the same until proven otherwise; the trend is your friend. While price remains above the lower maroon – – – trend line I will assume that the S&P 500 remains within a bull market.
This analysis is published about 08:41 p.m. EST.
Lara, are you publishing your analysis later nowadays? I’m in NY and it’s nearly 11pm right now.
Yes it is a bit unusual. But the subdivisions fit perfectly and the Fibonacci ratios are amazing. It also fits with momentum.
When third waves are very long extensions then sometimes the subsequent fourth wave is much shorter in duration. Thats okay.
Minor wave 1 lasted only 3 weeks, minor wave 2 lasted only 4 weeks. Minor wave 3 is a long extension lasting 94 weeks. MInor wave 4 was brief and shallow (minor wave 2 was deep so nice alternation there) lasting only 3 weeks. Thats perfectly okay.
Thank you. Now I can see what you mean.
No, I don’t think that will work. Where you have C of the triangle its only at 1,952.86, which is only very slightly below the end of the start of the triangle at 1,955.55.
This means that the end of the triangle will have difficulty retracing the prior third wave. Your E wave of the triangle must move below the start of the triangle at 1,955.55 so that the triangle effects a net retracement of the prior wave of the same degree.
Lara, can you comment on this chart? This person studies EW as much as you do and it certainly varies from what you have? I guess all I’m looking for is if there’s any concerns with the count.
Hi Laura: If minor wave four indeed ended at 1446.47 on October 9, 2013, it would have been incredibly short compared to the duration of minor wave 3. It this not a bit unusual so far as time relationships go among motive waves?
Hi Lara,
Please look at possibility of triangle forming with below labels. Wave structure supporting it
A : 1950
B : 1985
C : 1952
D : 1970
E : 1960
If above holds true breakout to all time highs and subsequent correction that could drop to 1900 levels possible.
Please review and comment
Thx
I don’t think you’ve read the comments policy.
Please do so.
Sorry. My bad. Attaching the chart of SPY with counts as I don’t have SPX hourly on Tradingview.com I follow.
Please review and comment.
Thx