
A little upwards movement to the short term target at 1,955 may have completed the structure. I have a monthly and weekly chart for you today to look at divergence and RSI.
Summary: We may have seen the end to upwards movement for the mid term. In the first instance I want to see the small channel on the hourly chart clearly breached to indicate a trend change. Thereafter, movement below 1,918.60 would provide some confidence, and finally movement below 1,868.17 would provide full confidence.
This analysis is published about 06:25 p.m. EST. Click on charts to enlarge.
The aqua blue trend lines are critical. Draw the first trend line from the low of 1,158.66 on 25th November, 2011 to the next swing low at 1,266.74 on 4th June, 2012. Create a parallel copy and place it on the low at 1,560.33 on 24th June, 2013. While price remains above the lower of these two aqua blue trend lines we must assume the trend remains upwards. This is the main reason for the bullish wave count being my main wave count.
Bullish Wave Count.
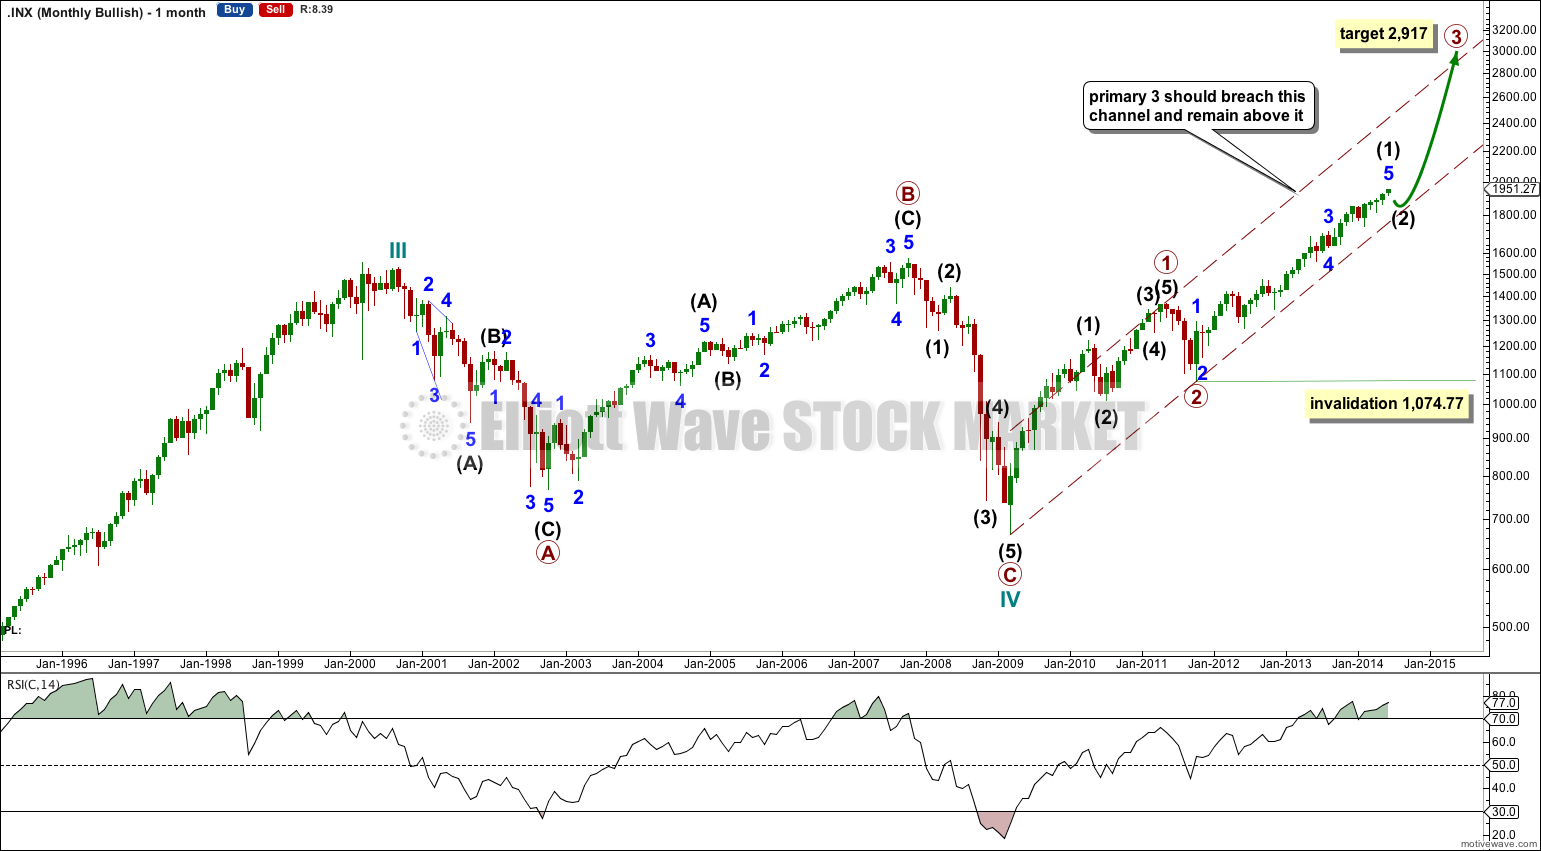
I have noticed on the monthly chart that over the last 14 years RSI persistence above 70.0 precedes a large market correction. This happened for several years before the Dotcom crash, and again for several months just prior to the credit crunch.
RSI below 30.0 also precedes a market low and subsequent rally: in October 2002 the end of the Dotcom crash was preceded by a brief dip below 30.0, and the end of the credit crunch in March 2009 was preceded by a strong drop below 30.0.
RSI is again comfortably above 70.0 and has been for about a year now (with fluctuations). This may be an indicator of a reasonable market correction, but this observation fits with the bearish wave count more than this bullish wave count.
Interestingly at no time within the last 14 years does RSI dip below 30.0 or above 70.0 and not indicate a low / high.
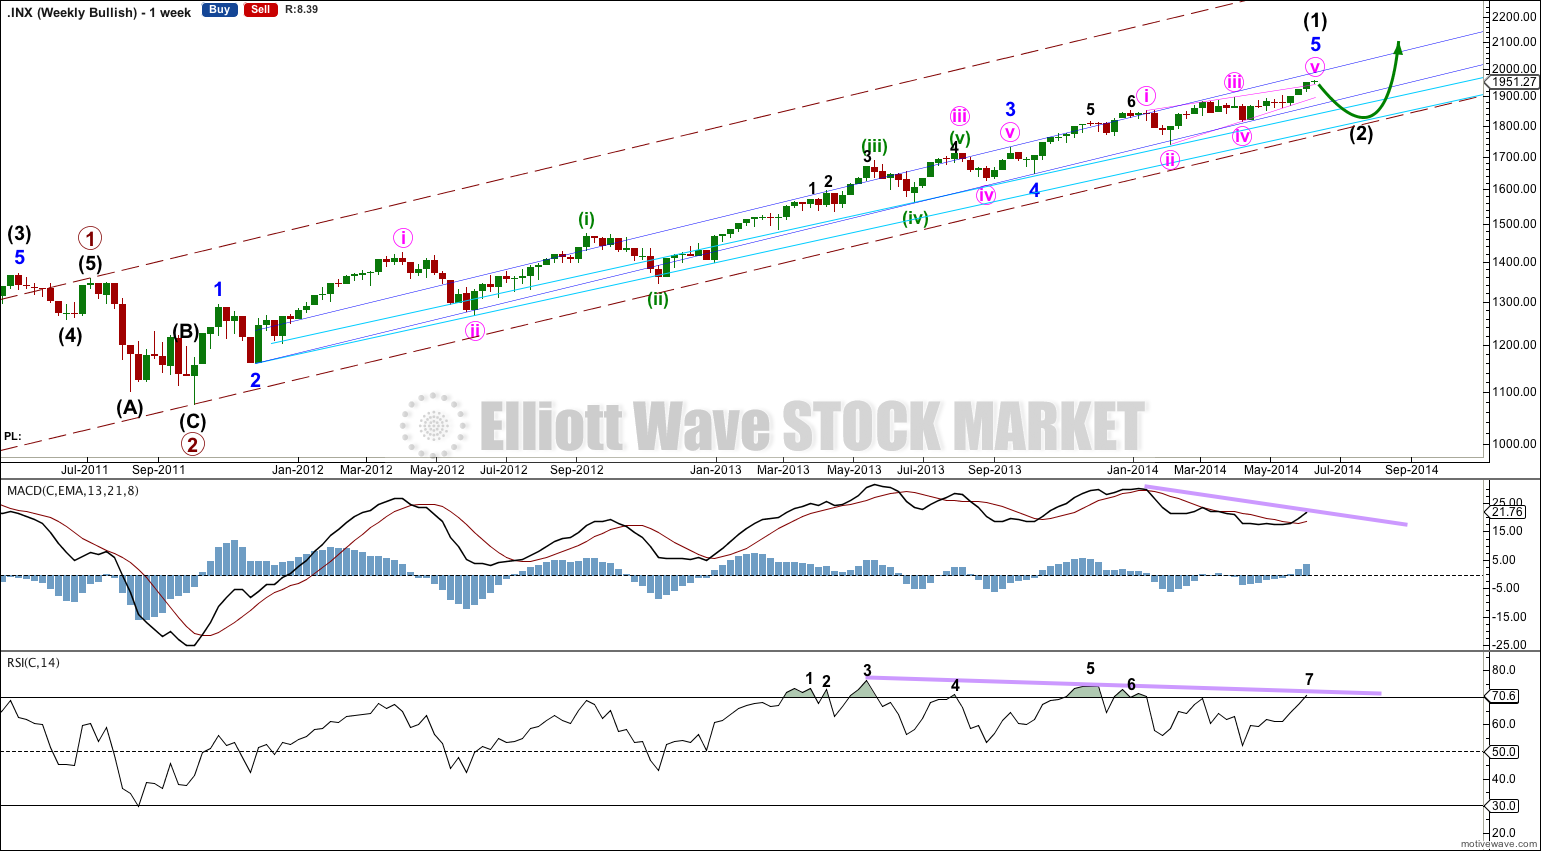
At the weekly chart level there is some divergence between MACD and price, and RSI and price. The divergence with MACD is stronger. This indicates at least a reasonable market correction to last a few weeks, which should look something like minuette wave (iv), minute wave iv or minor wave 4, but probably a little larger.
The wave count at the weekly chart level fits perfectly with MACD. Strongest upwards momentum is at minuette wave (iii) within minute wave iii within minor wave 3. Within minuette wave (iii) the histogram has the highest readings in the middle of it.
Looking at RSI over this time period I notice six instances of it reaching over 70.0 (marked 1-6 in black) before this last crossing. In each instance this was followed by a market correction of at least two weeks, and up to five weeks. RSI is again over 70.0 and so the probability of a correction to last at least two weeks is reasonable.
I have looked for alternate wave counts for this piece of movement. What if intermediate wave (1) is not over? Could it continue higher?
I do not want to see the high for minor wave 3 anywhere else for this wave count. Here minor wave 3 is just 0.76 points longer than 2.618 the length of minor wave 1. At almost two years in length and 571.20 points in total for minor wave 3 this close Fibonacci ratio is remarkable. That it fits with MACD is further evidence that this portion of the wave count is very likely to be correct.
There are two possible structures for minor wave 5: an ending diagonal or an impulse. The current wave count sees an ending diagonal. I have looked at the possibility of an impulse, but the subdivisions simply do not fit. Even if I try to see a series of overlapping first and second waves this leaves some first waves which subdivide rather clearly as threes, not fives.
The most obvious alternate would be to move the degree of labeling within minor wave 5 all down one degree and see this as a leading diagonal for minute wave i within minor wave 5. But this idea would still expect a correction from this point for minute wave ii. Second waves following leading diagonals are normally very deep, and so the size of the expected correction would still be expected to be reasonable.
This bullish wave count expects a cycle degree correction was over at 666.79 for a fourth wave, and a new cycle degree bull market began there for a fifth wave. Within cycle wave V primary waves 1 and 2 are complete. Within primary wave 3 intermediate wave (1) may be just now complete.
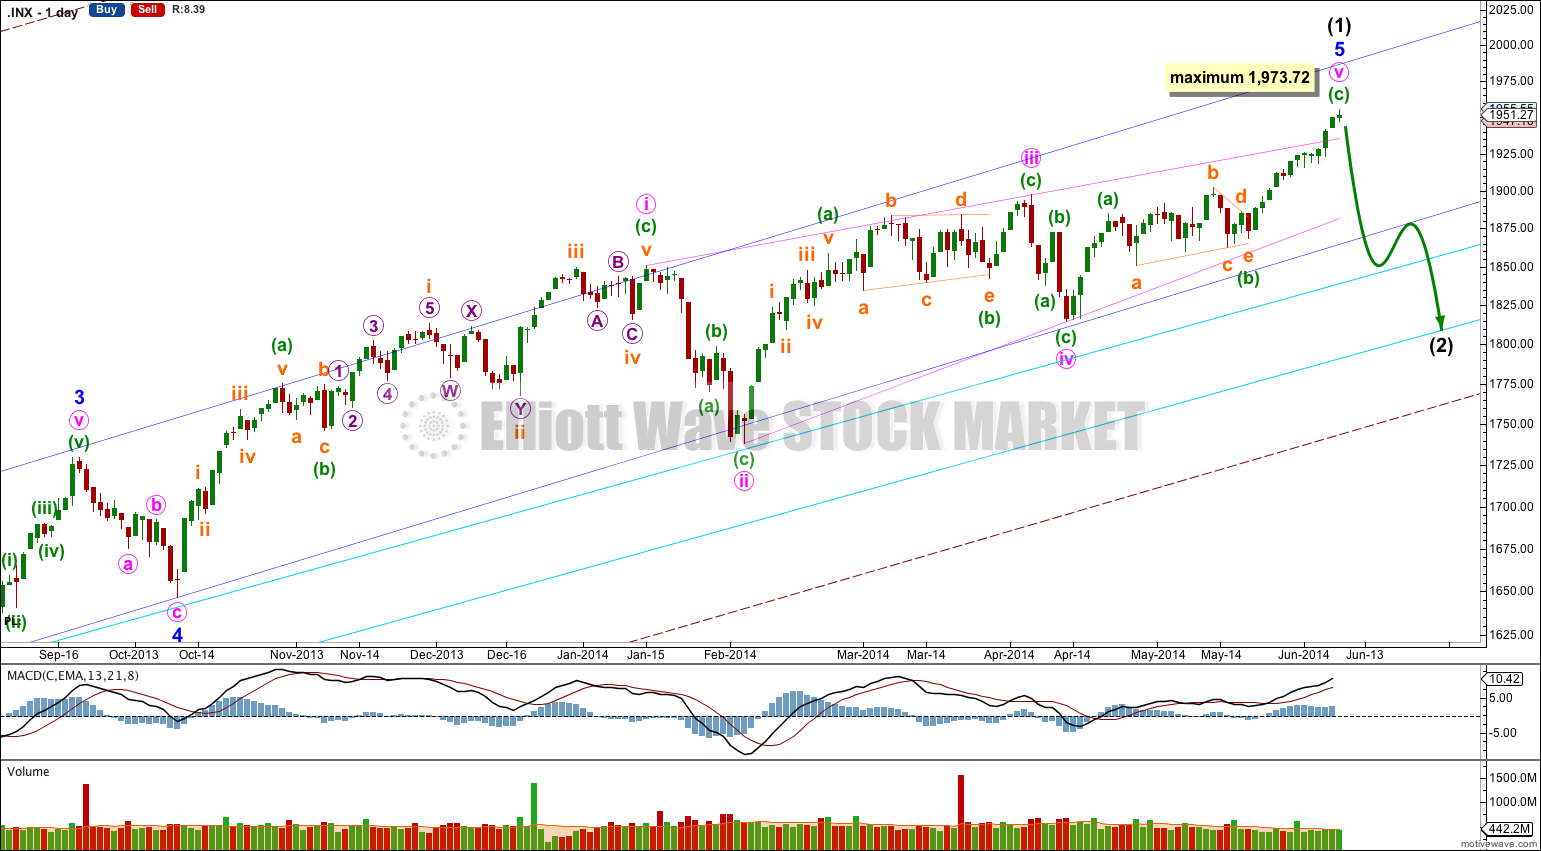
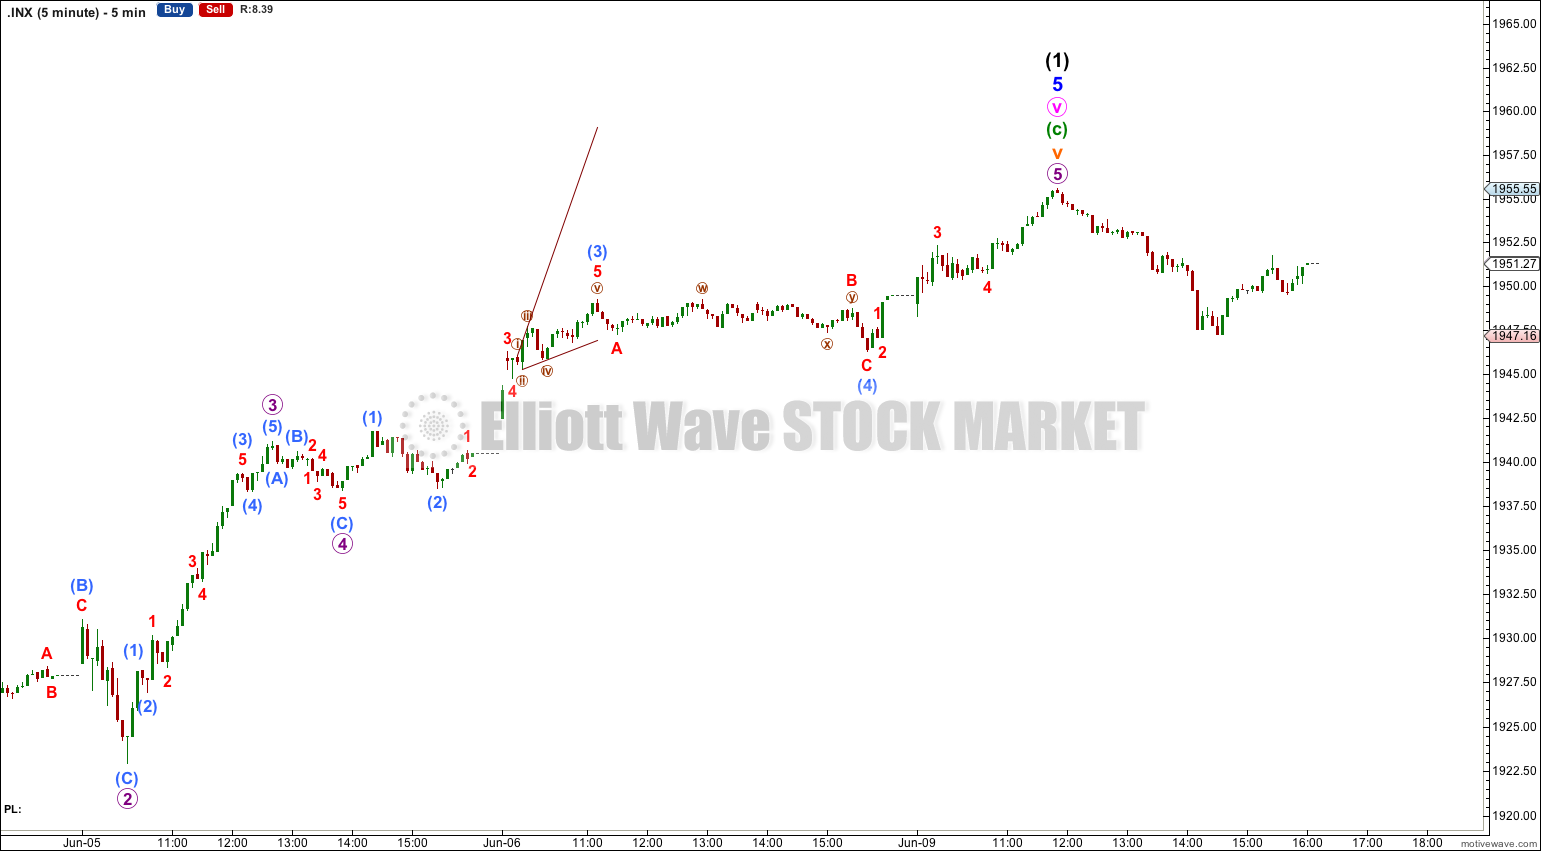
Minor wave 5 is a complete ending contracting diagonal. Within an ending diagonal all the subwaves must be single zigzags, and the fourth wave should overlap first wave price territory.
The final fifth wave of this diagonal may have ended with an overshoot the upper i-iii trend line of the contracting diagonal. This is the most common place for fifth waves of ending contracting diagonals to end.
The diagonal is contracting because minute wave iii is shorter than minute wave i. Minute wave v may not be longer than equality with minute wave iii at 1,973.72 because a third wave may never be the shortest wave. At this stage it is not confirmed that the final fifth wave of the diagonal is over.
There is still divergence with price trending higher and MACD trending lower. This classic technical divergence supports this wave count and indicates that at least a reasonably sized correction should arrive soon. By reasonably sized I mean in fitting with this bullish wave count: Intermediate wave (2) should last at least three or four weeks, probably longer, and should not breach the lower aqua blue trend line nor the lower edge of the maroon – – – channel. The wave count remains bullish at primary degree.
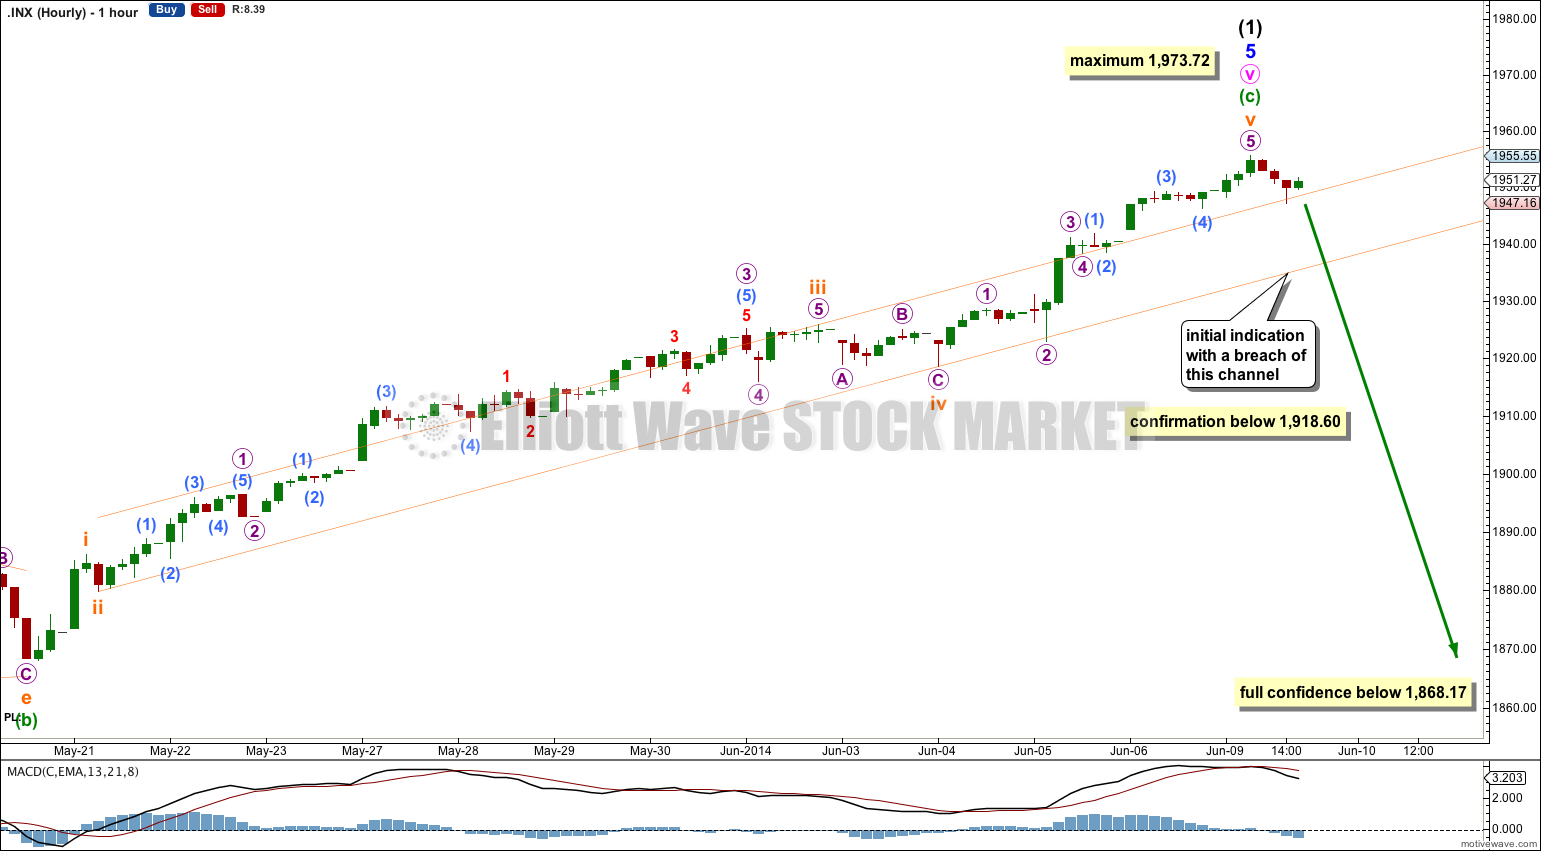
Again the structure within minor wave 5 ending contracting diagonal is complete. It may be over here. Minuette wave (c) may have ended in a Fibonacci 13 sessions.
Minuette wave (c) has no Fibonacci ratio to minuette wave (a).
Ratios within minuette wave (c) are: subminuette wave iii is 0.83 points short of 2.618 the length of subminuette wave i, and subminuette wave v has no Fibonacci ratio to either of subminuette waves iii or i.
Ratios within subminuette wave v are: there is no Fibonacci ratio between micro waves 3 and 1, and micro wave 5 is 0.94 points short of 1.618 the length of micro wave 1.
At this stage there is absolutely no confirmation of a trend change. To have any confidence in this analysis I first want to see three things:
1. A clear breach of the small channel on the hourly chart. Preferably this should be by clear downwards movement, not sideways movement.
2. Price movement below 1,918.60. At that stage downwards movement could not be a second wave correction within subminuette wave v, and so subminuette wave v would have to be over.
3. Price movement below 1,868.17. At that stage downwards movement could not be a second wave correction within minuette wave (c) and so minuette wave (c) would have to be over.
Once price breaches 1,868.17 I would have full and final confidence that the S&P is in an intermediate degree correction.
Bearish Alternate Wave Count.
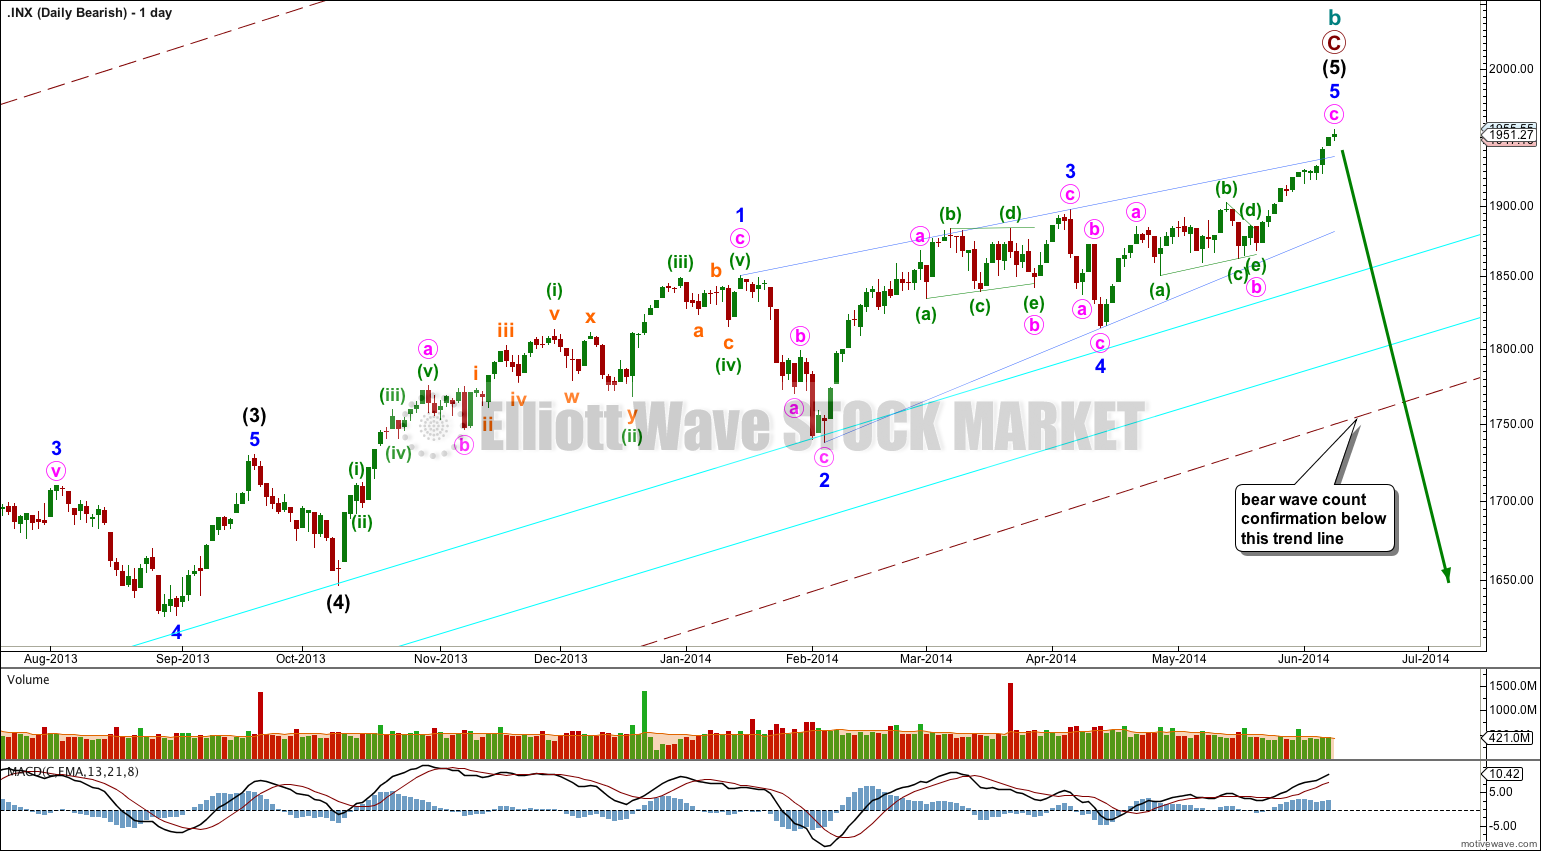
This bearish alternate wave count expects that the correction is not over. The flat correction which ended at 666.79 was only cycle wave a of a larger super cycle second wave correction.
Cycle wave b is now longer than the maximum common length of 138% for a B wave of a flat correction, it is 148%.
Cycle wave b may again be a complete zigzag structure.
A clear breach of the large maroon – – – channel on the monthly and weekly charts is required for confirmation of this wave count. If that happens then this would be my main wave count and would be strongly favoured. Only once this wave count is confirmed will I calculate downwards targets for cycle wave c for you; it would be premature to do that prior to confirmation.
That is most often what they do, but it is not the same as saying it must always be what they do.
It’s a guideline not a rule.
But if the bear wave count is correct then yes, we would see a much larger correction.
The aqua blue trend lines are drawn using a classic TA approach, as outlined in Edwards, Magee and Bassetti. When they are repeatedly tested, last a long time, and are not steep, then they are extremely significant. I cannot state the strength and significance of that lower aqua blue trend line enough.
Lara,
With ending contracting diagonals…….doesn’t classic technical analysis, or Elliott theory, tell us that on completion the price should re-visit the price area where the diagonal started, and probably lower ? This would seem to be the price area at the start of wave 1 of the leading diagonal. This would imply a much bigger correction is likely.
Tyke.