
Price moved a little higher, as I had accepted was possible. The trend line overshoot for the diagonal is looking very typical still. I expect the S&P 500 should move lower from here. The trend change is at least intermediate degree, and may be at primary degree.
Summary: I expect at least a little more movement upwards on Monday morning to a new high. Thereafter, the structure will again be complete. Movement below 1,918.60 would provide initial confirmation of a trend change at intermediate degree. Movement below 1,868.17 would provide full confidence. Once we have confirmation I will be confident in stating that a downwards correction should last several weeks to about two months or so. Prior to confirmation we must accept the possibility of new highs, but not above 1,973.72.
This analysis is published about 11:45 p.m. EST. Click on charts to enlarge.
The aqua blue trend lines are critical. Draw the first trend line from the low of 1,158.66 on 25th November, 2011 to the next swing low at 1,266.74 on 4th June, 2012. Create a parallel copy and place it on the low at 1,560.33 on 24th June, 2013. While price remains above the lower of these two aqua blue trend lines we must assume the trend remains upwards. This is the main reason for the bullish wave count being my main wave count.
Bullish Wave Count.
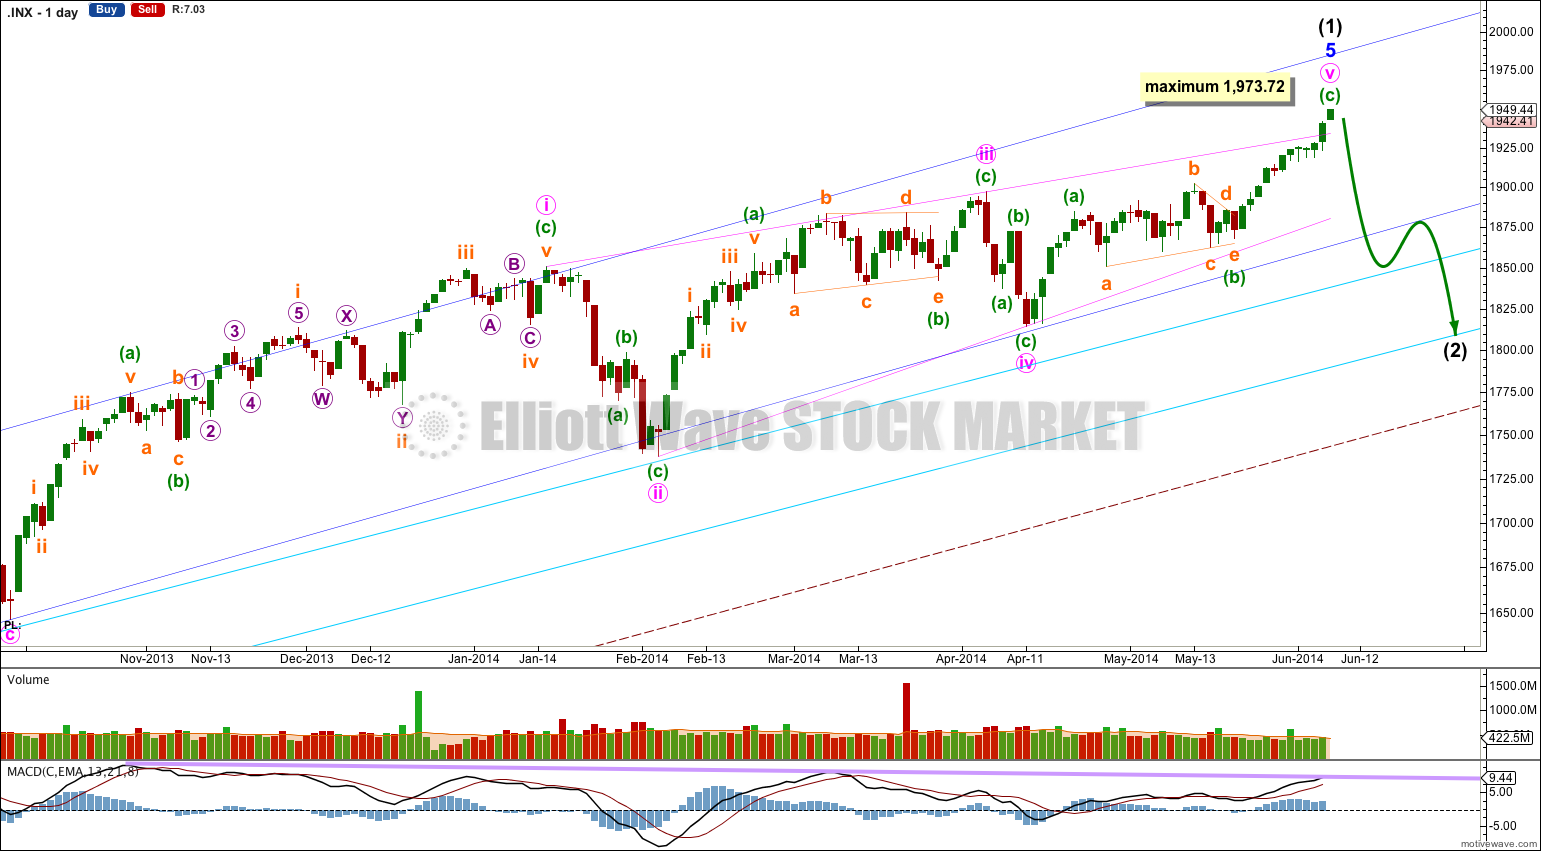
This bullish wave count expects a cycle degree correction was over at 666.79 for a fourth wave, and a new cycle degree bull market began there for a fifth wave. Within cycle wave V primary waves 1 and 2 are complete. Within primary wave 3 intermediate wave (1) may be just now complete.
Minor wave 5 is a complete ending contracting diagonal. Within an ending diagonal all the subwaves must be single zigzags, and the fourth wave should overlap first wave price territory.
The final fifth wave of this diagonal may have almost ended with an overshoot the upper i-iii trend line of the contracting diagonal. This is the most common place for fifth waves of ending contracting diagonals to end.
The diagonal is contracting because minute wave iii is shorter than minute wave i. Minute wave v may not be longer than equality with minute wave iii at 1,973.72 because a third wave may never be the shortest wave. At this stage it is not confirmed that the final fifth wave of the diagonal is over. Prior to confirmation we must accept the possibility of new highs, and in fact I expect to see a new high on Monday.
There is still divergence with price trending higher and MACD trending lower. This classic technical divergence supports this wave count and indicates that at least a reasonably sized correction should arrive soon.
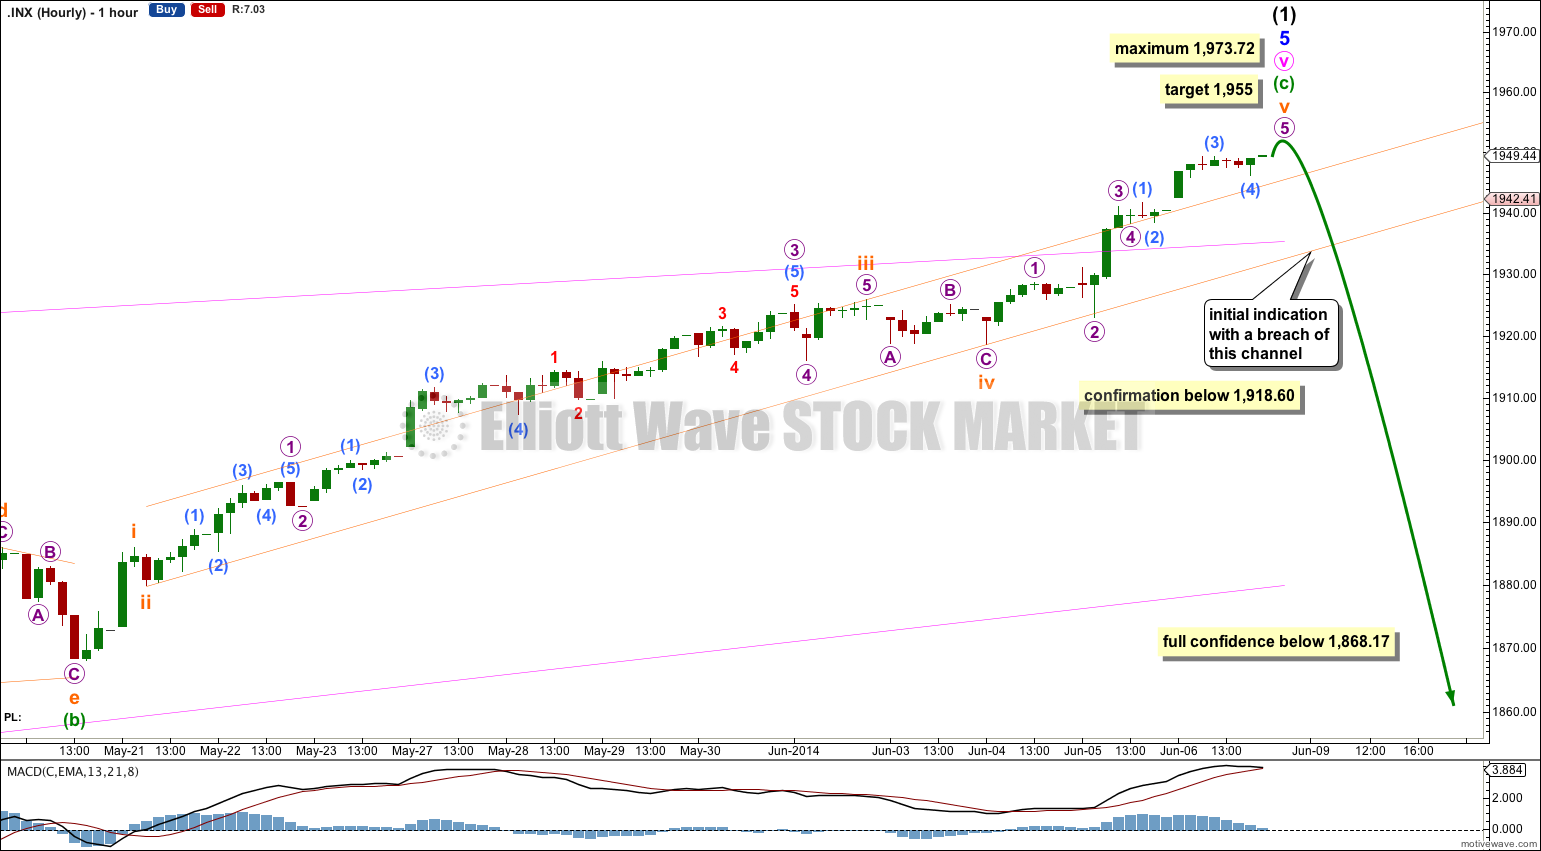
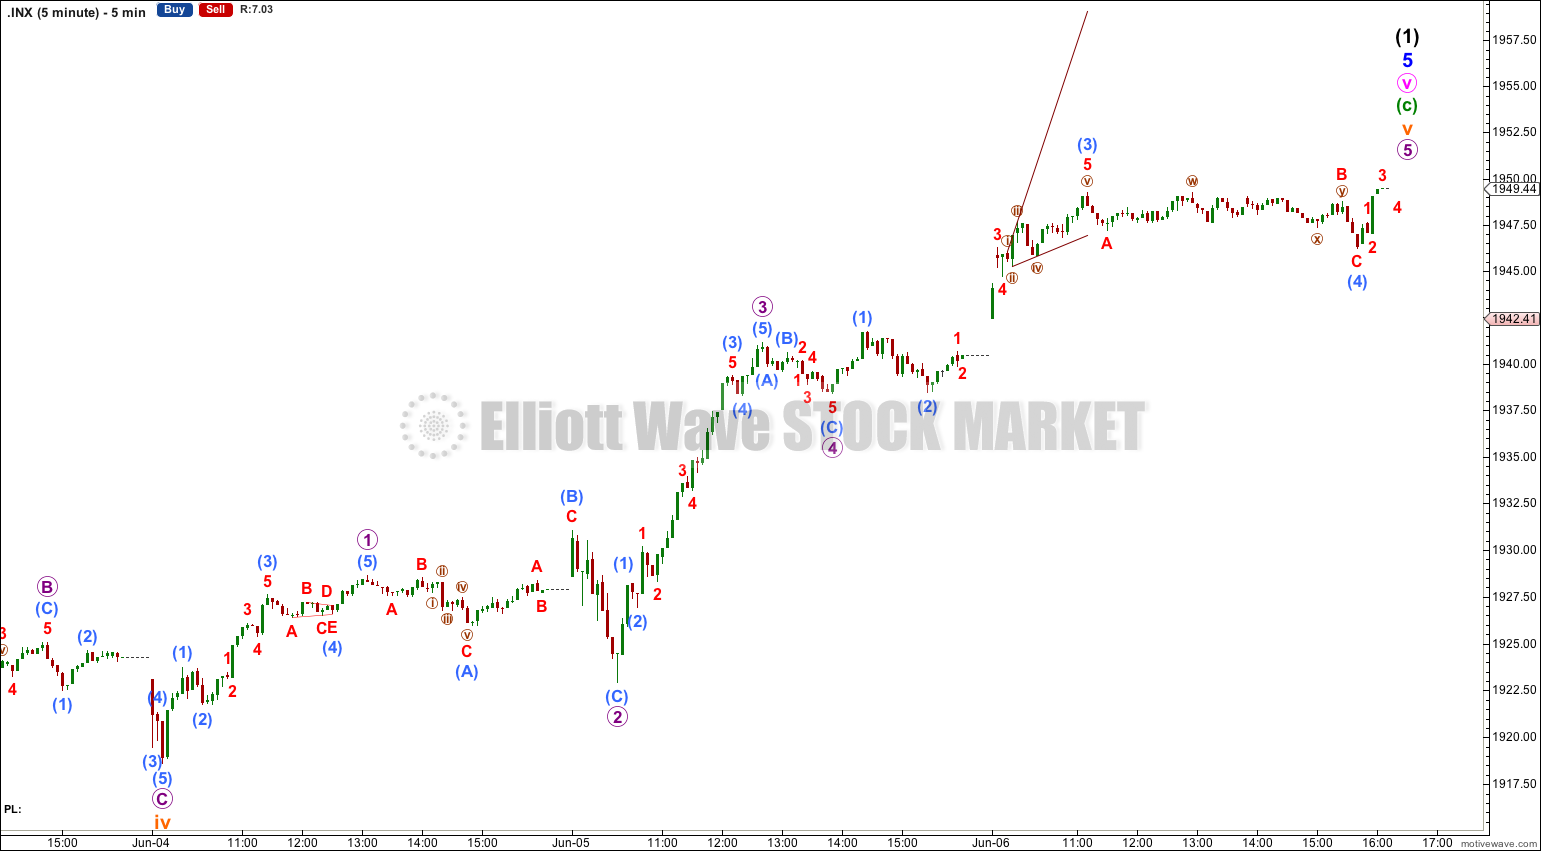
The pink trend line is now comfortably overshot and the structure of minuette wave (c) on the hourly and five minute chart is almost complete. I would expect at least a little more upwards movement on Monday to complete it. At 1,955 micro wave 5 would reach 1.618 the length of micro wave 1.
Within subminuette wave v no second wave correction may move beyond the start of its first wave below 1,918.60. Movement below this point could not be a second wave correction within subminuette wave v, and so movement below this point would indicate subminuette wave v is over.
Movement below the parallel channel containing minuette wave (c) would provide trend channel confirmation that this upwards wave is over.
Finally, movement below 1,868.17 at the start of minuette wave (c) may not be a second wave correction within minuette wave (c), and so at that stage minuette wave (c) must be over. At that stage I would have full confidence in stating that a new downwards trend for intermediate wave (2) has begun.
There is no longer divergence at the hourly chart level with MACD, but the divergence on the daily chart spans a long time period and is clear; it is more important an indicator than a lack of divergence at the hourly chart level.
Bearish Alternate Wave Count.
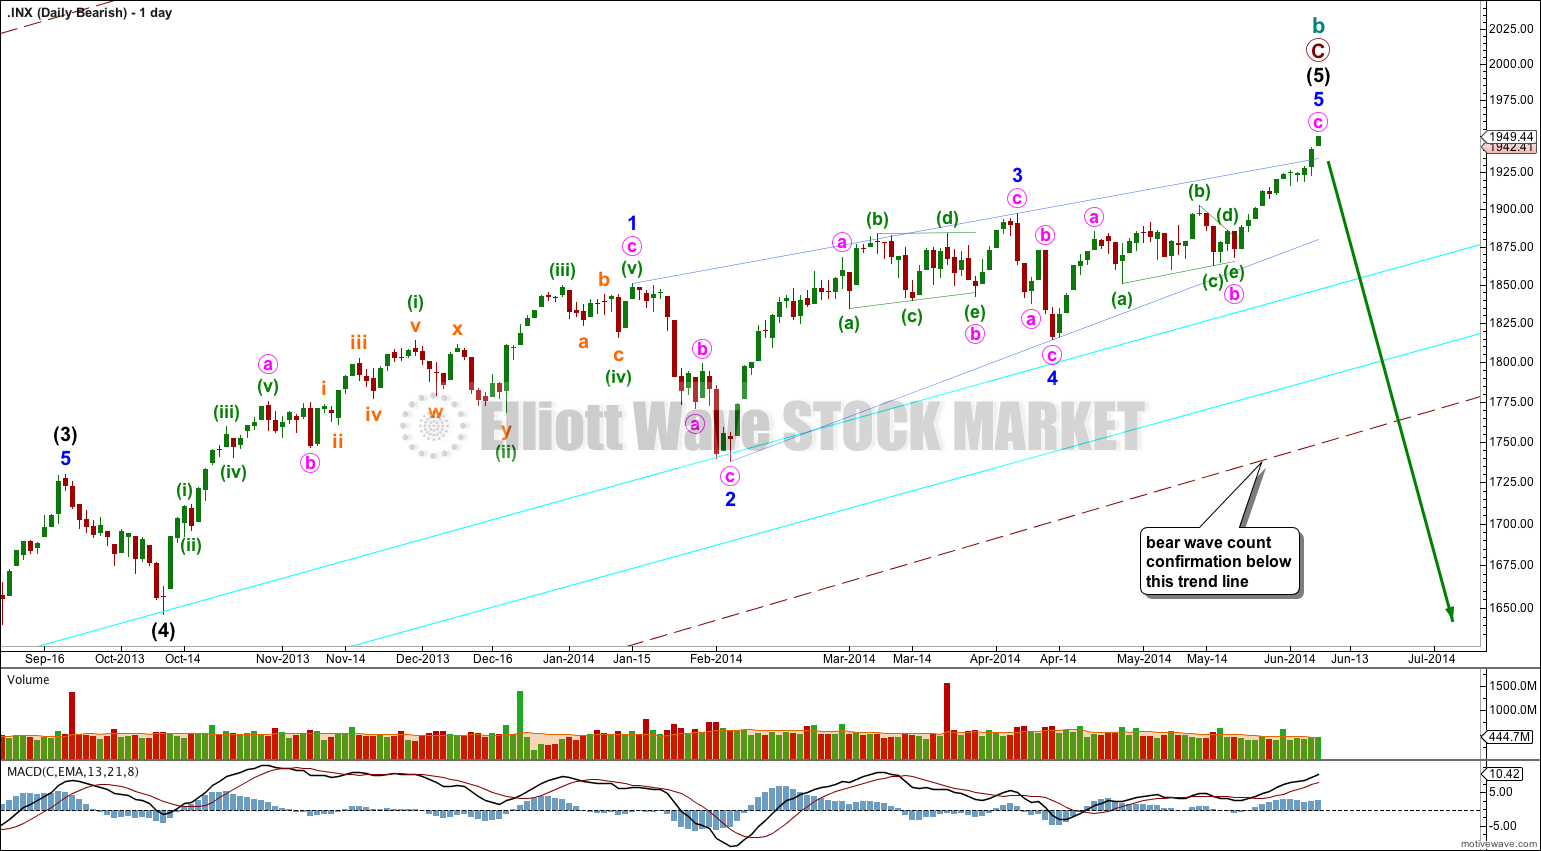
This bearish alternate wave count expects that the correction is not over. The flat correction which ended at 666.79 was only cycle wave a of a larger super cycle second wave correction.
Cycle wave b is now longer than the maximum common length of 138% for a B wave of a flat correction, it is 148%.
Cycle wave b may again be a complete zigzag structure.
A clear breach of the large maroon – – – channel on the monthly and weekly charts is required for confirmation of this wave count. If that happens then this would be my main wave count and would be strongly favoured. Only once this wave count is confirmed will I calculate downwards targets for cycle wave c for you; it would be premature to do that prior to confirmation.
Lara, in order for a top to be in place in the S&P, shouldn’t we see more, definitive divergences in various indicators aside from a possible (and ever so tenuous) MACD divergence? There are no negative divergences in the S&P’s RSI, advance/decline line, or advance/decline volume. I’m playing devil’s advocate here but if the S&P rises to near the 1970 area, it seems that even the MACD divergence will be gone. Don’t we need strong divergent indicators in order to put in an intermediate term top? Thanks in advance.
For the main wave count what I’m looking for is a correction which should look similar to minuette wave (iv) (22 sessions, dropped 126.85 points), or minute wave iv (18 sessions, dropped 82.28 points), or minor wave 4 (14 sessions, dropped 83.39 points).
All these corrections ended at the upper of the two aqua blue trend lines.
I am expecting intermediate wave (2) should last about 22 sessions, probably a bit longer, and may drop over 100 points to end at the lower aqua blue trend line.
The divergence on MACD actually goes back to May 2013 (on the daily chart). so that is pretty significant. Its squished in my charts because I’ve got volume in there as well.
I do note there is no A/D line divergence, nor RSI divergence. I do note though that each time RSI moved above 70.0 this indicated a sizeable drop right afterwards; 21st May, 2013, 18th Sep, 2013, 30th Dec, 2013 and now again RSI is over 70.0 (its at 73.2 for Friday).
However, I do agree that this call for a reasonable correction is a big call. I am concerned that Friday’s momentum was so strong, it looks like a third wave. I am working on the wave count to see an alternative with a third wave about to rocket upwards. If I find something that fits and I’m satisfied with it I’ll publish it right away. So far I’m having real trouble with this.
Sammy – I’ve spent some time on the wave count and looking at MACD and RSI tonight.
Look at the weekly chart with RSI. There’s some pretty good divergence there, with three peaks now.
Look also at RSI on the monthly chart. Look back at prior time periods where RSI was over 70 for some time (months to a year). What happened then?
Its really interesting… and really scary!
I may include a bit of this in the next video.
What do you think of those weekly and monthly charts?
Yes, I do see the weekly divergence and I do agree that your count seems to fit nicely. I just hope we’re not trying to “pick and choose” our charts based on our predictions. It also does seem like we are in 3 wave, although when we are in overthrows of ending diagonals, don’t we usually see that type of momentum, or is it just increased volume we are supposed to see?
According to Frost and Prechter contracting diagonals often end with a throw-over, and the pattern always ends with a volume spike on the throw-over. However, I have not noticed that this always happens. There is a perfect leading contracting diagonal on the daily chart for Gold which ended on declining volume. But the pattern is perfect. Momentum did increase though there too, just as it has for this pattern on the S&P.
I completely agree, we do have a tendency to “pick and choose”. With that in mind I spent some time last night looking for a viable alternate. I have not found one, but that does not mean it does not exist. I’ll keep looking.
My first alternate idea would be that this diagonal is leading, not ending. I would move the degree within minor wave 5 all down one degree. But that would make no difference to the next movement anyway; leading diagonals are normally followed by sharp deep corrections. In that idea it would be a second wave which may end about the upper aqua blue trend line, so the correction should still happen but it may not be as deep.
Ok thanks Lara. Good info. Let’s see what tomorrow brings. Everyone in the US, to include the mainstream media, is expecting a pullback in the market. However, this is what gives me pause about the main count.. When everyone is expecting a correction in the market, it rarely ever obliges them.
I don’t know about that. When I look at google business news for U.S. what I see on the first page is pretty much “happy” news; more growth expected ahead, and things like this:
“People are looking for reasons to really buy, but we’re optimistic that equities can continue to push higher,” said David Carter, chief investment officer of Lenox Wealth Advisors in New York.
It’s too early to tell yet if we have a high in place, but I wouldn’t be surprised of most of the talking heads on Wall St expect prices to keep going up. But then I don’t read that kind of news much, if ever, so thats only from a quick glance this morning.