
More upwards movement was not expected for the main wave count, but was for the alternate. Both wave counts remain valid at this stage.
Summary: This may be a very deep second wave correction. Tuesday’s price action should clarify which wave count is correct.
This analysis is published about 09:21 p.m. EST. Click on charts to enlarge.
The aqua blue trend lines are critical. Draw the first trend line from the low of 1,158.66 on 25th November, 2011 to the next swing low at 1,266.74 on 4th June, 2012. Create a parallel copy and place it on the low at 1,560.33 on 24th June, 2013. While price remains above the lower of these two aqua blue trend lines we must assume the trend remains upwards. This is the main reason for the bullish wave count being my main wave count.
Bullish Wave Count.
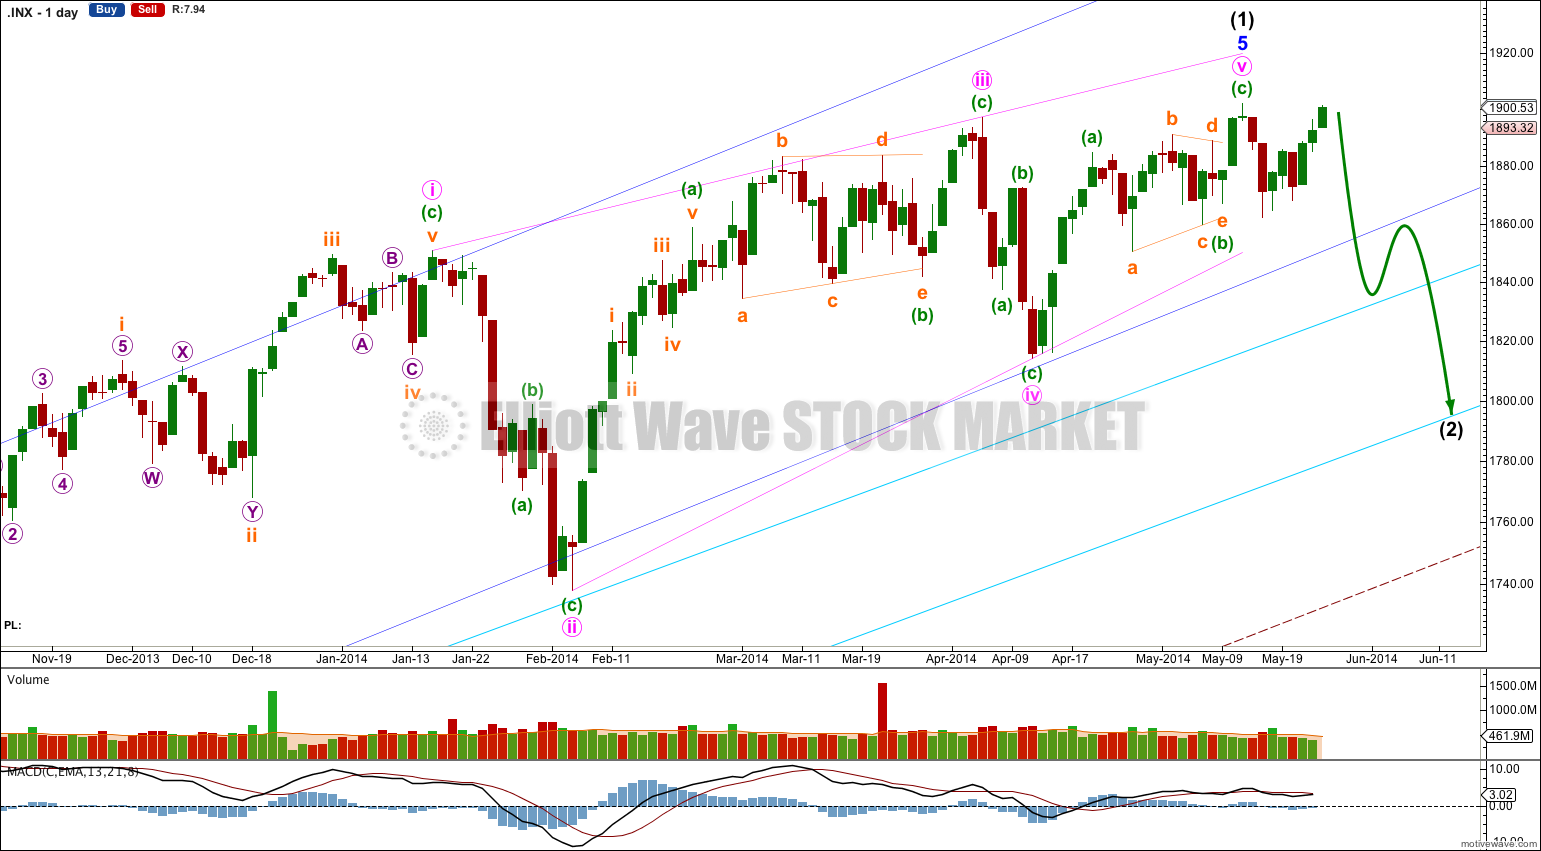
This bullish wave count expects a cycle degree correction was over at 666.79 for a fourth wave, and a new cycle degree bull market began there for a fifth wave. Within cycle wave V primary waves 1 and 2 are complete. Within primary wave 3 intermediate wave (1) is complete.
There are several possible structures that intermediate wave (2) can take. It is most likely to be a zigzag, but it may also be a flat, combination, double zigzag or double flat. It could also possibly be a triple, but that has an extremely low probability. It may not be a triangle.
If intermediate wave (2) is a flat correction or a combination then within it we may see a new high above 1,902.17. For this reason there is no upper invalidation point for this bullish wave count. A new high above 1,902.17 would eliminate the bearish scenario as described in this analysis below.
Intermediate wave (2) should last several weeks and may last about two or three months. It should be choppy and overlapping and it should find support at the lower aqua blue trend line. A breach of this trend line by more than 3% of market value would see this bullish wave count discarded in favour of the bearish wave count below.
Main Hourly Wave Count.
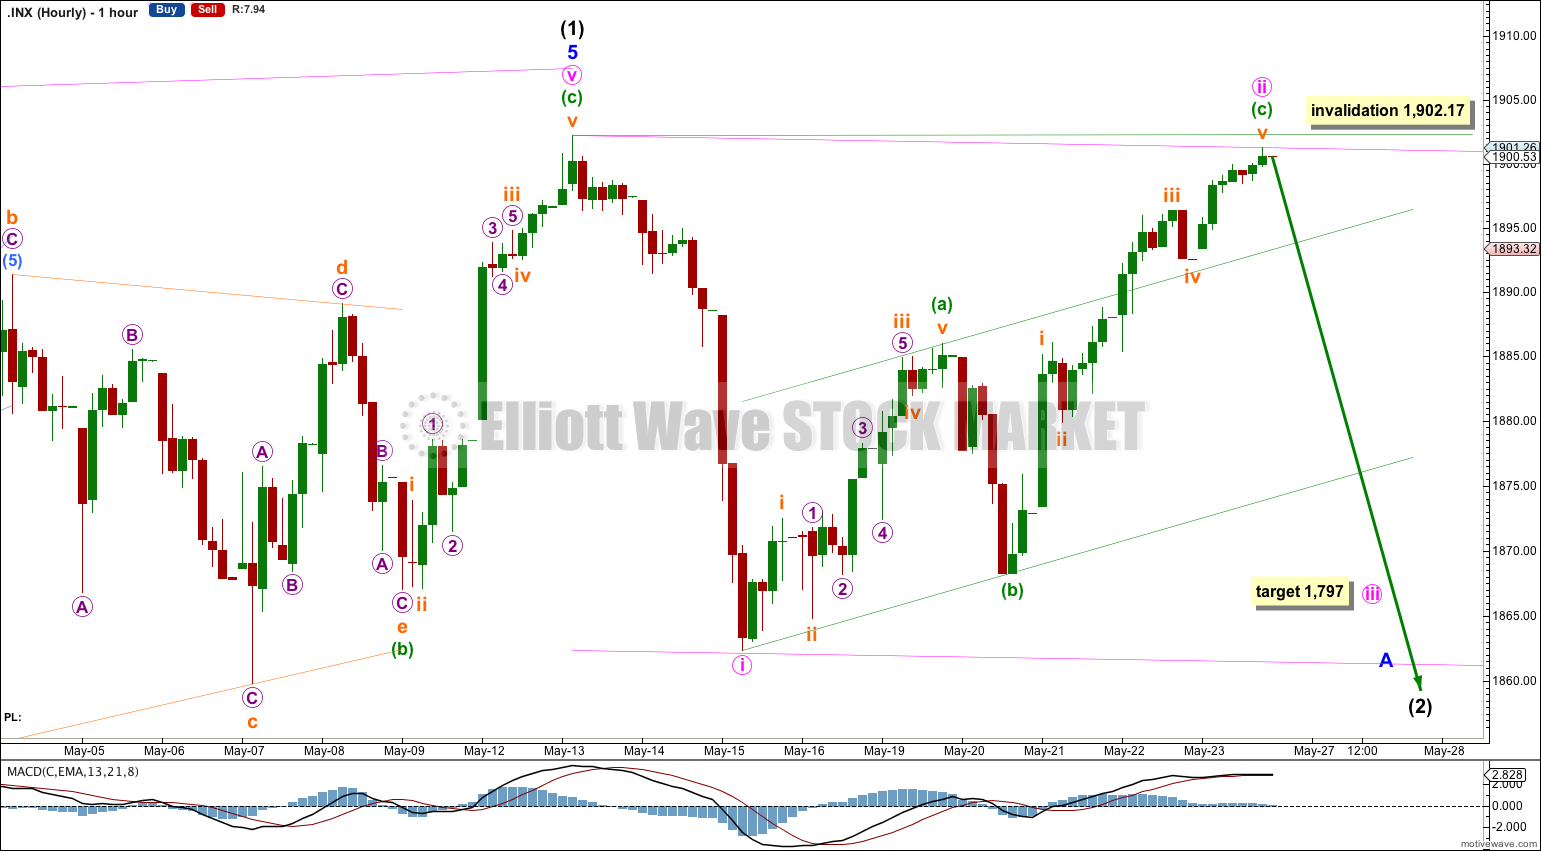
The upwards wave of minuette wave (c) looks like a clear five wave impulse. Minute wave ii may be a very deep zigzag. If this wave count is correct then minute wave ii must be over here. We must see downwards movement on Tuesday when markets open after Memorial Day.
There is no Fibonacci ratio between minuette waves (a) and (c).
Ratios within minuette wave (a) are: there is no Fibonacci ratio between subminuette waves i and iii, and subminuette wave v is 0.19 points longer than 0.382 the length of subminuette wave i.
Ratios within minuette wave (c) are: subminuette wave iii is 0.57 points short of equality in length with subminuette wave i, and subminuette wave v has no Fibonacci ratio to either of subminuette waves iii or i.
At 1,797 minute wave iii would reach 2.618 the length of minute wave i.
This main hourly wave count expects that intermediate wave (2) will unfold as a zigzag, and within the zigzag minor wave A will be an impulse. This is the most likely structure for intermediate wave (2), but it is not the only possibility.
I still want to see the green channel about minute wave ii clearly breached before I have any confidence that this second wave correction is over and the next wave down, a third wave, has begun.
Minute wave ii may not move beyond the start of minute wave i at 1,902.17.
Alternate Hourly Wave Count.
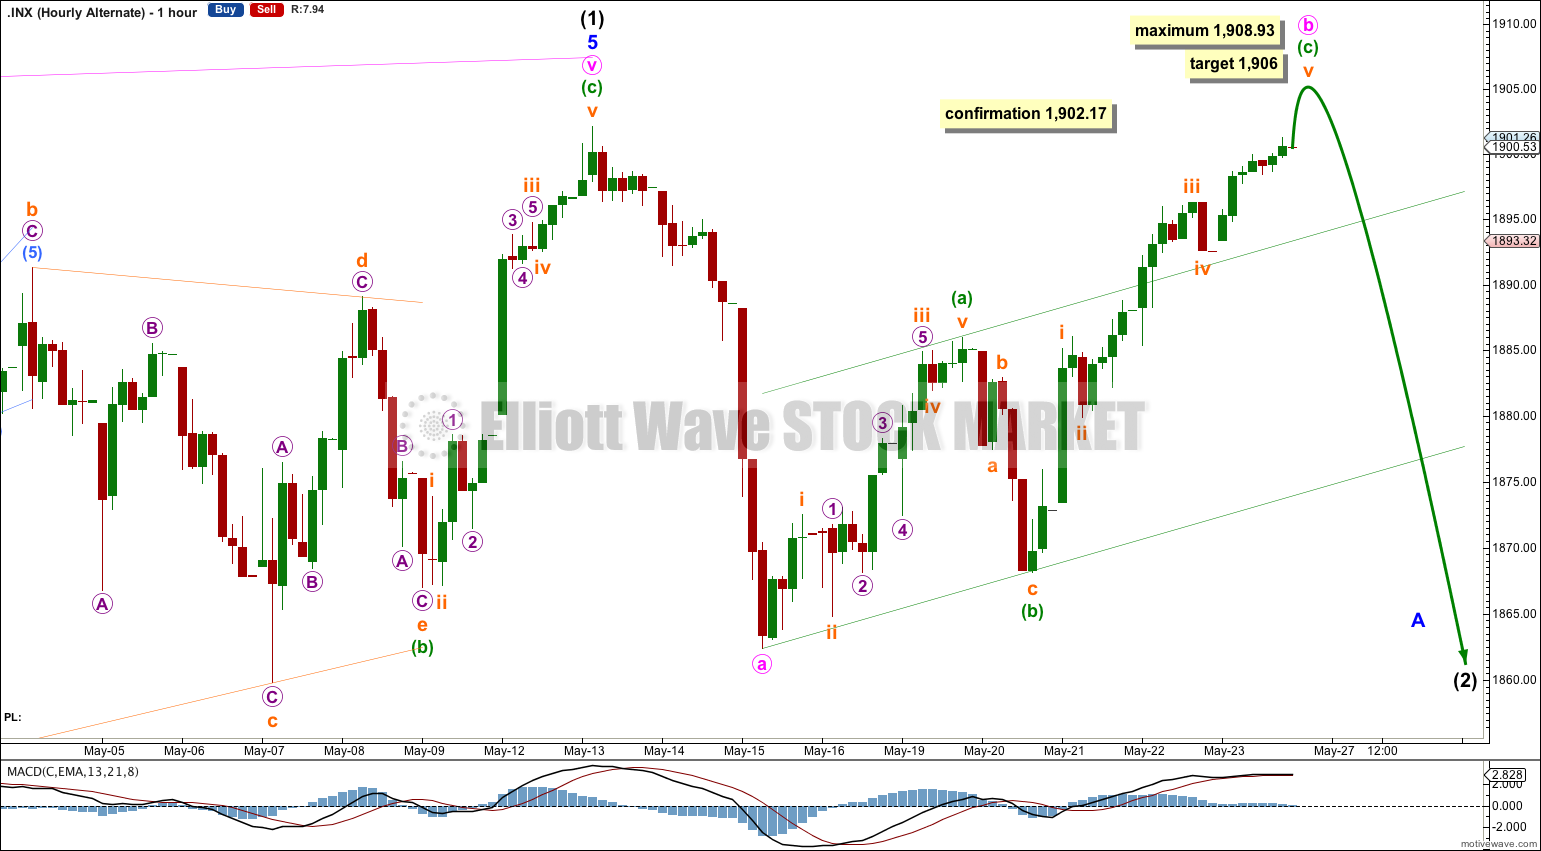
If we see a new high above 1,902.17 on Tuesday this shall be the wave count I will use.
There are several structural possibilities for intermediate wave (2). This alternate looks at the possibility of a three as an expanded flat down to begin.
If intermediate wave (2) is a flat correction or combination including a flat then minor wave A must subdivide as a three wave structure. If minor wave A is a flat correction then within it minute wave b may make a new price extreme beyond the start of minute wave a above 1,902.17. Minute wave b upwards must be a three wave structure.
Minute wave b may be an almost complete zigzag. At 1,906 minuette wave (c) would reach 1.618 the length of minuette wave (a).
Within minuette wave (c) subminuette wave iii is slightly shorter than subminuette wave i. This limits subminuette wave v to no longer than equality with subminuette wave iii because a third wave may never be the shortest. This limit is at 1,908.93. This limit assumes my labeling within minuette wave (c) is correct.
Overall this alternate also expects more downwards movement to eventually find support at the lower aqua blue trend line, but it allows for more choppy overlapping and a new high on the way down.
This alternate wave count works for the bullish wave count, but does not work for the bearish wave count below.
Bearish Alternate Wave Count.
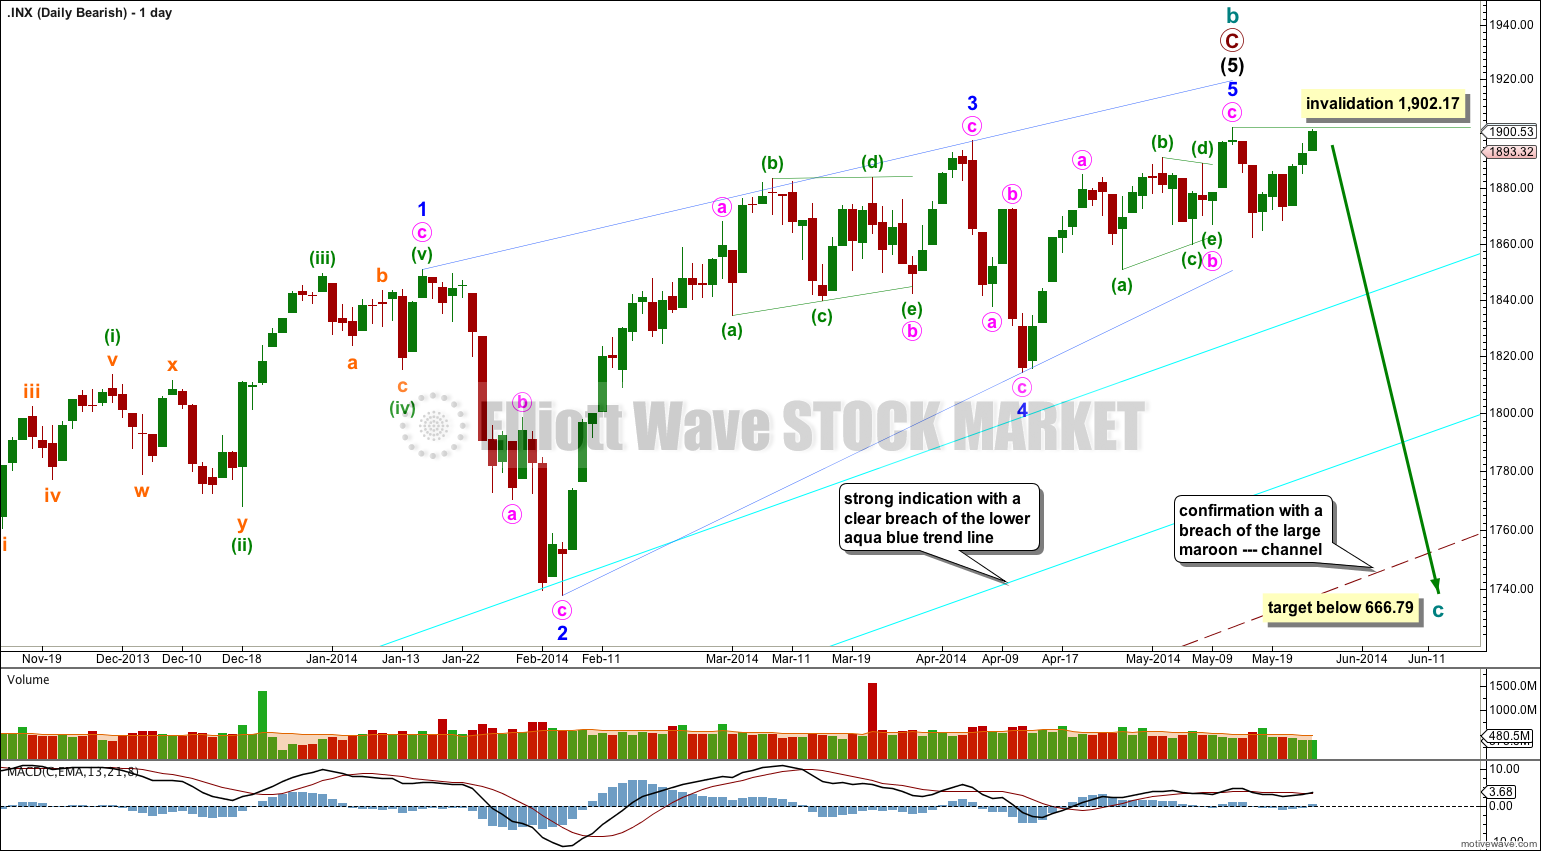
This bearish alternate wave count expects that the correction is not over. The flat correction which ended at 666.79 was only cycle wave a of a larger super cycle second wave correction.
Cycle wave b is now a 143% correction of cycle wave a, just a little longer than the maximum common length of 138% for a B wave of a flat correction.
Cycle wave b is now a complete zigzag structure.
A clear breach of the large maroon – – – channel on the monthly and weekly charts is required for confirmation of this wave count. If that happens then this would be my main wave count and would be strongly favoured. Only once this wave count is confirmed will I calculate downwards targets for cycle wave c for you; it would be premature to do that prior to confirmation.
Within cycle wave c no second wave correction may move beyond the start of its first wave above 1,902.17.
Cycle wave c should move substantially below the end of cycle wave a below 666.79.
Cycle degree waves should last between one and several years. Usually about 7 years or so, and extended waves are longer in duration.
So far this one has lasted nearly 5 years and its not yet halfway done. This looks about right for a cycle degree wave.
I would expect primary wave 3 is extending and so should be much longer in duration than primary wave 1 which was just 26 months. So far primary wave 3 has lasted 34 months, and thats just its first wave. So it may last at least another 6 years in total.
Hi Lara,
I have a question around the duration of cycle degree V under your bullish wave count. Based on where we are within this count, can you provide an estimate of how long primary degree 3 could last? How about cycle degree V?
Thank you,
Rick