
Price moved slightly higher which fits the wave count. The structure is still incomplete.
Summary: Upwards movement should continue for another three days or so. The target is 1,921.
This analysis is published about 08:40 p.m. EST. Click on charts to enlarge.
Bullish Wave Count.
The aqua blue trend lines are critical for all wave counts. Draw the first trend line from the low of 1,158.66 on 25th November, 2011 to the next swing low at 1,266.74 on 4th June, 2012. Create a parallel copy and place it on the low at 1,560.33 on 24th June, 2013. While price remains above the lower of these two aqua blue trend lines we must assume the trend remains upwards. This is the main reason for the bullish wave count being my main wave count.
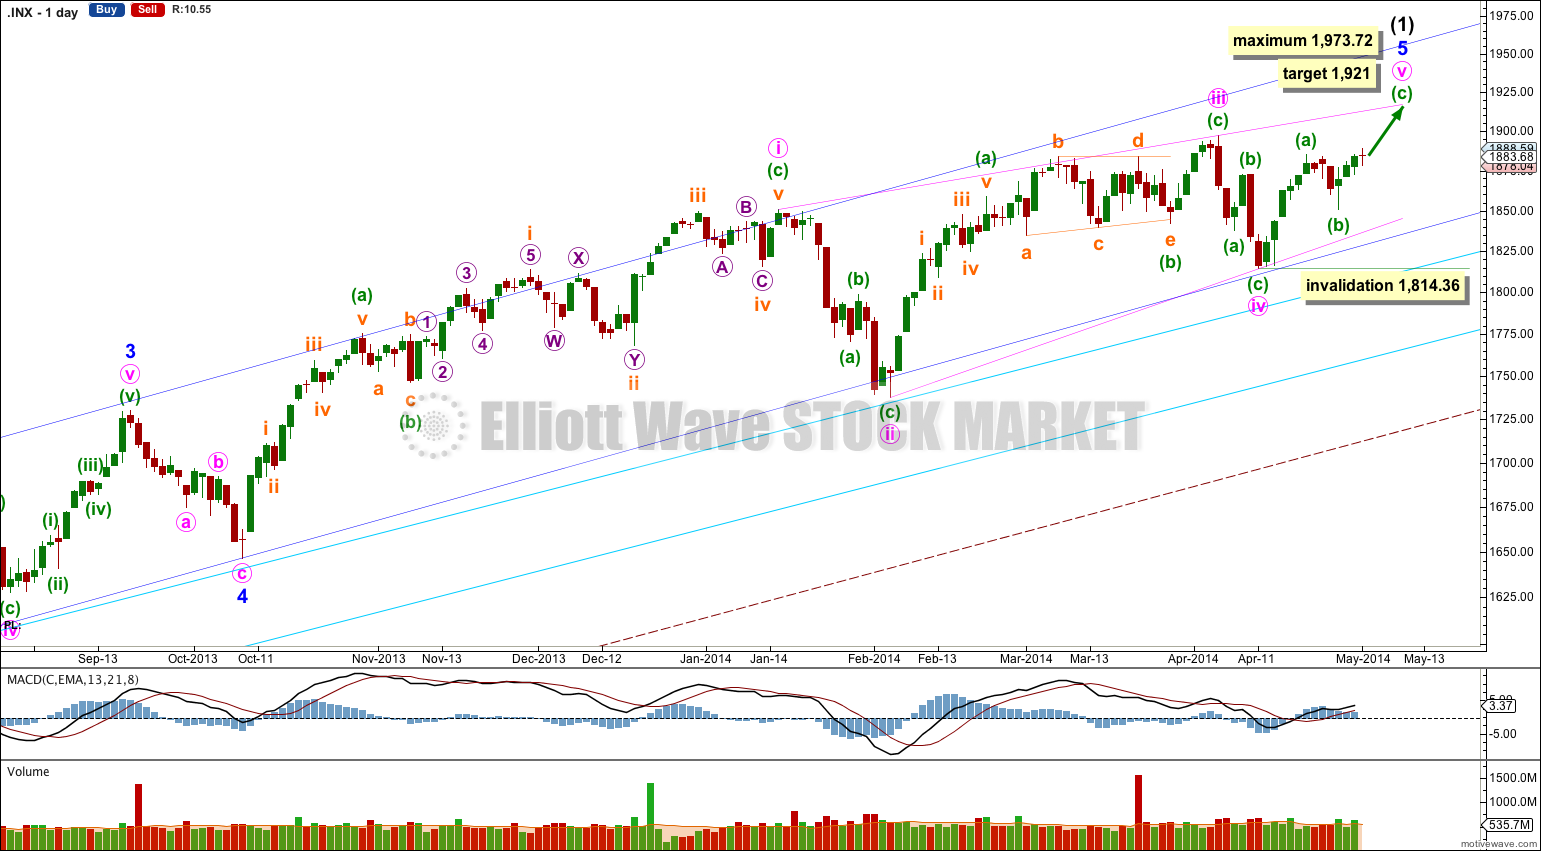
This bullish wave count expects a new bull market began at 666.79 for a cycle wave V. Within cycle wave V primary waves 1 and 2 are complete. Within primary wave 3 intermediate wave (1) is incomplete.
Within intermediate wave (1) the final fifth wave of minor wave 5 is an almost complete ending contracting diagonal. Although minute waves ii and iv within the diagonal are shallower than normal, all the subdivisions fit perfectly. The diagonal is contracting and the final fifth wave may not be longer than equality with the third at 1,973.72.
Within an ending diagonal all the subwaves may only subdivide as single zigzags. The fourth wave should overlap back into first wave price territory. Within the zigzag of minute wave v minuette wave (c) would reach equality in length with minuette wave (a) at 1,921. Minute wave v should end when price comes to touch the upper 1-3 trend line of the diagonal.
Minuette wave a lasted six days and minuette wave b lasted four days. If minuette wave c is equal in duration to minuette wave a it will end in another three days.
Within the zigzag of minute wave v minuette wave (b) may not move beyond the start of minuette wave (a) at 1,814.36.
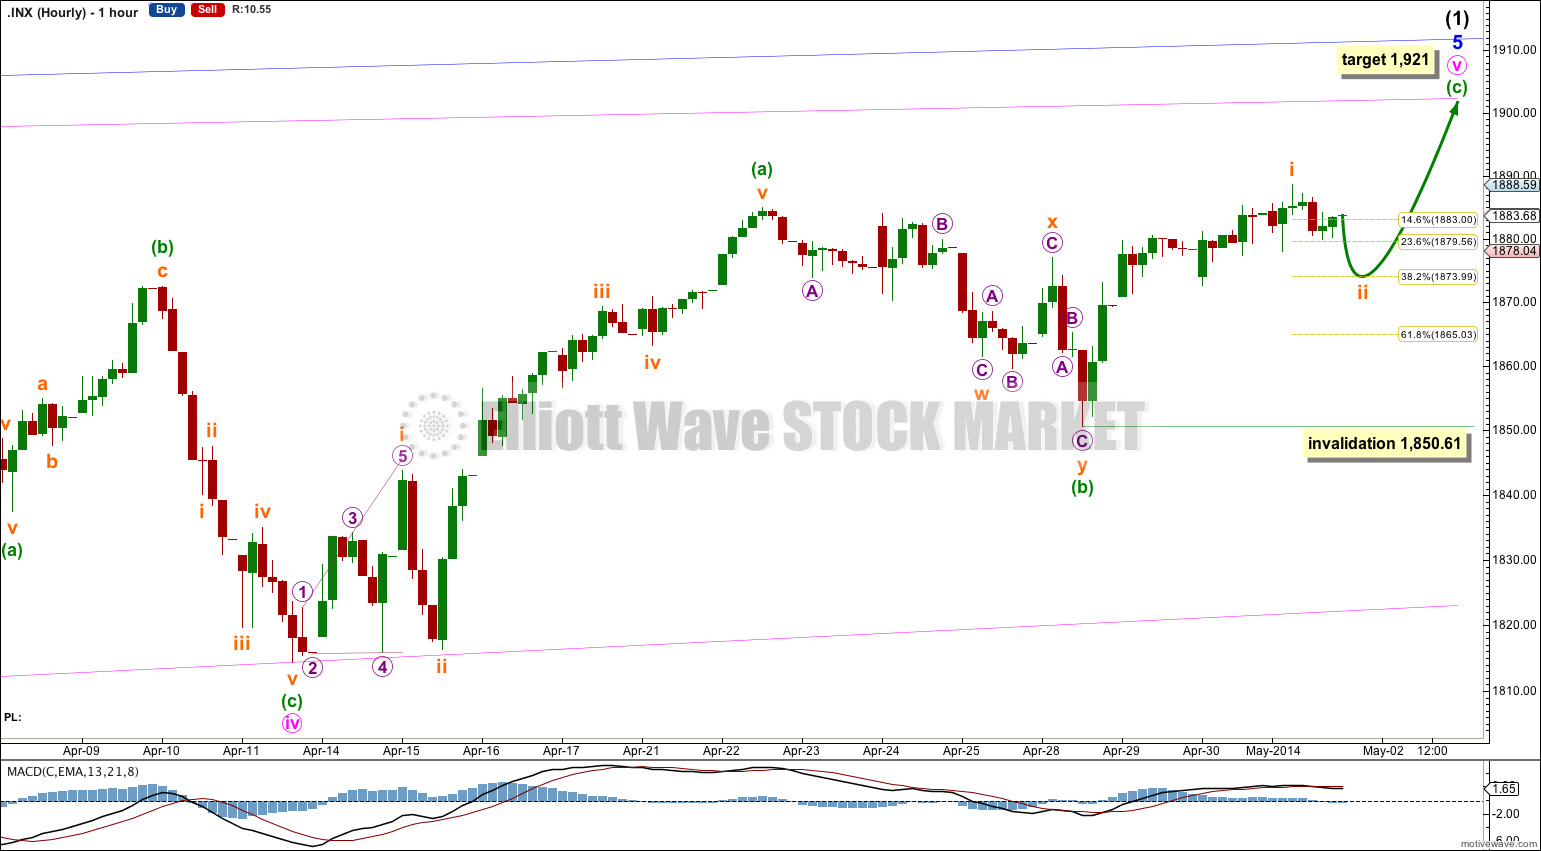
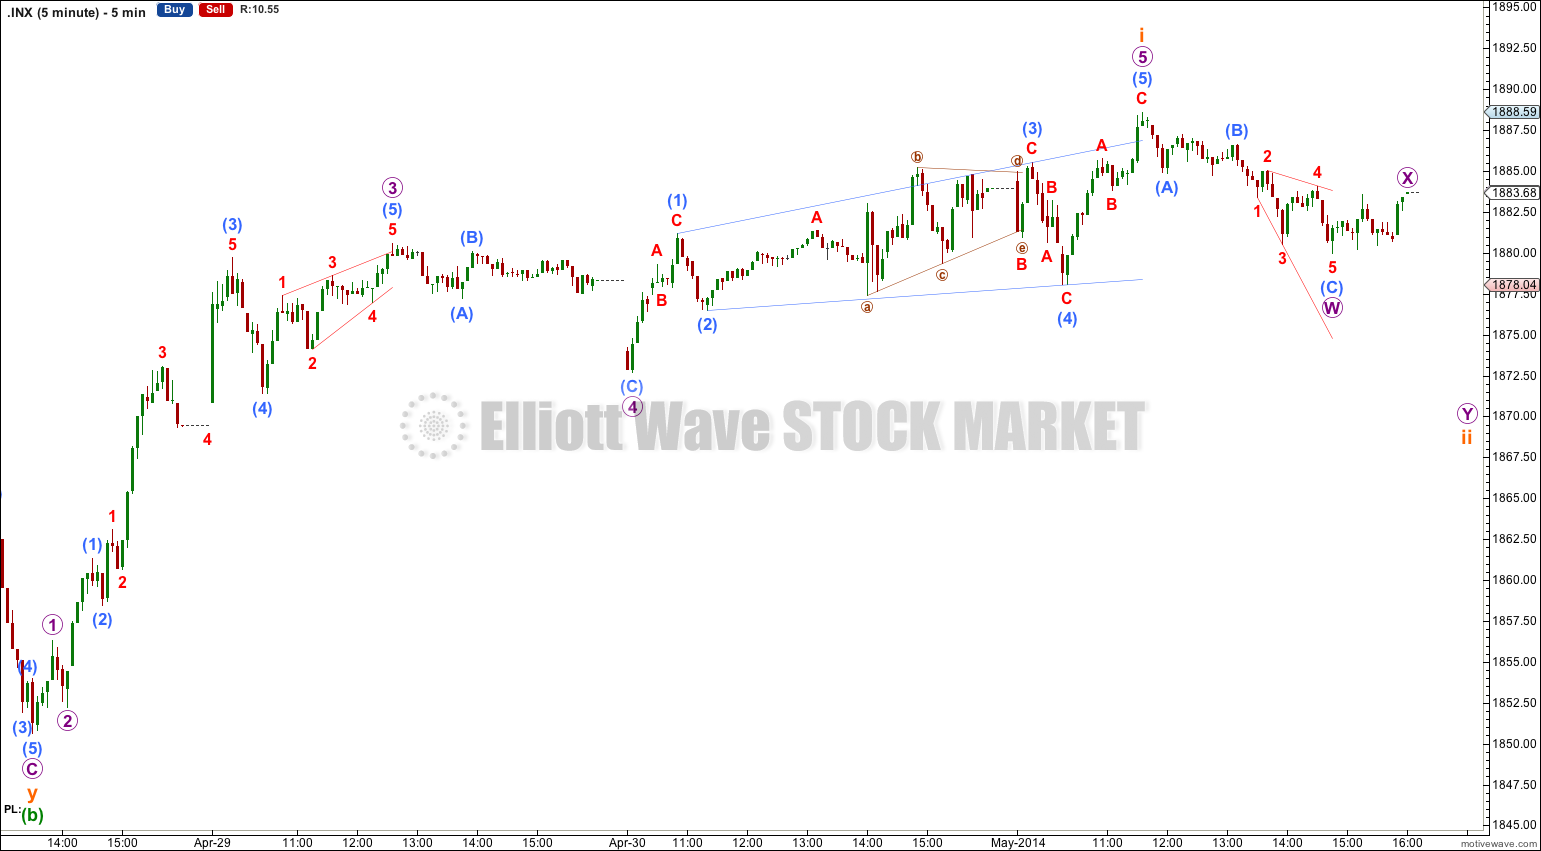
The small red doji candlestick for Thursday’s session on the daily chart indicates a correction. It is likely that subminuette wave ii has arrived. On the five minute chart the structure looks most likely to be incomplete, so I would expect it to move a little lower to begin tomorrow’s session.
Thereafter, we should see an increase in upwards momentum for a third wave.
Subminuette wave ii may not move beyond the start of subminuette wave i below 1,850.61.
Bearish Alternate Wave Count.
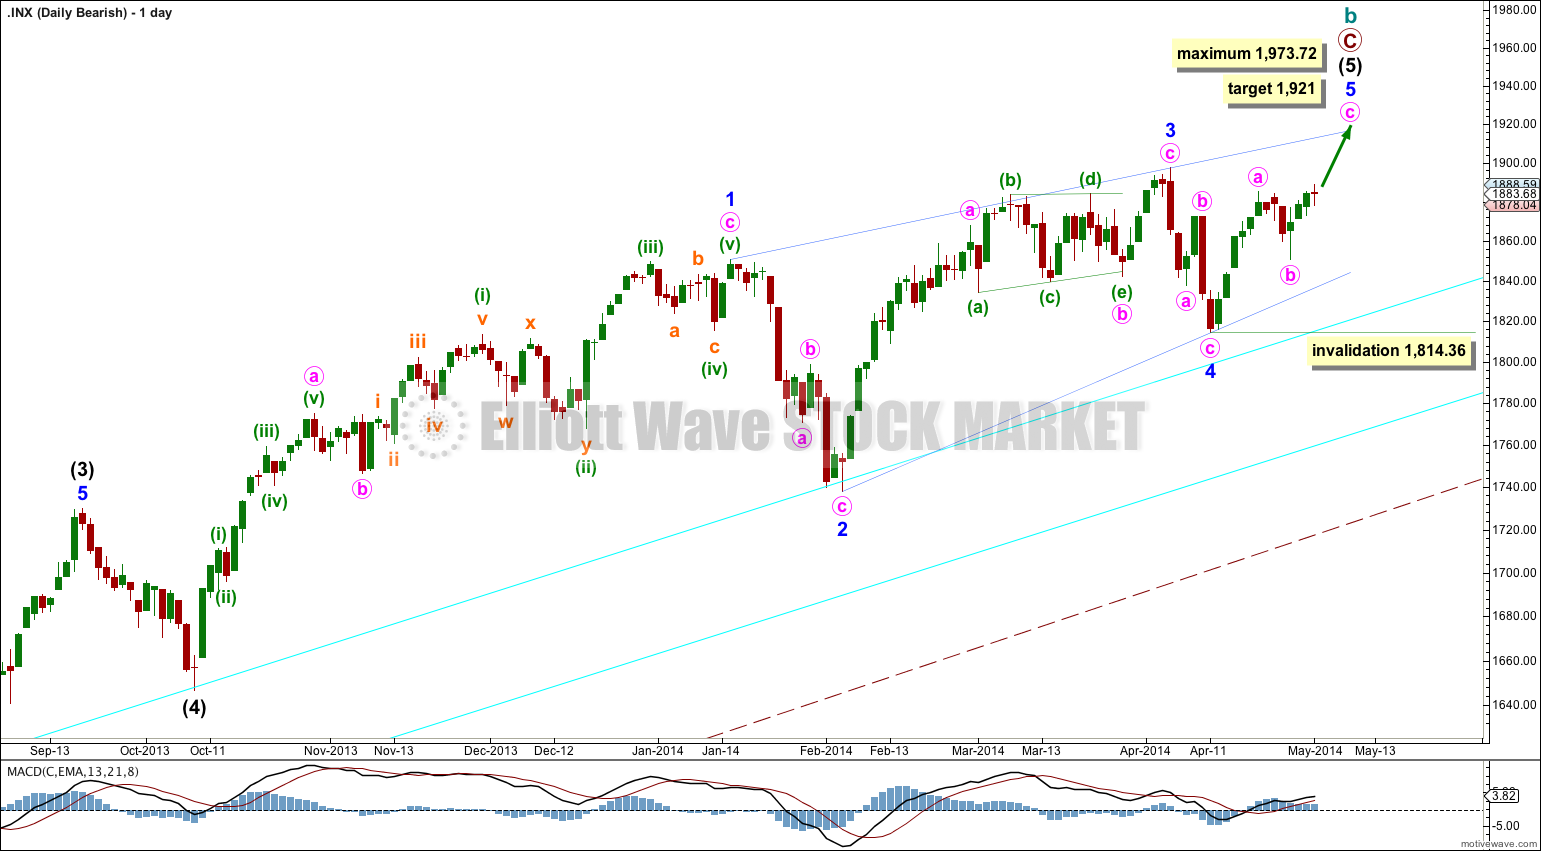
This bearish wave count expects that the correction was not over at 666.79, and that may have been just cycle wave a of a huge expanded flat for a super cycle wave II. Cycle wave b upwards is a close to complete zigzag.
Within flat corrections the maximum common length of B waves in relation to A waves is 138%. So far cycle wave b is a 141% correction of cycle wave a. For this reason only this wave count is an alternate.
Within primary wave C the subdivisions are seen here in exactly the same way as the main wave count, both are seen as incomplete five wave impulses with the final fifth wave an almost complete ending contracting diagonal. This bearish wave count would expect a cycle degree trend change to come in about three days.
Alternatively, it is possible that primary wave C is not close to completion. There are several ways to see the many subdivisions within this long movement. The depth of the next downwards correction will tell us what degree the trend change may be: if downwards movement breaches the lower of the two aqua blue trend lines by more than 3% of market value then I would consider a trend change at cycle degree, and if downwards movement breaches the lower edge of the wider maroon – – – channel on the monthly chart then a cycle degree trend change would be confirmed.
Hello Lara,
Could your old wave count still be correct on daily chart ?
It shows Wave A as 3 wave and wave B as 3 wave structure and we need 5 wave down. Was looking at old corrections on SPX and they usually form pretty good waves on daily chart.
Thanks
Aseem
Not as you have it labeled there though, because the prior wave up is also a three. For your idea the prior wave up would have to be a fifth wave, which should subdivide as a five not a three. And it does not fit as the final wave of an ending diagonal because the movement prior to it does not fit as a diagonal which would have ended there.
In short – you have to see how your idea fits into the bigger picture, movement before it. You can’t just look at a small part of the picture.