
Upwards movement fits the alternate hourly wave count perfectly. I have adjusted the main hourly wave count to a new idea, and I have a new alternate daily wave count for you which allows for a new high above 1,897.28.
Summary: The two first hourly wave counts expect a third wave down next week. A new low below 1,814.36 would confirm a third wave down is underway, and would also confirm a minor degree downwards trend is in place.
This analysis is published about 11:55 p.m. EST. Click on charts to enlarge.
Bullish Wave Count.
The aqua blue trend lines are critical for all wave counts. Draw the first trend line from the low of 1,158.66 on 25th November, 2011 to the next swing low at 1,266.74 on 4th June, 2012. Create a parallel copy and place it on the low at 1,560.33 on 24th June, 2013. While price remains above the lower of these two aqua blue trend lines we must assume the trend remains upwards. This is the main reason for the bullish wave count being my main wave count.
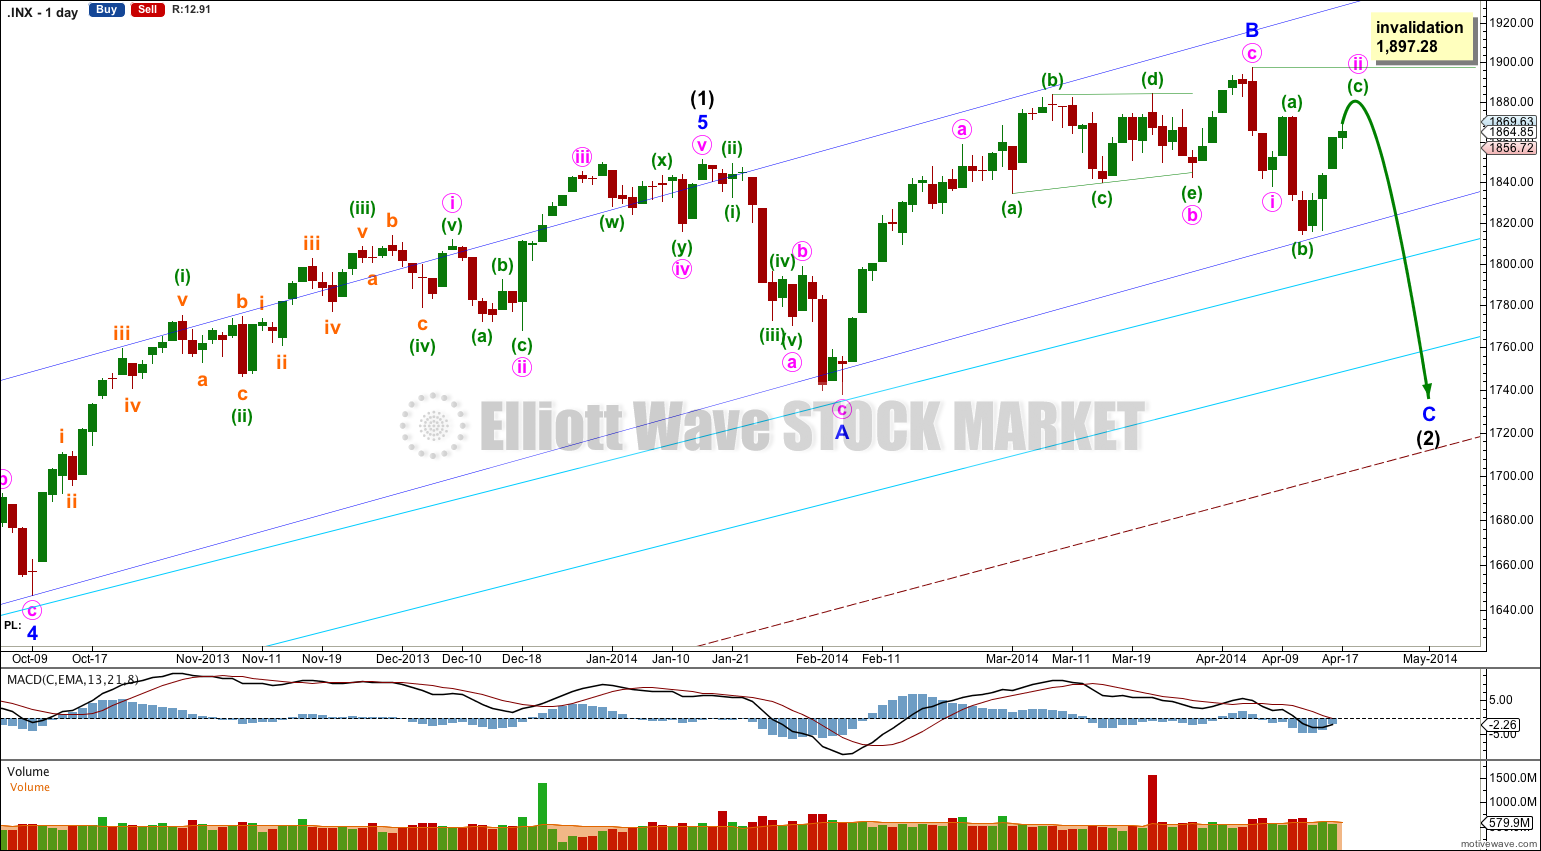
This bullish wave count expects a new bull market began at 666.79 for a cycle wave V. Within cycle wave V primary waves 1 and 2 are complete. Within primary wave 3 intermediate wave (1) is complete at 1,850.84.
Intermediate wave (2) should find some support about the lower of the two aqua blue trend lines.
Intermediate wave (2) is most likely an expanded flat. Downwards movement for minor wave C is highly likely to make a new low below the end of minor wave A at 1,737.92 to avoid a truncation and a rare running flat. This would see the lower of the double aqua blue trend lines breached by an overshoot. In this instance I will apply the classic technical analysis guideline of allowing for a breach of up to 3% of market value (56.92 points). If downwards movement continues beyond this point the wave count would be in doubt and a huge trend change would be indicated.
There is some precedent for a small breach of the lower aqua blue trend line: in November 2012 it was breached by 1.5% of market value. Small overshoots like this can happen.
I do not have a target for minor wave C downwards for you. If it were to reach 1.618 the length of minor wave A then downwards movement would breach the lower aqua blue trend line by more than 3%. If this wave count is correct then that should not happen. We may not see a ratio between minor waves A and C, which is not unusual for the S&P.
When I know where minute waves iii and iv within minor wave C have ended then I will use the ratios within minor wave C between minute waves i, iii and v to calculate a target for it to end. I will only be able to do this for you towards the end of next week or early the following week.
Minor wave A lasted 14 sessions and minor wave B lasted 41 sessions. If minor wave C lasts about three to five weeks it would be in proportion and the wave count would have the “right look”.
For this bullish wave count when intermediate wave (2) is complete then very strong sustained upwards movement would be expected as an intermediate degree third wave within a primary degree third wave upwards unfolds.
Main Hourly Wave Count.
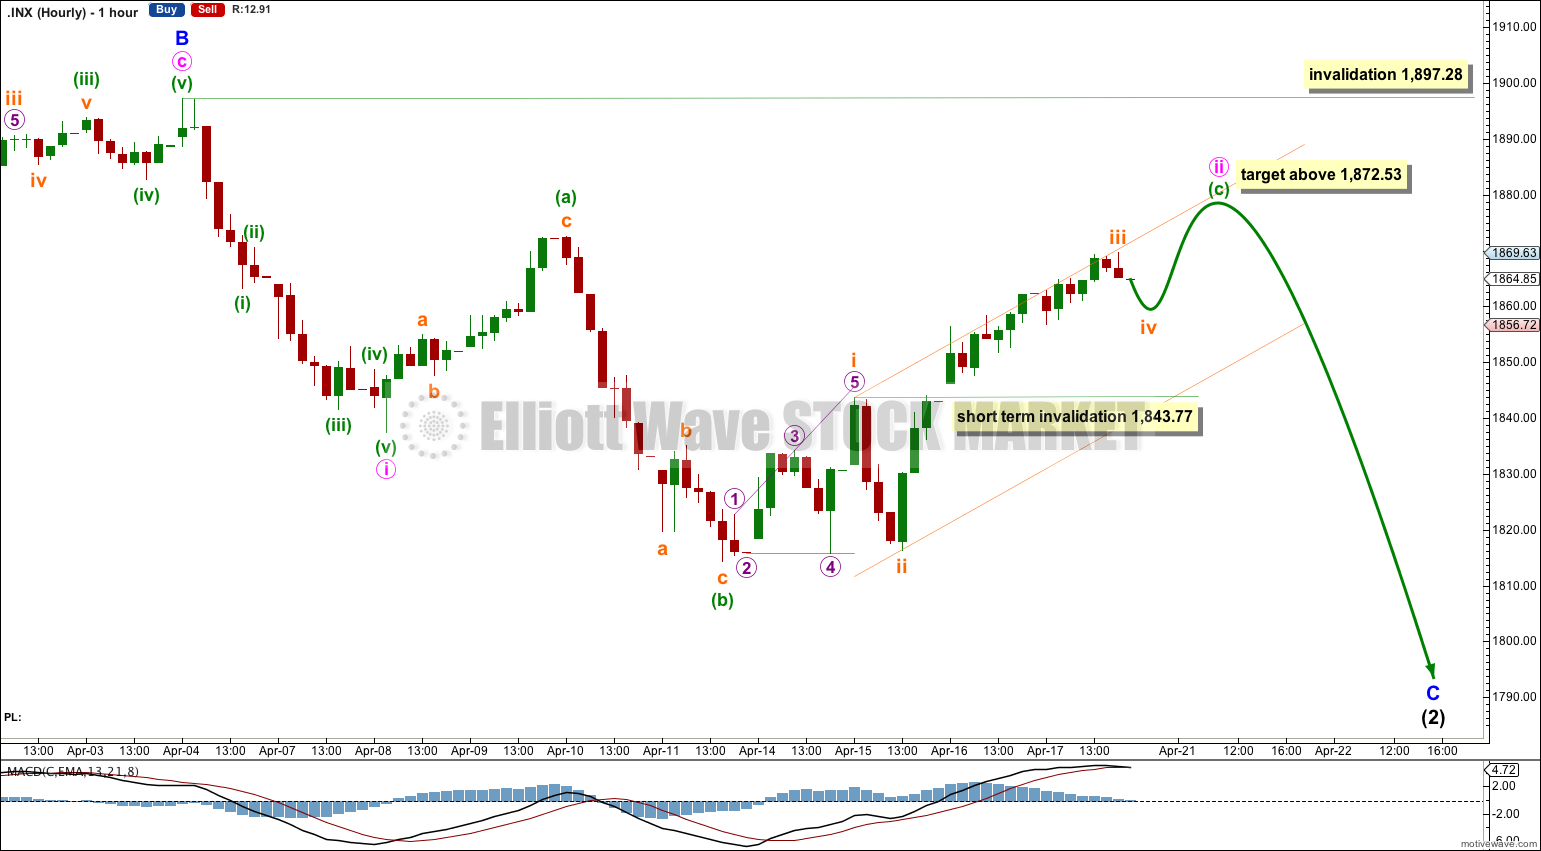
I have today adjusted this main hourly wave count to see this upwards movement as minute wave ii, an incomplete expanded flat correction.
This main hourly wave count still sees minor wave C downwards as an impulse.
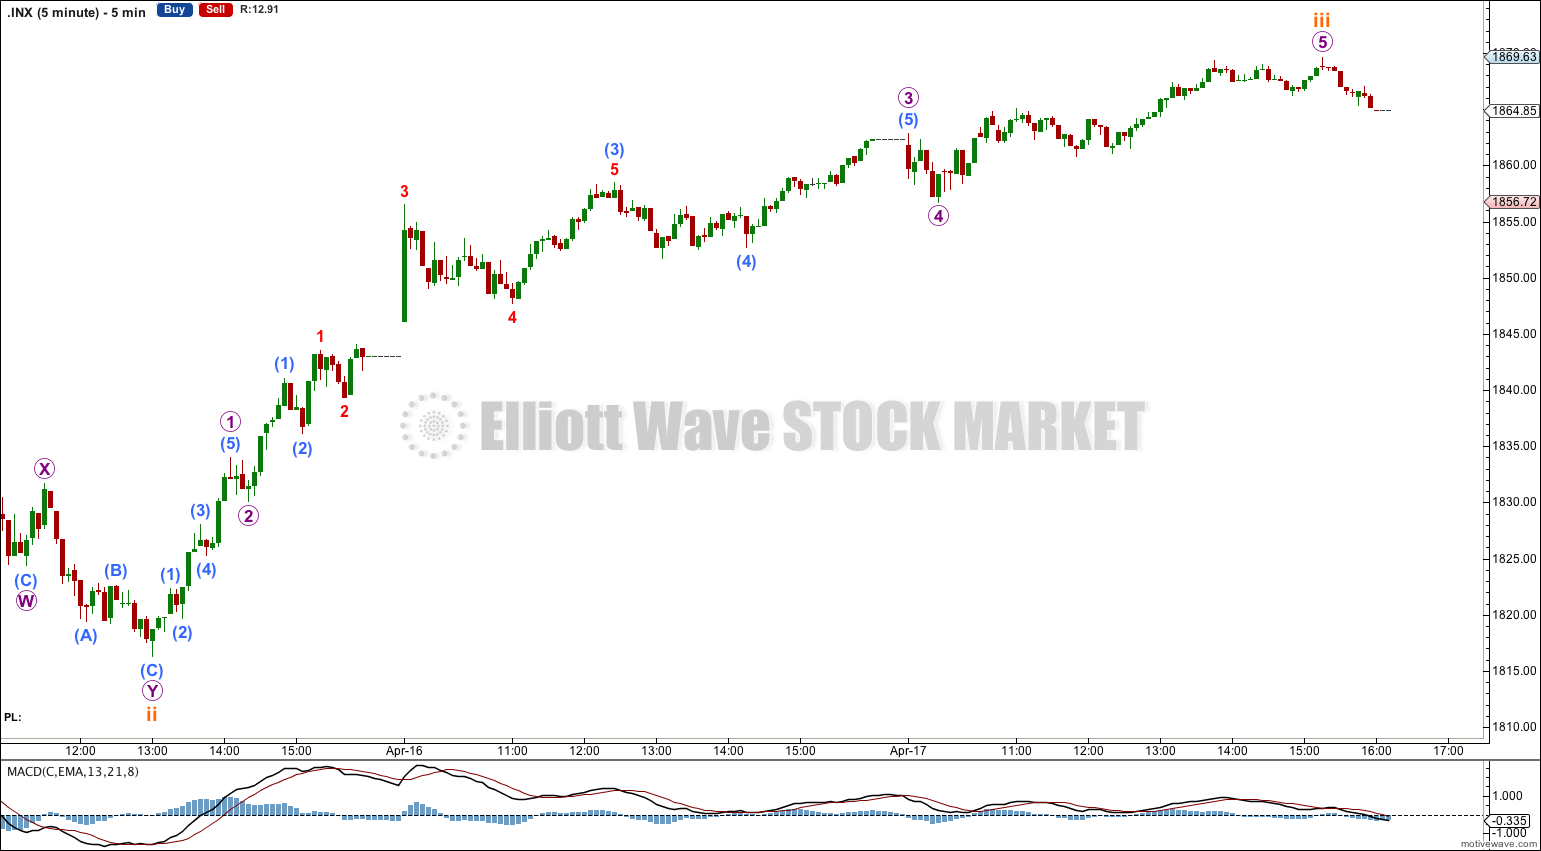
This has a better fit with the downwards wave labeled minuette wave (b); this fits best on the hourly and five minute charts as a three wave zigzag.
Minuette wave (b) is a 166% correction of minuette wave (a). It is extremely likely that minuette wave (c) would move beyond the end of minuette wave (a) at 1,872.53 to avoid a rare running flat. In fact, because minuette wave (b) is so deep in relation to minuette wave (a) I would rule out a running flat. I have never seen a B wave within a rare running flat which is over 105% the length of the A wave. If price does not move above 1,872.53 I would discard this wave count.
When minute wave ii is a complete structure then I could calculate a target down for minute wave iii. I cannot do that yet.
Within minute wave ii minuette wave (c) is incomplete. Subminuette wave i is a perfect leading expanding diagonal, and subminuette wave ii to follow it is typically very deep. There is no Fibonacci ratio between subminuette waves iii and i. Subminuette wave iv should move price sideways in a shallow correction. It may not move back down into subminuette wave i price territory below 1,843.77.
I have drawn a channel about minuette wave (c) using Elliott’s first technique: draw the first trend line from the highs of subminuette waves i to iii, then place a parallel copy upon the low of subminuette wave ii. I would expect subminuette wave iv to find support at the lower edge of this channel (if it gets that far) and subminuette wave v may end about the upper trend line. When this channel is clearly breached by subsequent downwards movement (after a high above 1,872.53) then we would have confirmation that minute wave ii is over and minute wave iii has begun.
Minute wave ii may not move beyond the start of minute wave i. This wave count is invalidated with movement above 1,897.28.
Alternate Hourly Wave Count.
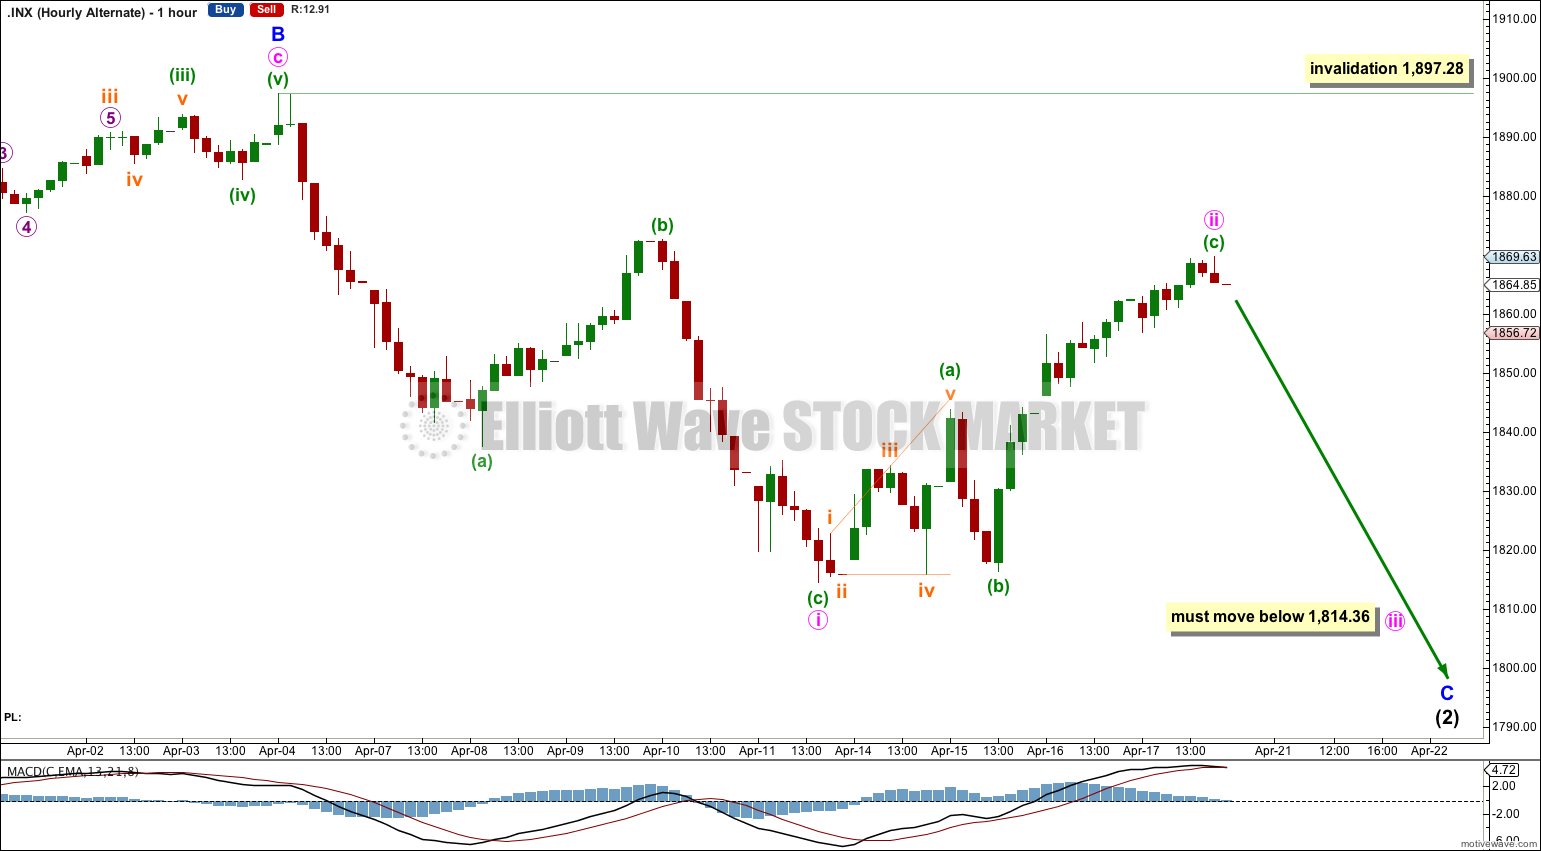
The other possible structure for minor wave C downwards is an ending diagonal.
Within an ending diagonal all the sub waves must subdivide as single zigzags. This fits for minute wave i downwards, although within it minuette wave (c) does not fit as well as a five wave structure.
Minute wave ii may be complete as a 67% correction of minute wave i. This is within the common length for second and fourth waves within diagonals as between 66% to 81%. However, there is not enough downwards movement at the end of Thursday’s session to show a trend change. Minute wave ii may yet move higher. If it does it would most likely end before 1,882 where it would be 81% of minute wave i.
Minute wave ii may not move beyond the start of minute wave i above 1,897.28.
When minute wave ii is complete then minute wave iii downwards must subdivide as a single zigzag and must move beyond the end of minute wave i below 1,814.36.
The diagonal must be expanding in order for minor wave C to reach below the end of minor wave A at 1,737.92. This would require minute wave iii to be longer than 59.79 points, the length of minute wave i.
Daily Alternate Wave Count.
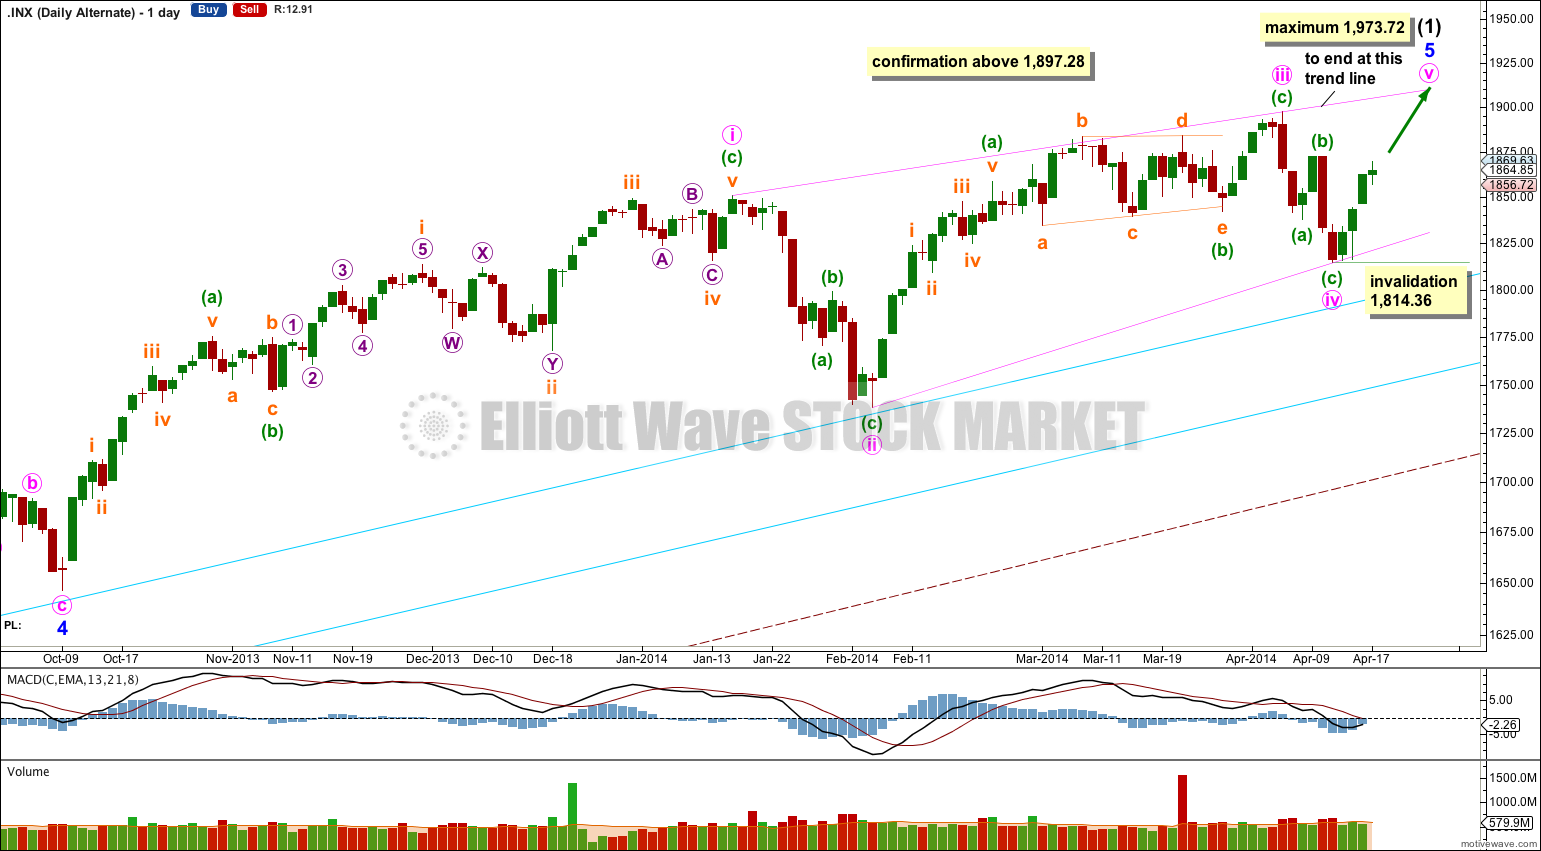
This alternate wave count is based upon an idea sent in by a member. It is possible that intermediate wave (1) is not over and that within it minor wave 5 is unfolding as an ending contracting diagonal.
Within an ending diagonal all the subwaves may only subdivide as single zigzags.
The diagonal is contracting because minute wave iii is shorter than minute wave i, and minute wave iv is shorter than minute wave ii. The trend lines converge.
Minute wave ii was 55% correction of minute wave i, and minute wave iv was a 52% correction of minute wave iii. Both of these corrections are less than the common length for second and fourth waves within diagonals of between 66% to 81%. This reduces the probability of this alternate wave count, it gives the possible diagonal an atypical look.
This wave count would be confirmed with movement above 1,897.28. If the last upwards wave for minute wave v subdivides clearly as a single zigzag then this would be my only wave count.
Because the diagonal is contracting, and because minute wave iii is shorter than minute wave i, minute wave v may not be longer than equality with minute wave iii. This maximum limit is at 1,973.72.
Minute wave v would most likely end at the upper 1-3 trend line of the diagonal.
Bearish Alternate Wave Count.
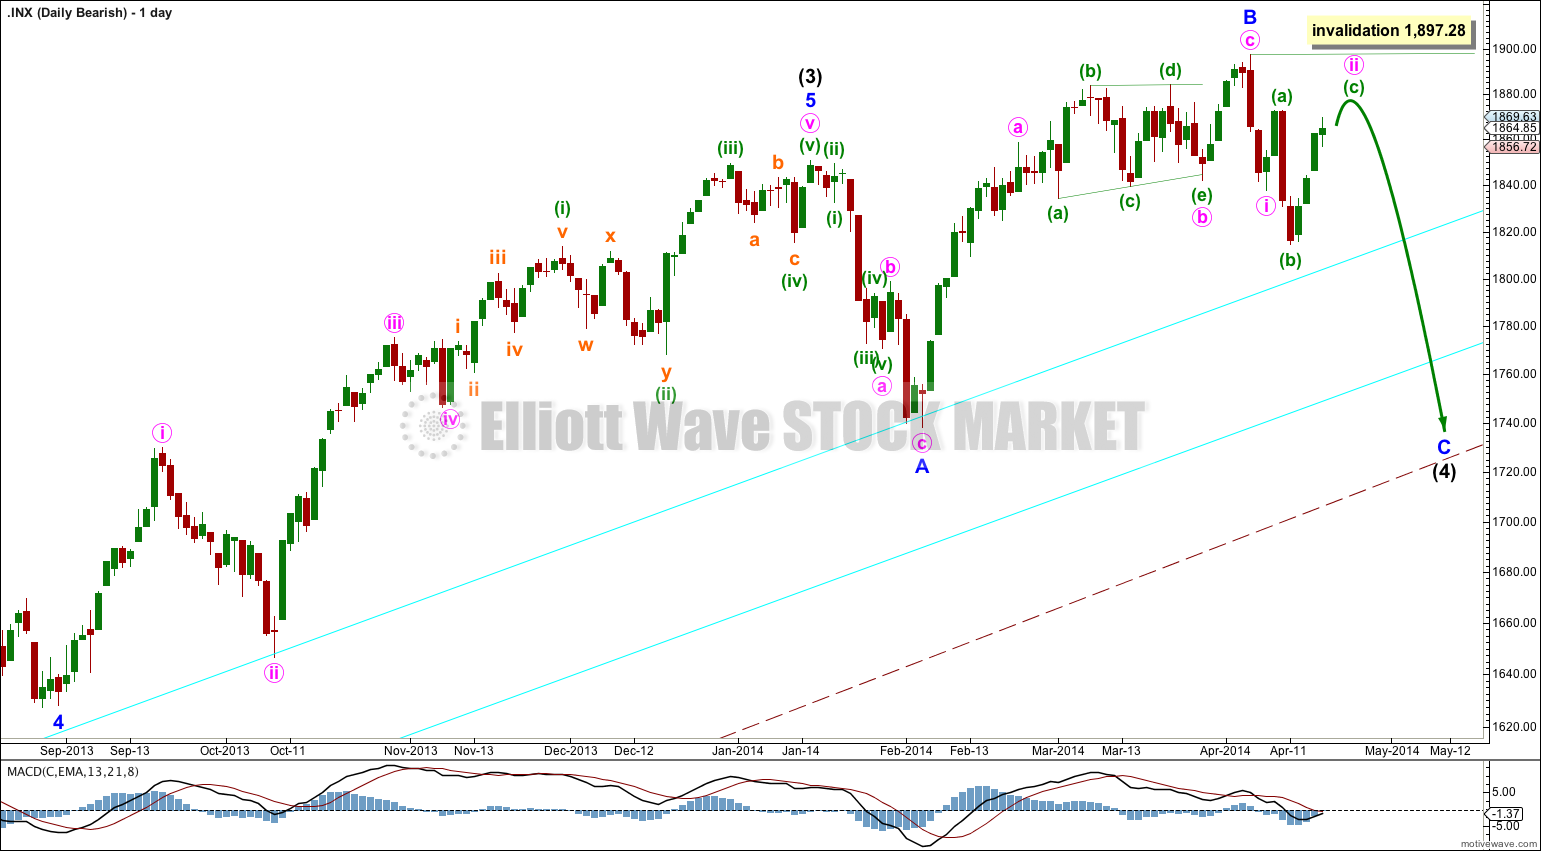
This bearish wave count expects that the correction was not over at 666.79, and that may have been just cycle wave a of a huge expanded flat for a super cycle wave II. Cycle wave b upwards is a close to complete zigzag.
Within flat corrections the maximum common length of B waves in relation to A waves is 138%. So far cycle wave b is a 141% correction of cycle wave a. For this reason only this wave count is an alternate.
Within primary wave C of the zigzag intermediate wave (4) would be incomplete.
The subdivisions for intermediate wave (4) would be the same as the main wave count for intermediate wave (2). I would expect it to end at the lower aqua blue trend line.
At 2,190 primary wave C would reach 1.618 the length of primary wave A. When intermediate wave (4) is complete I would recalculate this target at intermediate degree. I have found Fibonacci ratios between actionary waves (1, 3 and 5) of impulses are more reliable than between A and C waves within zigzags for the S&P500.
If intermediate wave (5) lasts about five to six months it may end about October this year.
Hi all, I am a new member, and I am mainly interested in the longer term picture. In the Bullish Wave Count scenario, when intermediate wave 2 of primary wave 3 would bottom out soon in the 1,750 region, what would be the target for wave 3 of 3 then? Intermediate wave 1 may start around 1074.
Could I count 1.618 * intermediate wave 1 + wave 2 = 1.618 * (1,850.84 – 1074) + 1,750 = 1,257 + 1,750 = 3,007 as a target of wave 3 of 3?
In case, this Bullish Wave Count scenario evolves, what would be your time hoizon for wave 3 of 3?
You could try to do that calculation, yes. But it suffers from a big problem. You don’t know yet where intermediate wave (3) begins, because intermediate wave (2) is incomplete. Thus your calculation is part guesswork.
I would rather wait until I know where intermediate wave (3) begins before trying to calculate a target for it to end.
What I can say about it from the monthly chart though is this: it absolutely must show an increase in upwards momentum beyond that seen for intermediate wave (1), and it absolutely must breach the upper edge of the wide maroon — channel which is a base channel about primary waves 1 and 2.
If upwards movement does not breach that base channel then the bullish wave count would be highly suspect. The probability of it would reduce significantly.
Hi Lara, thanks a lot for your reply.
Thanks Lara! IMO, all 3 counts have slight problems and have an atypical look. However, I do think 1 or 3 has a better probability and will pan out. They both suggest a 5 wave structure will complete early next week which will actually keep all 3 validated.
Enjoy the long weekend!
Hi Lara,
What’s the probability of Bullish Alternate reaching 1973 level out of all wave counts?
Thx
Hi Lara,
Also $BPSPX still not at 50MA which is 71 , it’s still hanging @ 66 . Unless
it crosses 71 , recent high is fake OPEX correction sort of.
That’s my thought on some technicals.
Thx
Overall I do not think that possible diagonal has a very typical look. I would judge the daily alternate wave count to have the lowest probability.
I am basing this judgement on the depth of the second and fourth waves within the diagonal; at only 55% and 52% they are rather shallow for second and fourth waves of diagonals.