
Upwards movement was unexpected, but remained just below the invalidation point. The wave count remains the same.
Summary: The third wave is extending; I expect a small second wave correction to complete tomorrow about 1,835.63, and this should be followed by strong downwards movement towards a target at 1,776.
This analysis is published about 06:20 p.m. EST. Click on charts to enlarge.
Bullish Wave Count.
The aqua blue trend lines are critical for all wave counts. Draw the first trend line from the low of 1,158.66 on 25th November, 2011 to the next swing low at 1,266.74 on 4th June, 2012. Create a parallel copy and place it on the low at 1,560.33 on 24th June, 2013. While price remains above the lower of these two aqua blue trend lines we must assume the trend remains upwards. This is the main reason for the bullish wave count being my main wave count.
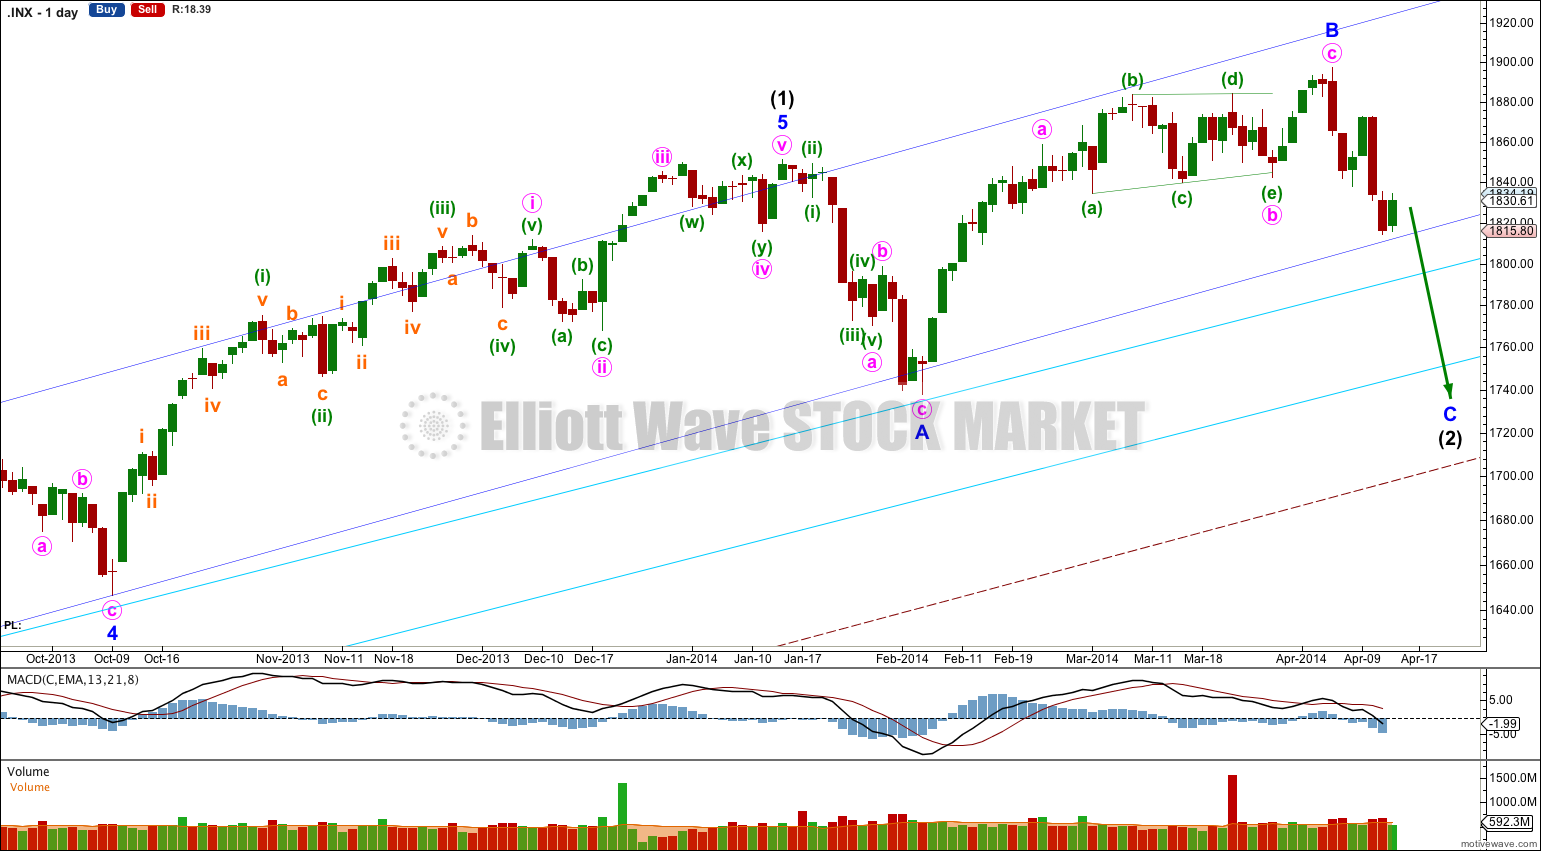
This bullish wave count expects a new bull market began at 666.79 for a cycle wave V. Within cycle wave V primary waves 1 and 2 are complete. Within primary wave 3 intermediate wave (1) is complete at 1,850.84.
Intermediate wave (2) is unlikely to be over at the low of minor wave A for three main reasons:
1. It would be a remarkably brief correction for intermediate degree, lasting only 14 days.
2. Intermediate wave (2) would have not breached the channel containing intermediate wave (1) (dark blue trend channel) which would be very unusual.
3. The last upwards wave labeled minor wave B does not fit as a five wave structure; it fits best as a three. If this is the start of a new upwards trend it could only be a first wave of a leading diagonal, and while leading diagonals are not rare they are not common either. The probability that a leading diagonal is unfolding upwards is low.
Intermediate wave (2) is continuing as an expanded flat correction.
There is divergence at the daily chart level with price trending higher to complete minor wave B while MACD trends lower. This divergence supports the wave count.
Intermediate wave (2) should find some support about the lower of the two aqua blue trend lines.
Intermediate wave (2) is most likely an expanded flat. Downwards movement for minor wave C is highly likely to make a new low below the end of minor wave A at 1,737.92 to avoid a truncation and a rare running flat. This would see the lower of the double aqua blue trend lines breached by an overshoot. In this instance I will apply the classic technical analysis guideline of allowing for a breach of up to 3% of market value (56.92 points). If downwards movement continues beyond this point the wave count would be in doubt and a huge trend change would be indicated.
If the larger maroon – – – channel copied over here from the monthly chart is breached then the bullish monthly (and this daily) wave count would be in doubt. The bearish wave count (or rather, a variation of it) may be correct.
There is some precedent for a small breach of the lower aqua blue trend line: in November 2012 it was breached by 1.5% of market value. Small overshoots like this can happen.
I do not have a target for minor wave C downwards for you. If it were to reach 1.618 the length of minor wave A then downwards movement would breach the lower aqua blue trend line by more than 3%. If this wave count is correct then that should not happen. We may not see a ratio between minor waves A and C, which is not unusual for the S&P.
When I know where minute waves iii and iv within minor wave C have ended then I will use the ratios within minor wave C between minute waves i, iii and v to calculate a target for it to end. I will only be able to do this for you towards the end of next week or early the following week.
Minor wave A lasted 14 sessions and minor wave B lasted 41 sessions. If minor wave C lasts about three to five weeks it would be in proportion and the wave count would have the “right look”.
For this bullish wave count when intermediate wave (2) is complete then very strong sustained upwards movement would be expected as an intermediate degree third wave within a primary degree third wave upwards unfolds.

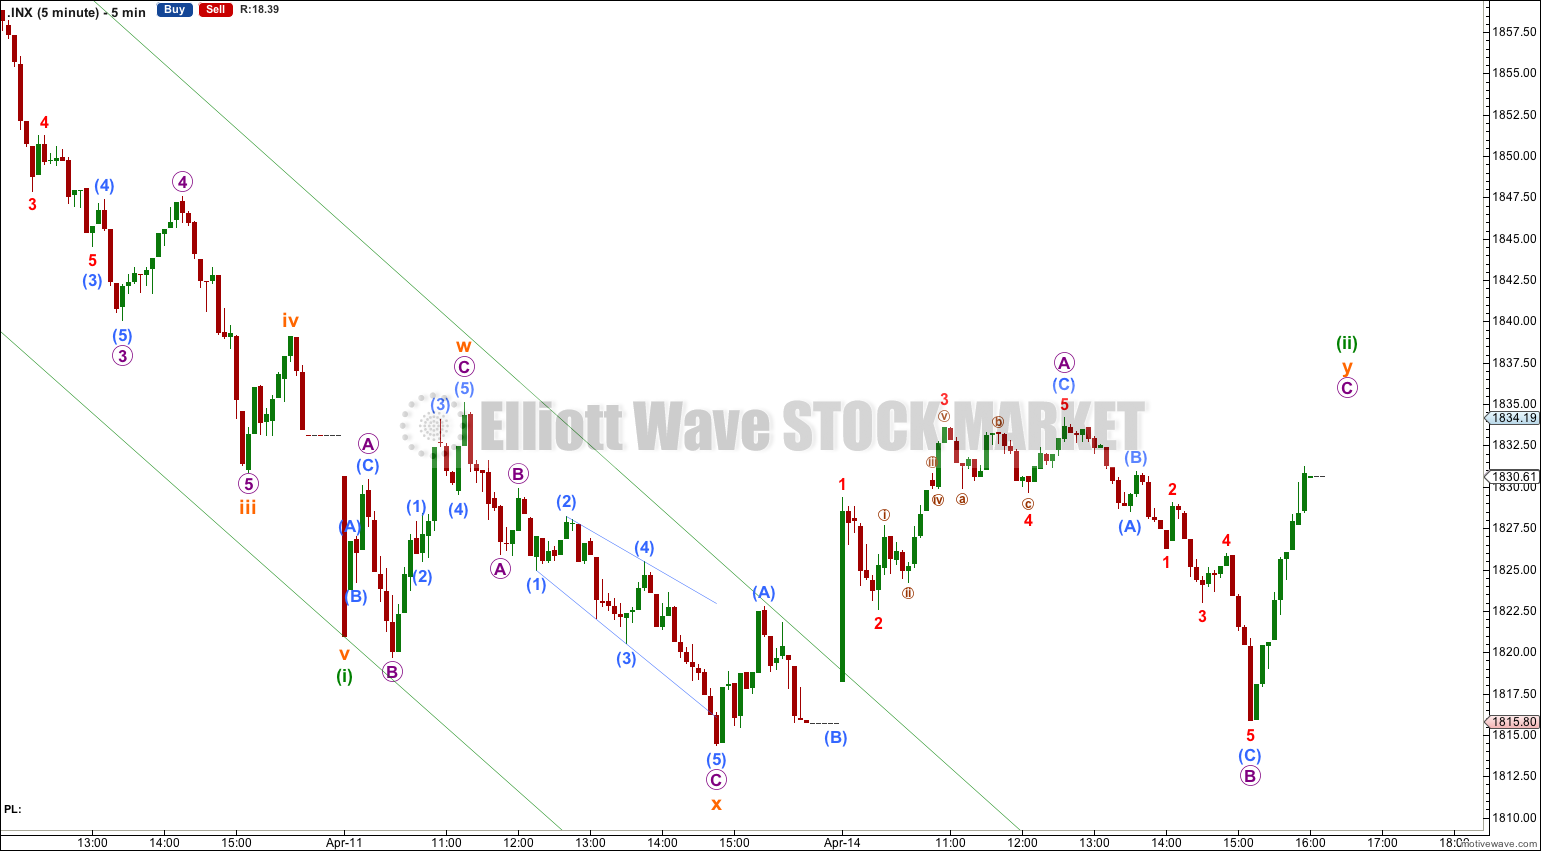
Sideways movement for Monday’s session looks like a continuation of minuette wave (ii) as a double flat correction. Because this movement shows on the daily chart as a green candlestick this would be minuette wave (ii) within minute wave iii, which would give minute wave iii a typical look at the daily and hourly chart level. When third waves extend it is normal to clearly see the second and fourth wave corrections within them.
Within the second flat of this double at 1,835.63 micro wave C would reach equality in length with micro wave A. The probability that minuette wave (ii) is over there would be very high; it could continue as a very rare triple flat, but the rarity of those structures means this has a very low probability.
The lower sloping pink channel is a base channel drawn about minute waves i and ii. Downwards movement for minute wave iii should strongly breach the lower edge of this channel, and price should stay below it. Thereafter, upwards corrections should find resistance at the upper edge of the channel.
At 1,776 minute wave iii would reach 1.618 the length of minute wave i. The next downwards wave, minuette wave (iii) within minute wave iii, should show a strong increase in downwards momentum.
Minute wave i lasted three days or sessions. Minute wave iii is extending so it should be longer in duration. So far it has lasted three sessions, and it has not yet reached its halfway mark. It may last a total of five or eight sessions.
Minuette wave (ii) may not move beyond the start of minuette wave (i). This wave count is invalidated with movement above 1,872.53.
Bearish Alternate Wave Count.
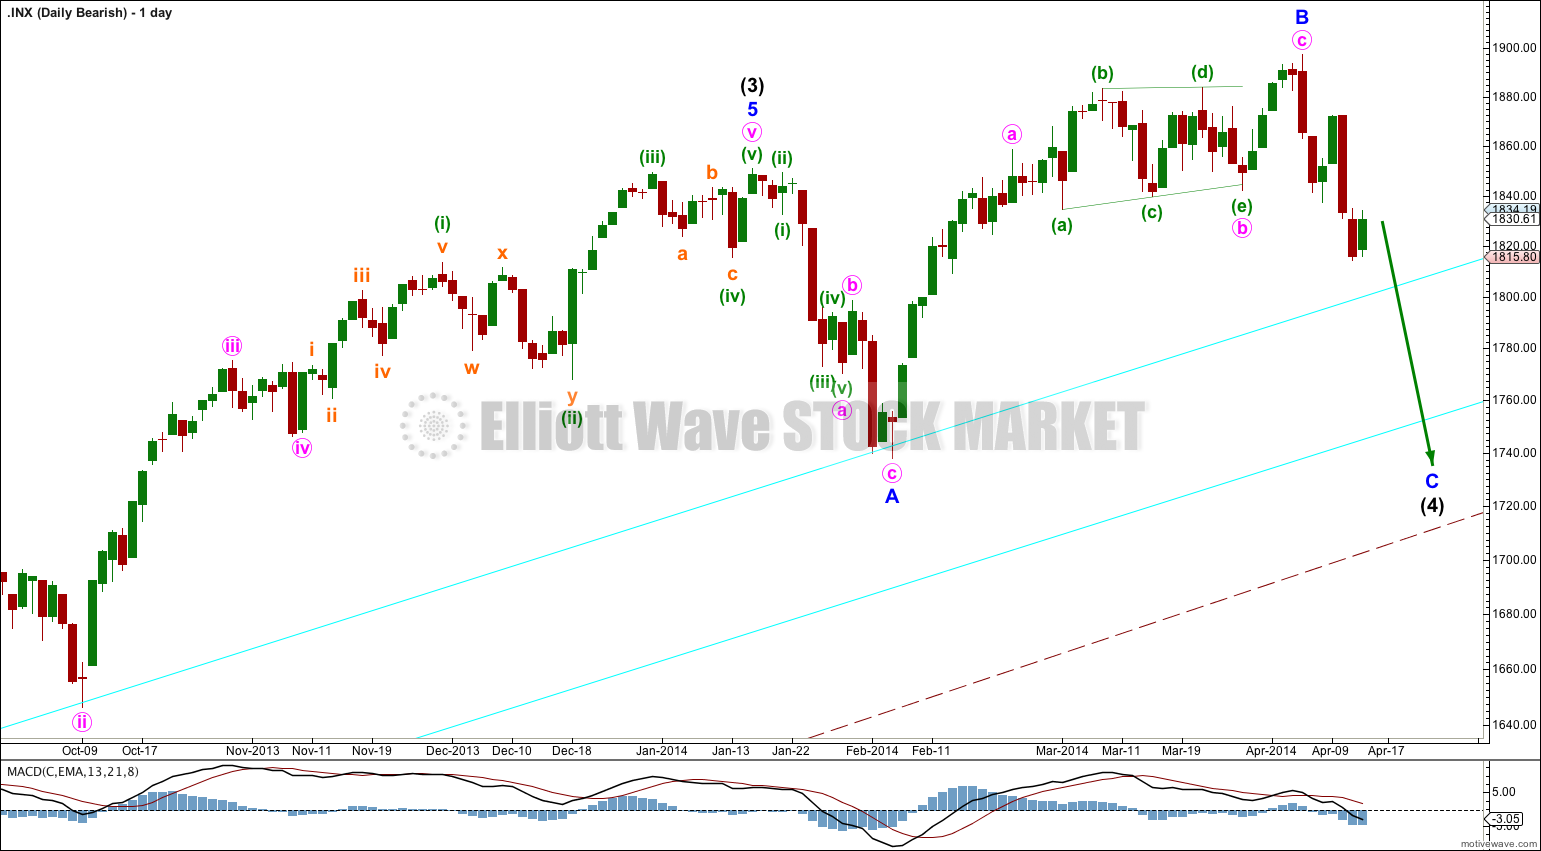
This bearish wave count expects that the correction was not over at 666.79, and that may have been just cycle wave a of a huge expanded flat for a super cycle wave II. Cycle wave b upwards is a close to complete zigzag.
Within flat corrections the maximum common length of B waves in relation to A waves is 138%. So far cycle wave b is a 141% correction of cycle wave a. For this reason only this wave count is an alternate.
Within primary wave C of the zigzag intermediate wave (4) would be incomplete.
The subdivisions for intermediate wave (4) would be the same as the main wave count for intermediate wave (2). I would expect it to end at the lower aqua blue trend line.
At 2,190 primary wave C would reach 1.618 the length of primary wave A. When intermediate wave (4) is complete I would recalculate this target at intermediate degree. I have found Fibonacci ratios between actionary waves (1, 3 and 5) of impulses are more reliable than between A and C waves within zigzags for the S&P500.
If intermediate wave (5) lasts about five to six months it may end about October this year.
Lara,
Its probably too early to tell, but what is a likely scenario for the s&p 500 after the 5th intermediate wave is over in october? is the a larger wave count in play?
Also, what would you suggest for someone who wants to learn to count wave with your level of aptitude? Is there an online series of classes, or live group session you might recommend?
Thanks!
For the bullish wave count the target for primary wave 3 (from the monthly chart in the historical analysis section) is 2,917.
The bullish wave count must see the base channel on the monthly chart breached by upwards movement, and upwards momentum must significantly increase. If these two things don’t happen then the bearish wave count may actually be correct.
For the bearish wave count the target for the final fifth wave up is 2,190.
The bearish wave count would then expect a huge crash to significantly below 666.79.
In regards to learning Elliott Wave, I would suggest you begin at my education page. Start with watching the documentary “History’s Hidden Engine” because that explains the “why” of Elliott Wave. You need to understand the underlying reasons to really “get” it.
The only book you should ever purchase and use is Frost and Prechter’s excellent “Elliott Wave Principle” 10th edition. Don’t read anything else on Elliott wave, there is a lot of inaccurate information on EW online, and it will confuse you.
One of my biggest aims with this service is to teach members how to do their own EW analysis. I hope that by watching video (or reading the articles) every day you all pick up something new each day or week. Sometimes members leave because they don’t need me anymore, and that’s great. My work is done.