
Downwards movement continues as expected, and momentum is increasing as expected. The target is the same.
Summary: The third wave is still incomplete, and the short term target for it to end is at 1,776. This target may be about three or four days away. We should see a further increase in downwards momentum early next week.
This analysis is published about 11:10 p.m. EST. Click on charts to enlarge.
Bullish Wave Count.
The aqua blue trend lines are critical for all wave counts. Draw the first trend line from the low of 1,158.66 on 25th November, 2011 to the next swing low at 1,266.74 on 4th June, 2012. Create a parallel copy and place it on the low at 1,560.33 on 24th June, 2013. While price remains above the lower of these two aqua blue trend lines we must assume the trend remains upwards. This is the main reason for the bullish wave count being my main wave count.
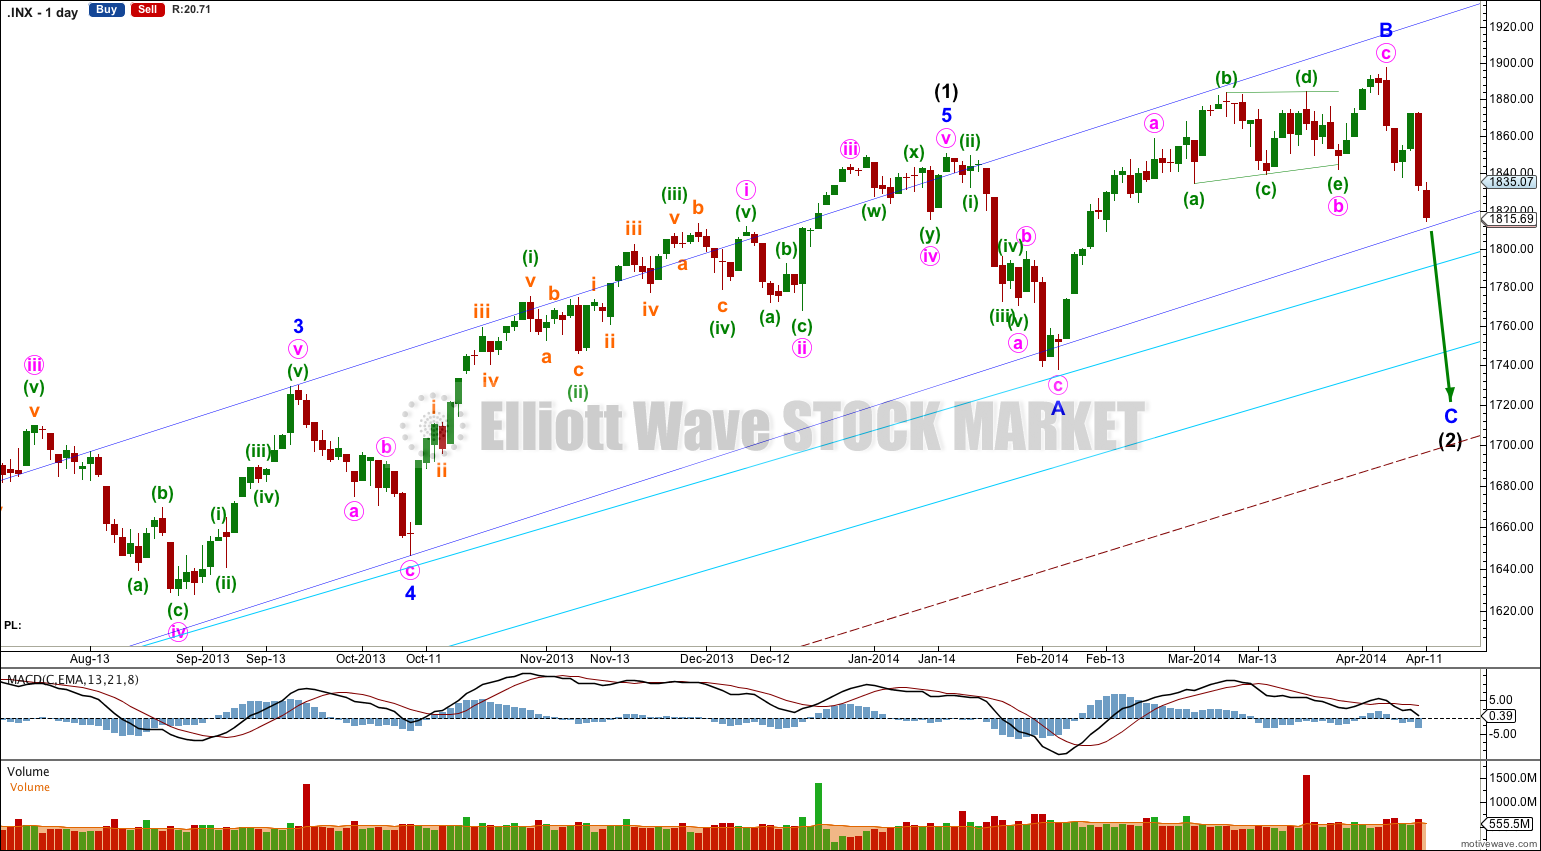
This bullish wave count expects a new bull market began at 666.79 for a cycle wave V. Within cycle wave V primary waves 1 and 2 are complete. Within primary wave 3 intermediate wave (1) is complete at 1,850.84.
Intermediate wave (2) is unlikely to be over at the low of minor wave A for three main reasons:
1. It would be a remarkably brief correction for intermediate degree, lasting only 14 days.
2. Intermediate wave (2) would have not breached the channel containing intermediate wave (1) (dark blue trend channel) which would be very unusual.
3. The last upwards wave labeled minor wave B does not fit as a five wave structure; it fits best as a three. If this is the start of a new upwards trend it could only be a first wave of a leading diagonal, and while leading diagonals are not rare they are not common either. The probability that a leading diagonal is unfolding upwards is low.
Intermediate wave (2) is continuing as an expanded flat correction.
There is divergence at the daily chart level with price trending higher to complete minor wave B while MACD trends lower. This divergence supports the wave count.
Intermediate wave (2) should find some support about the lower of the two aqua blue trend lines.
Intermediate wave (2) is most likely an expanded flat. Downwards movement for minor wave C is highly likely to make a new low below the end of minor wave A at 1,737.92 to avoid a truncation and a rare running flat. This would see the lower of the double aqua blue trend lines breached by an overshoot. In this instance I will apply the classic technical analysis guideline of allowing for a breach of up to 3% of market value (56.92 points). If downwards movement continues beyond this point the wave count would be in doubt and a huge trend change would be indicated.
If the larger maroon – – – channel copied over here from the monthly chart is breached then the bullish monthly (and this daily) wave count would be in doubt. The bearish wave count may be correct.
There is some precedent for a small breach of the lower aqua blue trend line: in November 2012 it was breached by 1.5% of market value. Small overshoots like this can happen.
I do not have a target for minor wave C downwards for you. If it were to reach 1.618 the length of minor wave A then downwards movement would breach the lower aqua blue trend line by more than 3%. If this wave count is correct then that should not happen. We may not see a ratio between minor waves A and C, which is not unusual for the S&P.
When I know where minute waves iii and iv within minor wave C have ended then I will use the ratios within minor wave C between minute waves i, iii and v to calculate a target for it to end. I will only be able to do this for you towards the end of next week or early the following week.
Minor wave A lasted 14 sessions and minor wave B lasted 41 sessions. If minor wave C lasts about three to five weeks it would be in proportion and the wave count would have the “right look”.
For this bullish wave count when intermediate wave (2) is complete then very strong sustained upwards movement would be expected as an intermediate degree third wave within a primary degree third wave upwards unfolds.
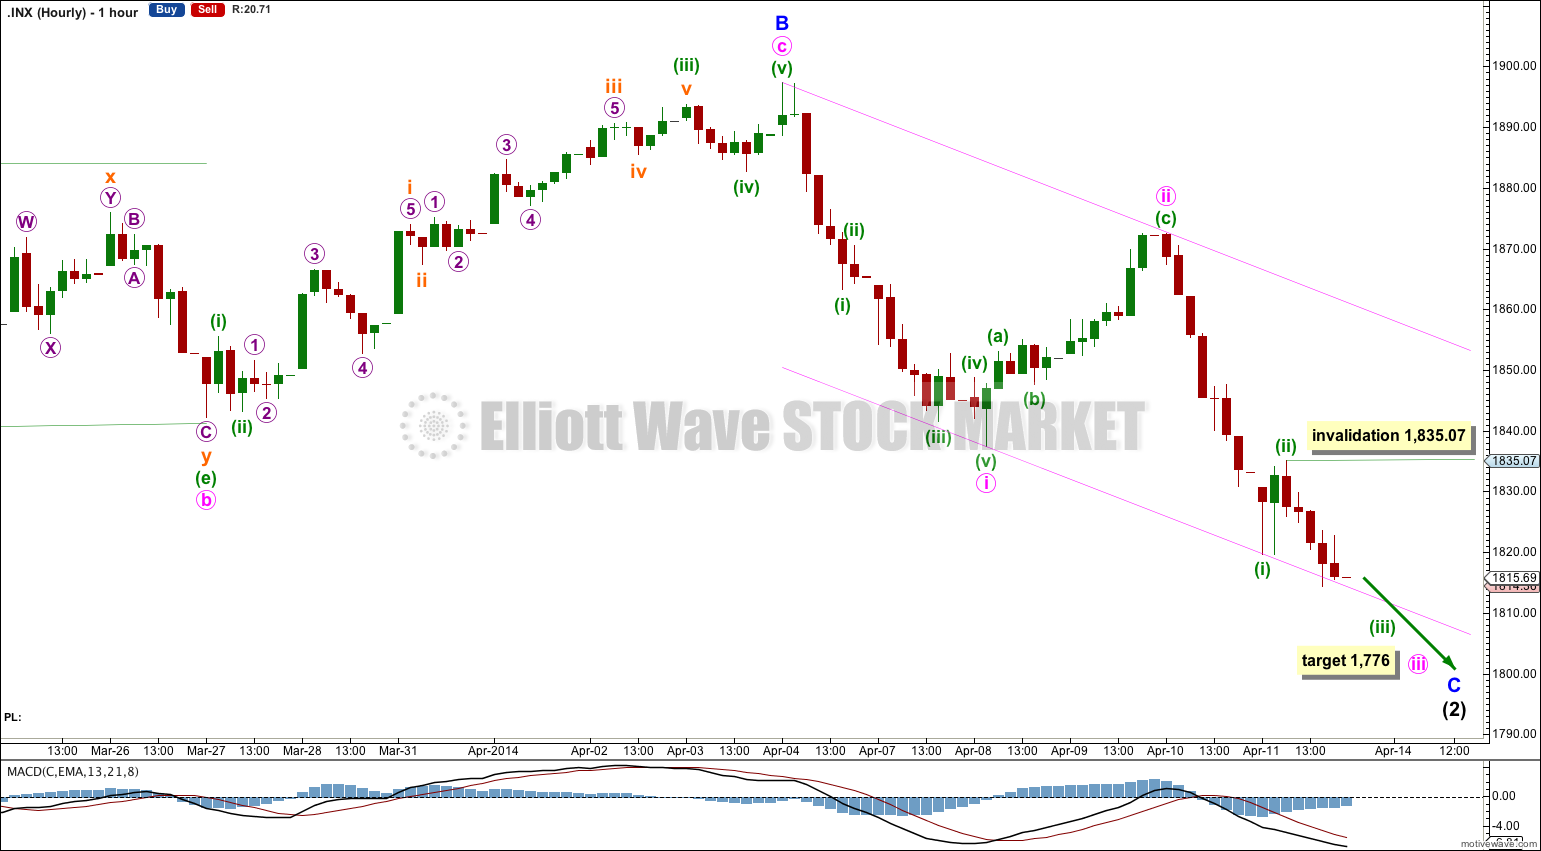
Within minute wave iii minuette waves (i) and (ii) may now be complete. Minuette wave (ii) shows clearly on the hourly chart, but it does not show on the daily chart. I would expect minuette wave (iv) to also be clear on the hourly chart but not to show on the daily chart, and it should only last a few hours.
At 1,776 minute wave iii would reach 1.618 the length of minute wave i.
Minute wave i lasted two days, and minute wave ii lasted two days. I would expect minute wave iii to be longer in duration if it is extended (and an extended third wave is extremely likely). It may last a total of a Fibonacci three or five days, with five being more likely.
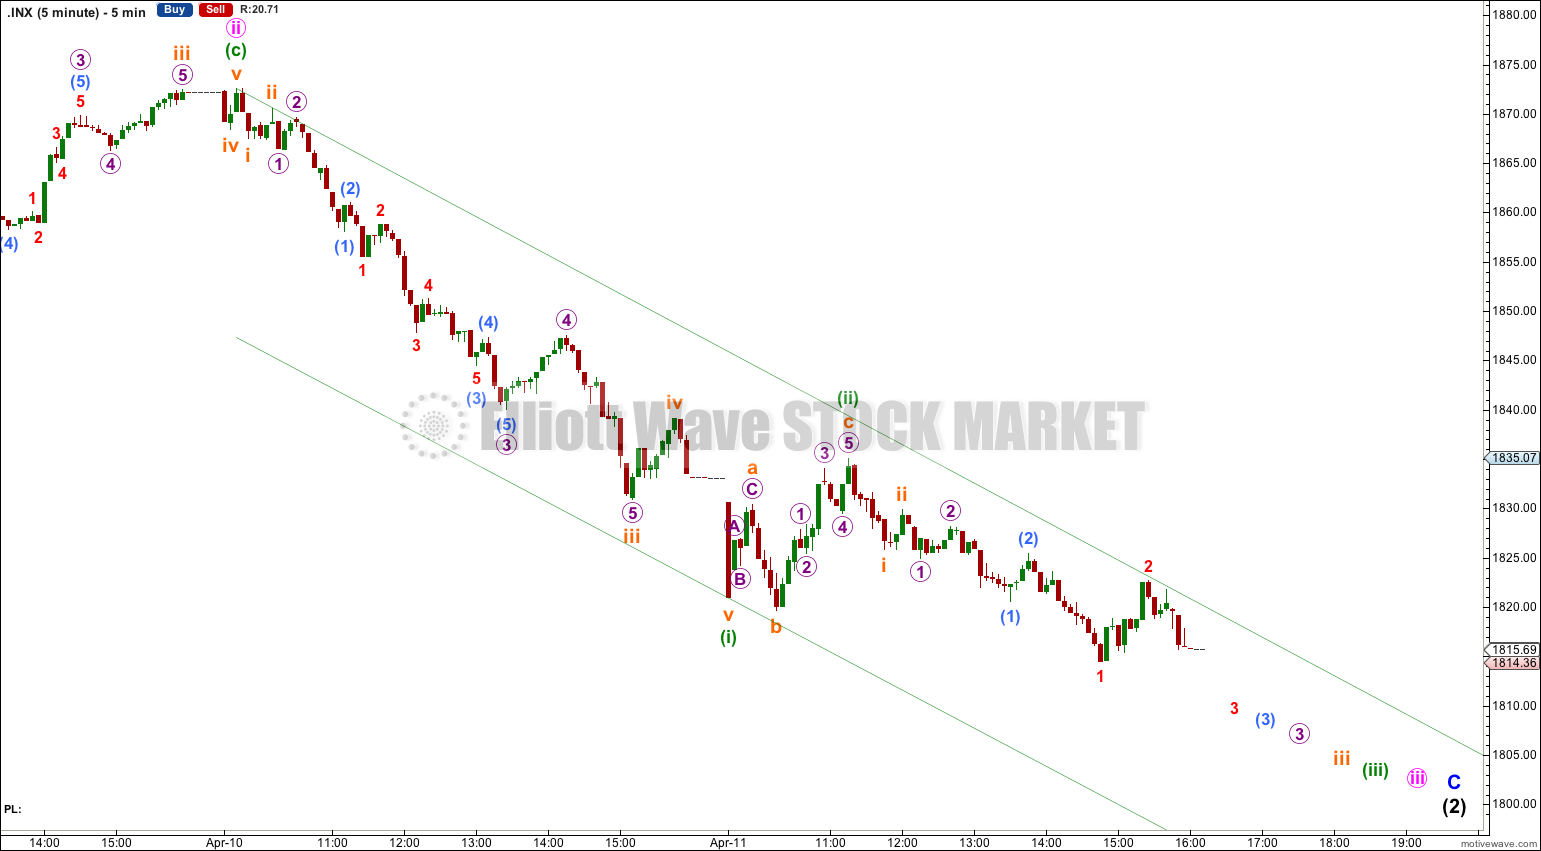
The pink channel drawn here is a base channel about minute waves i and ii. Downwards movement for minute wave iii should be strong enough to breach the lower edge of this channel, and thereafter the lower edge may provide some resistance.
The subdivisions of the start of minuette wave (iii) on the five minute chart suggest that the middle is approaching. I am expecting to see a further increase in downwards momentum on Monday and maybe Tuesday as well, as the middle of a third wave unfolds. Sometimes the middle portion of third waves can be explosive.
When minute wave iii is a complete impulse then we may move the invalidation point down to the end of minute wave i at 1,837.49.
There is only one possible structure for a third wave. It must be an impulse. Impulses are the easiest structures to analyse. At this stage I am confident that the impulse for minute wave iii is incomplete and price should continue to move lower.
Bearish Alternate Wave Count.
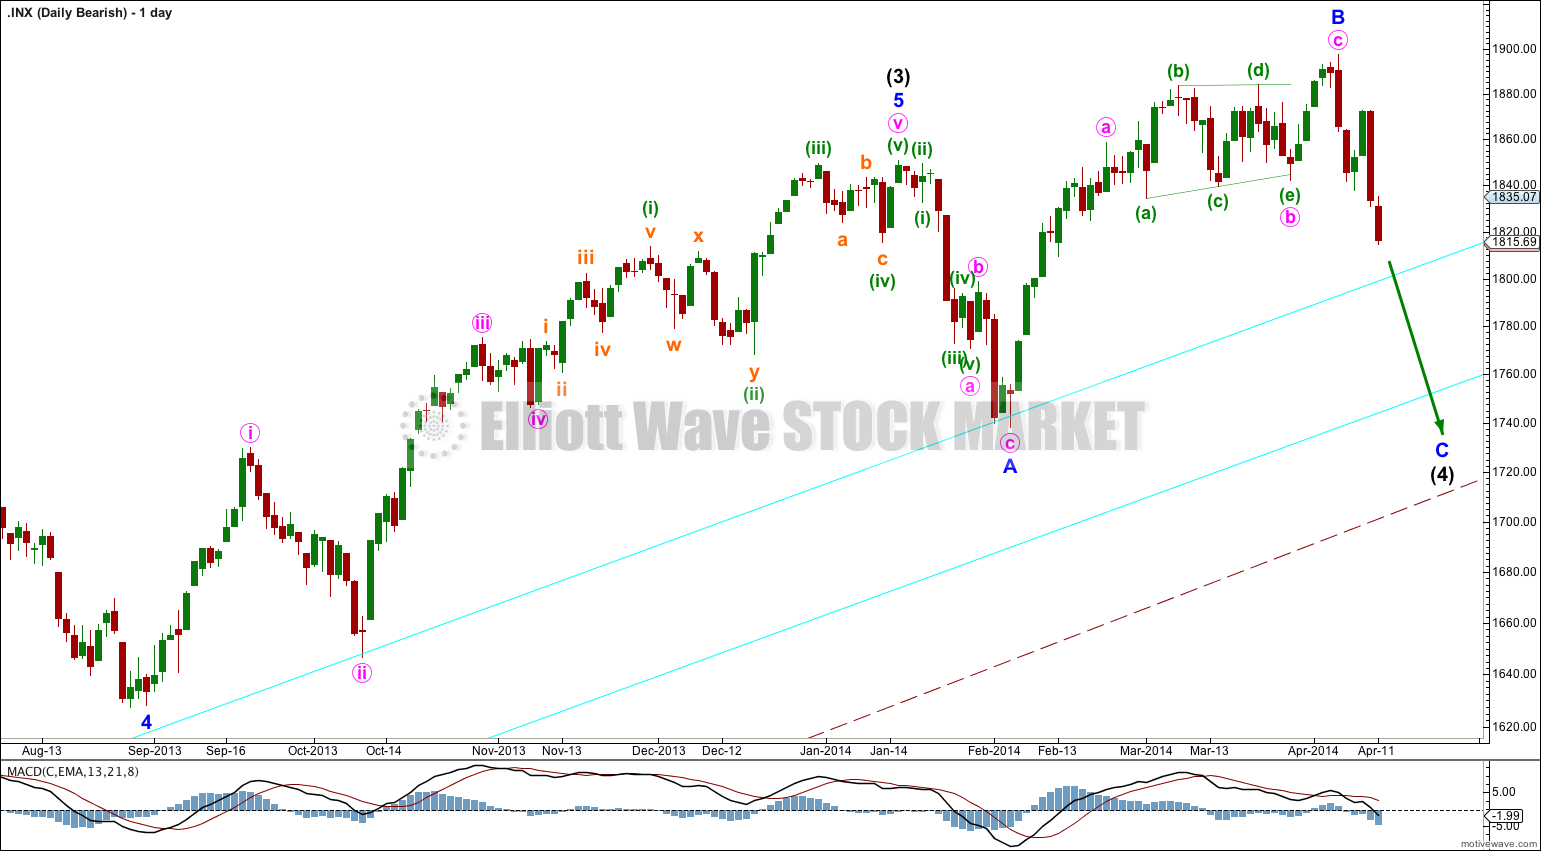
This bearish wave count expects that the correction was not over at 666.79, and that may have been just cycle wave a of a huge expanded flat for a super cycle wave II. Cycle wave b upwards is a close to complete zigzag.
Within flat corrections the maximum common length of B waves in relation to A waves is 138%. So far cycle wave b is a 141% correction of cycle wave a. For this reason only this wave count is an alternate.
Within primary wave C of the zigzag intermediate wave (4) would be incomplete.
The subdivisions for intermediate wave (4) would be the same as the main wave count for intermediate wave (2). I would expect it to end at the lower aqua blue trend line.
At 2,190 primary wave C would reach 1.618 the length of primary wave A. When intermediate wave (4) is complete I would recalculate this target at intermediate degree. I have found Fibonacci ratios between actionary waves (1, 3 and 5) of impulses are more reliable than between A and C waves within zigzags for the S&P500.
If intermediate wave (5) lasts about five to six months it may end about October this year.
Lara
Other than a rare running flat any other options for Int (2) ?
Thank you
It could be a double combination: zigzag – X – flat or triangle.
So far this downwards movement does not look like an unfolding flat or triangle.
If we don’t see an increase in downwards momentum early this week, if we don’t see a third wave, then I would consider the combination option.
It is less likely than a simple expanded flat though, as those are much more common.