
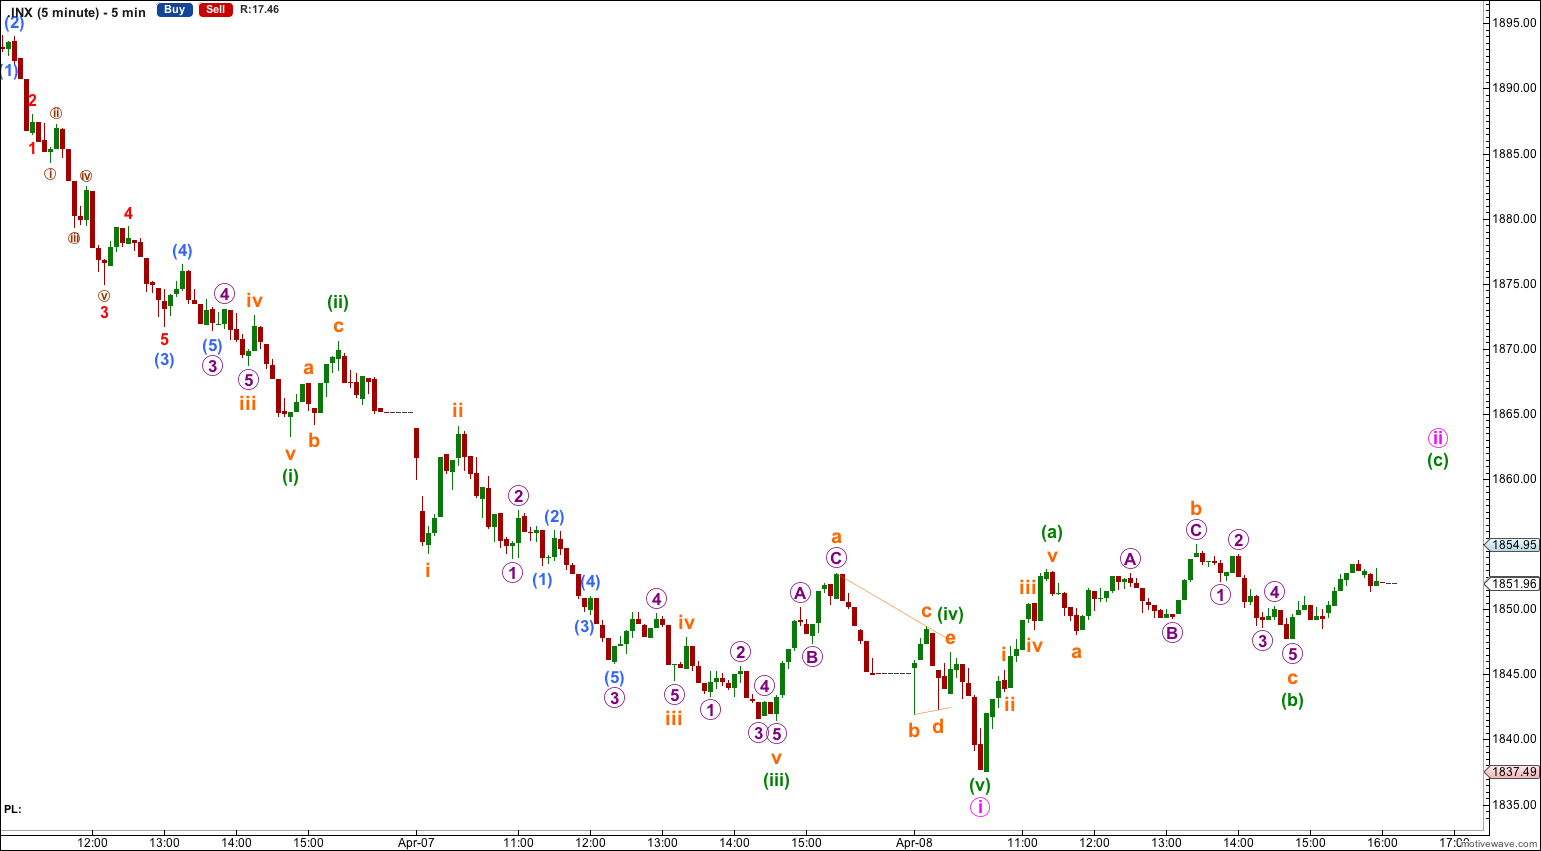
Price moved slightly lower to begin the session completing a five wave structure downwards. This should be followed by a correction and I can calculate a target for it to end.
Summary: I expect a second wave correction may complete tomorrow. The target for it is 1,863. Thereafter, I expect to see an increase in downwards momentum for a third wave.
This analysis is published about 06:20 p.m. EST. Click on charts to enlarge.
Bullish Wave Count.
The aqua blue trend lines are critical for all wave counts. Draw the first trend line from the low of 1,158.66 on 25th November, 2011 to the next swing low at 1,266.74 on 4th June, 2012. Create a parallel copy and place it on the low at 1,560.33 on 24th June, 2013. While price remains above the lower of these two aqua blue trend lines we must assume the trend remains upwards. This is the main reason for the bullish wave count being my main wave count.
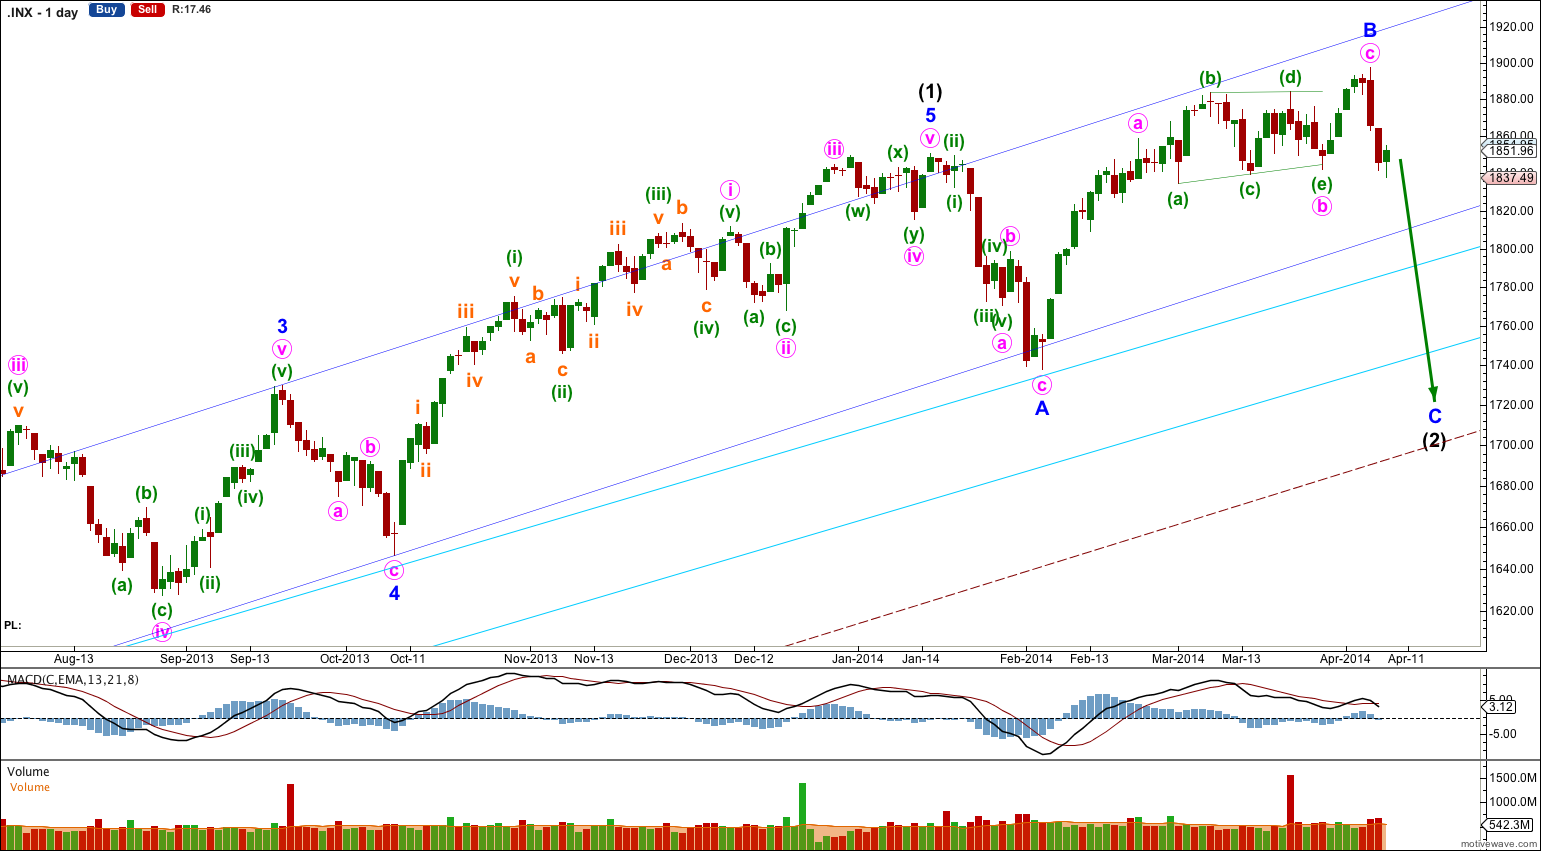
This bullish wave count expects a new bull market began at 666.79 for a cycle wave V. Within cycle wave V primary waves 1 and 2 are complete. Within primary wave 3 intermediate wave (1) is complete at 1,850.84.
Intermediate wave (2) is unlikely to be over at the low of minor wave A for three main reasons:
1. It would be a remarkably brief correction for intermediate degree, lasting only 14 days.
2. Intermediate wave (2) would have not breached the channel containing intermediate wave (1) (dark blue trend channel) which would be very unusual.
3. If the new upwards movement is the start of a third wave it would have to be labeled as a series of overlapping first and second waves where I have a triangle labeled (a triangle cannot be in the position of a second wave). This requires two successive second waves which would have breached the base channels of the first and second waves one degree higher. This would be extremely unusual and such a wave count should be discarded, which I have.
Intermediate wave (2) is continuing as an expanded flat correction.
There is divergence at the daily chart level with price trending higher to complete minor wave B while MACD trends lower. This divergence supports the wave count.
Intermediate wave (2) should find support about the lower of the two aqua blue trend lines.
Intermediate wave (2) is most likely an expanded flat. Downwards movement for minor wave C is highly likely to make a new low below the end of minor wave A at 1,737.92 to avoid a truncation and a rare running flat. This would see the lower of the double aqua blue trend lines breached by an overshoot. In this instance I will apply the classic technical analysis guideline of allowing for a breach of up to 3% of market value. If downwards movement continues beyond this point the wave count would be in doubt and a huge trend change would be indicated.
There is some precedent for a small breach of the lower aqua blue trend line: in November 2012 it was breached by 1.5% of market value. Small overshoots like this can happen.
I do not have a target for minor wave C downwards for you. If it were to reach 1.618 the length of minor wave A then downwards movement would breach the lower aqua blue trend line by more than 3%. If this wave count is correct then that should not happen. We may not see a ratio between minor waves A and C, which is not unusual for the S&P.
When I know where minute waves iii and iv within minor wave C have ended then I will use the ratios within minor wave C between minute waves i, iii and v to calculate a target for it to end. I will only be able to do this for you towards the end of the movement.
I would expect minor wave C downwards to last for about three to four weeks.
For this bullish wave count when intermediate wave (2) is complete then very strong sustained upwards movement would be expected as an intermediate degree third wave within a primary degree third wave upwards unfolds.
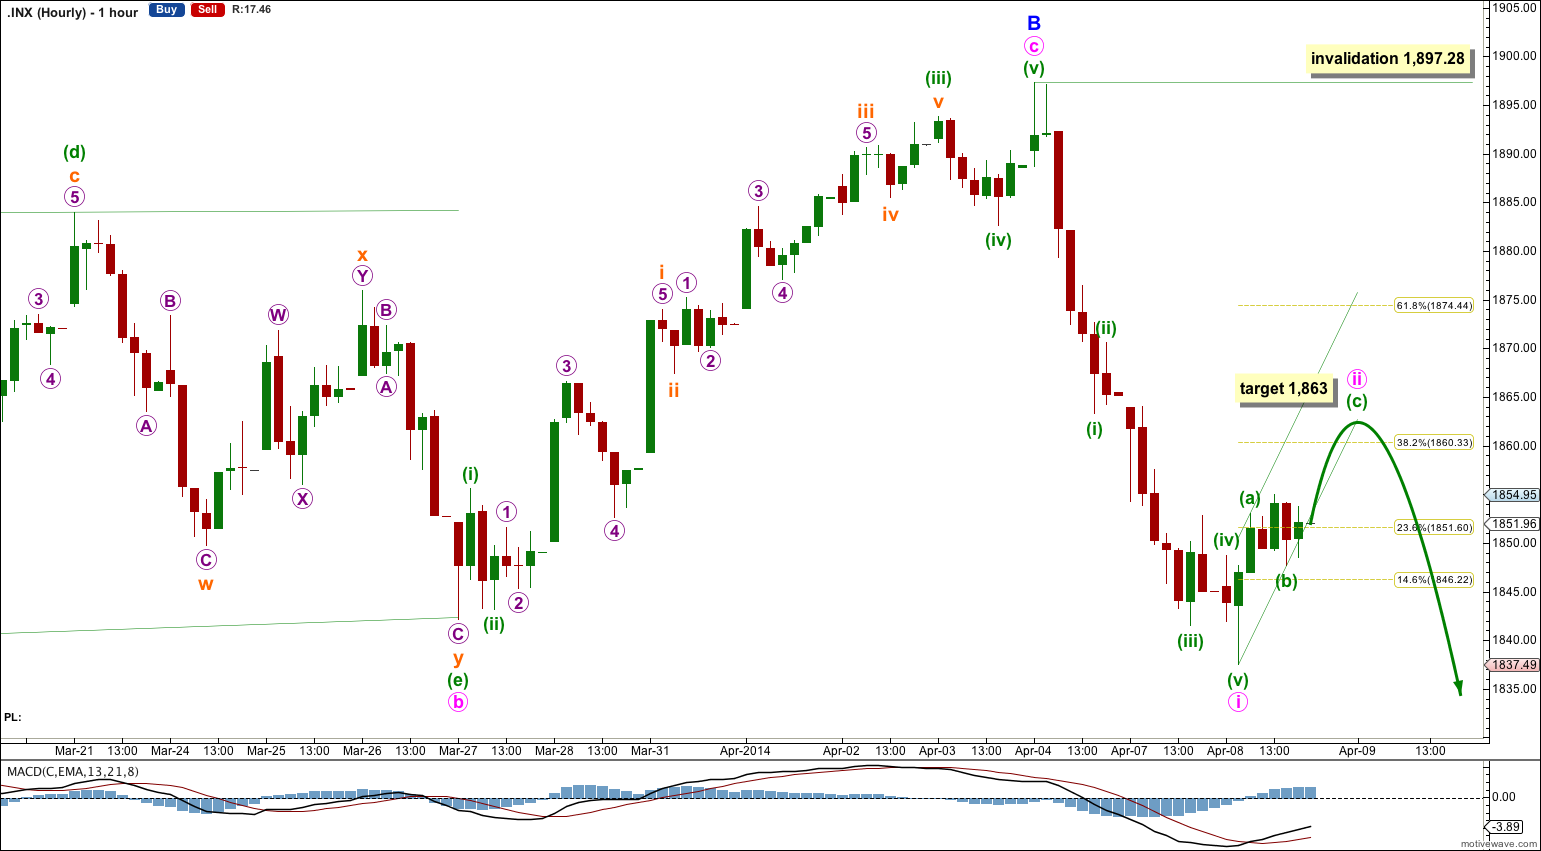
Minute wave i downwards is now a complete five wave impulse. Within minute wave i there are no adequate Fibonacci ratios between minuette waves (i), (iii) and (v).
Minute wave ii so far shows on the daily chart as one green candlestick and its structure is incomplete. I would expect it to end in one day or so. It may be a brief shallow zigzag as labeled here, or this first three up may be the first structure in a double zigzag or double combination or flat correction.
At 1,863 minuette wave (c) would reach equality in length with minuette wave (a) and minute wave ii would be just higher than the 0.382 Fibonacci ratio of minute wave i at 1,860.
When the upwards zigzag labeled minuette waves (a), (b) and (c) are complete then careful attention must be paid to the structure of the next wave down. If it subdivides as a three then minute wave ii is incomplete. If it subdivides as a five then minute wave ii may be over and minute wave iii downward may be underway.
Minute wave ii may not move beyond the start of minute wave i. This wave count is invalidated with movement above 1,897.28.
Bearish Alternate Wave Count.
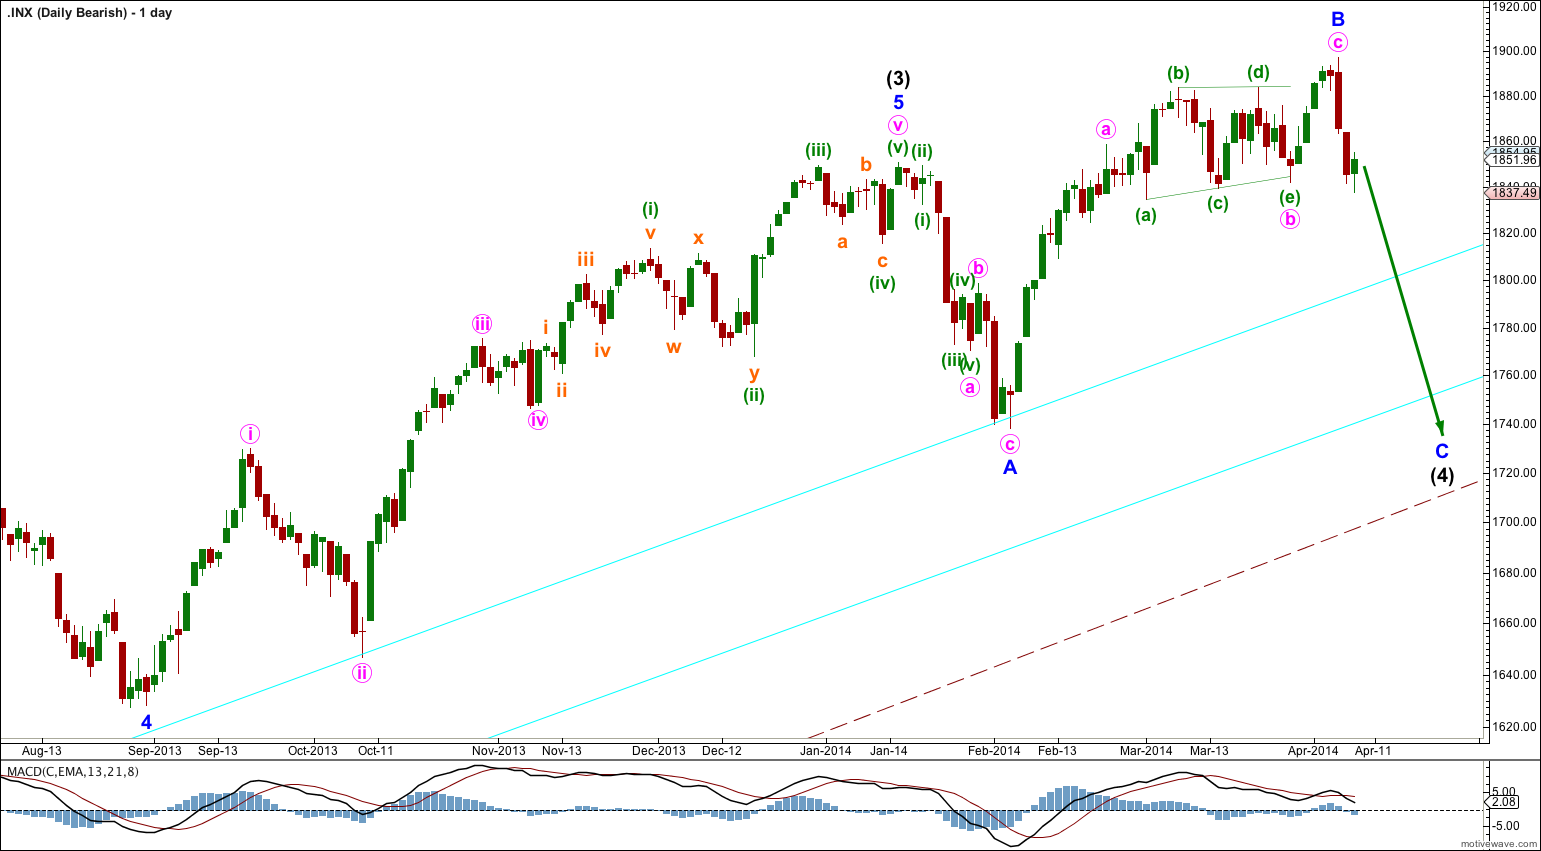
This bearish wave count expects that the correction was not over at 666.79, and that may have been just cycle wave a of a huge expanded flat for a super cycle wave II. Cycle wave b upwards is a close to complete zigzag.
Within flat corrections the maximum common length of B waves in relation to A waves is 138%. So far cycle wave b is a 141% correction of cycle wave a. For this reason only this wave count is an alternate.
Within primary wave C of the zigzag intermediate wave (4) would be incomplete.
The subdivisions for intermediate wave (4) would be the same as the main wave count for intermediate wave (2). I would expect it to end at the lower aqua blue trend line.
At 2,190 primary wave C would reach 1.618 the length of primary wave A. When intermediate wave (4) is complete I would recalculate this target at intermediate degree. I have found Fibonacci ratios between actionary waves (1, 3 and 5) of impulses are more reliable than between A and C waves within zigzags for the S&P500.
If intermediate wave (5) lasts about five to six months it may end about October this year.
Hi Lara,
We’re waiting for today’s update as it’s most important for us for next couple of days.
Please post update
I am sorry for the delay. My broadband connection was down (my whole town was affected) and I had to use a mobile connection from another provider. Because that connection is slower I waited for the main provider to come back up. That did not happen so I relied on the mobile data.
This has happened before but only for an hour or so, never for a half day and never my whole town. So it’s rather unusual.
If I am ever that late again check the website for a notice, there would be a very good reason. However, in over five years of doing this it has never been that late without prior notice.
It happens, no big worries. I’m glad the last storm didn’t take off your roof.