
Downwards movement was expected, although the session began with a spike higher which invalidated the main hourly wave count.
The main wave count is changed slightly and still has a better fit and overall look.
Price has not moved low enough for confidence in this wave count yet. The outlook is unchanged.
Summary: I still want to see movement below 1,849.69 to have confidence in a trend change at minor degree. Price needs to break out of the current range.
This analysis is published about 05:10 p.m. EST. Click on charts to enlarge.
Bullish Wave Count.
The aqua blue trend lines are critical for all wave counts. Draw the first trend line from the low of 1,158.66 on 25th November, 2011 to the next swing low at 1,266.74 on 4th June, 2012. Create a parallel copy and place it on the low at 1,560.33 on 24th June, 2013. While price remains above the lower of these two aqua blue trend lines we must assume the trend remains upwards. This is the main reason for the bullish wave count being my main wave count.
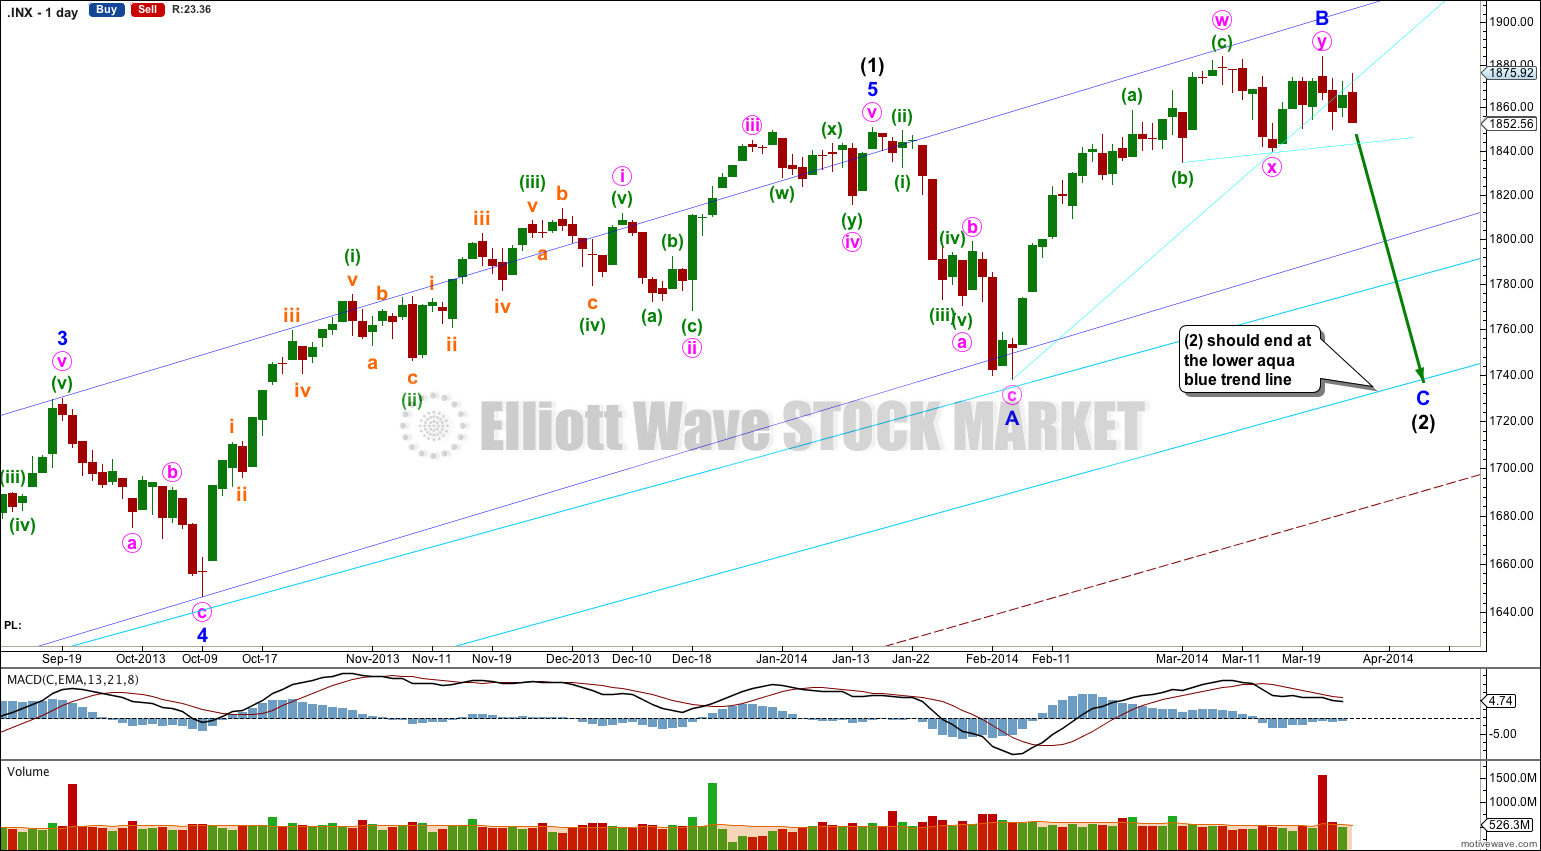
This bullish wave count expects a new bull market began at 666.79 for a cycle wave V. Within cycle wave V primary waves 1 and 2 are complete. Within primary wave 3 intermediate wave (1) is complete at 1,850.84. Intermediate wave (2) is continuing as an expanded flat correction.
Intermediate wave (2) should find strong support at the lower of the two aqua blue trend lines. Minor wave A lasted 14 days and minor wave B lasted 31 days. I would expect minor wave C to be of a similar duration and to last about three to four weeks in total.
For this bullish wave count when intermediate wave (2) is complete then very strong sustained upwards movement would be expected as an intermediate degree third wave within a primary degree third wave upwards unfolds.
Main Hourly Wave Count.
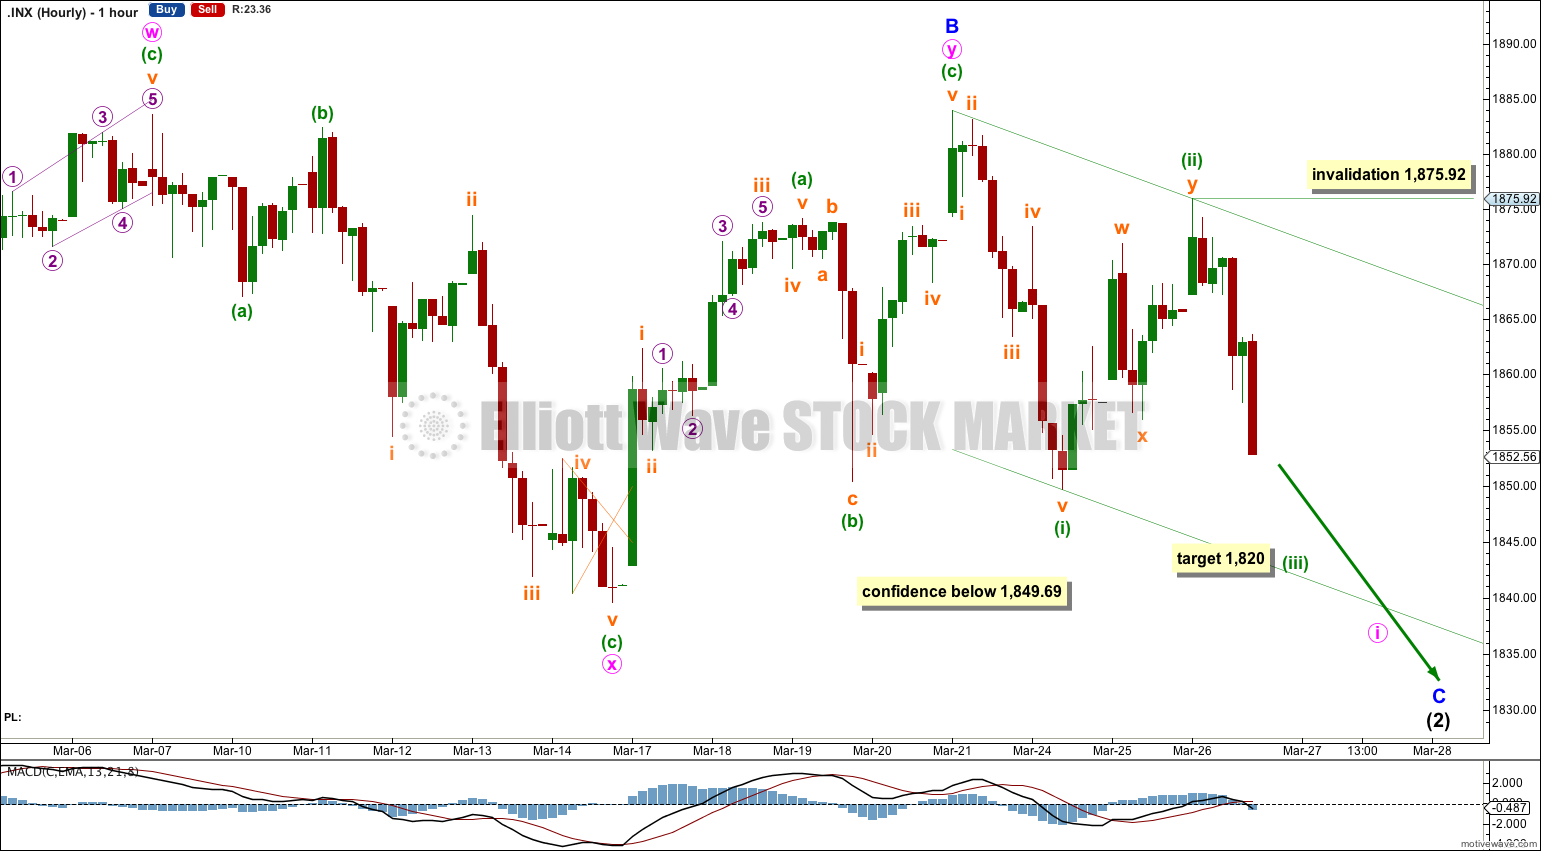
Minor wave C must subdivide as a five wave motive structure, either an impulse or an ending diagonal. An impulse is much more likely as it is more common.
Within it minute wave i is most likely incomplete and is most likely unfolding as an impulse. Within minute wave i I have changed the wave count: minuette wave (i) subdivides nicely as a completed five wave impulse and minuette wave (ii) following it subdivides as a completed double zigzag.
Ratios within minuette wave (i) are: subminuette wave iii is 0.94 points short of 2.618 the length of subminuette wave i, and subminuette wave v has no Fibonacci ratio to subminuette waves iii or i.
At 1,820 minuette wave (iii) would reach 1.618 the length of minuette wave (i). This next downwards wave should show an increase in downwards momentum.
Movement below 1,849.69 would invalidate the alternate below and provide some confidence in this main wave count.
Within minuette wave (iii) no second wave correction may move beyond the start of its first wave. This wave count is invalidated with movement above 1,875.92.
Alternate Hourly Wave Count.
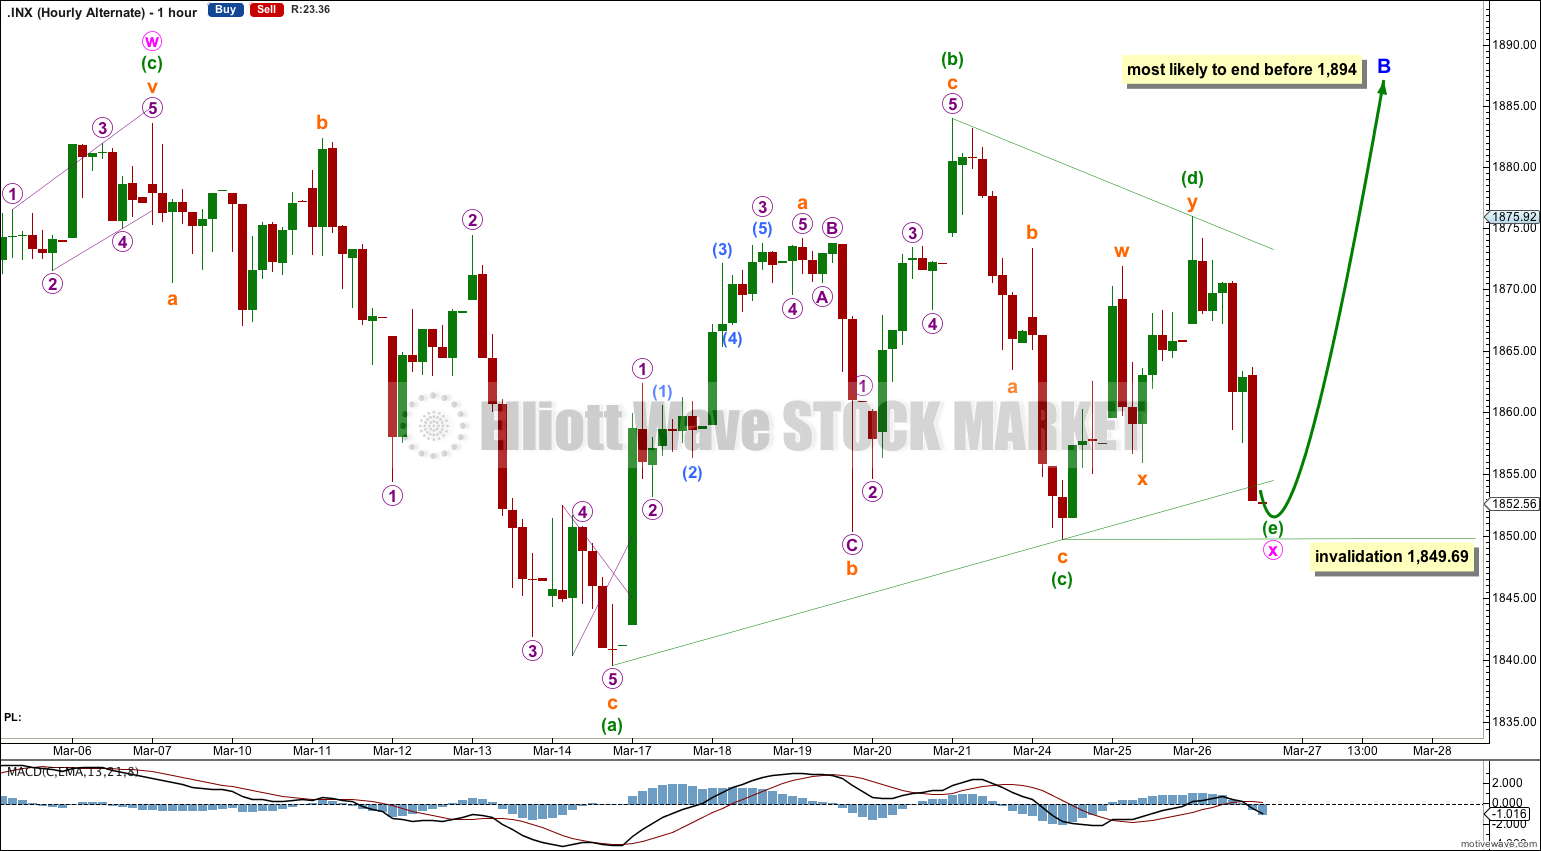
This alternate wave count sees minor wave B as an incomplete double combination or double zigzag. Within the double minute wave x may be a running contracting triangle which may have just completed. This nicely explains the choppy overlapping movement of the last few days.
Within the triangle minuette wave (e) may be incomplete and may move lower, because so far it looks like a five not a three. However, there is almost no room left for downwards movement. If it moves lower it would look strange as triangle waves are not normally that deep (except for wave D in a barrier triangle).
Minuette wave (e) may not move beyond the end of minuette wave (c) below 1,849.69.
If minor wave B continues higher then it would most likely end before 1,894 where it would be a 138% correction of minor wave A. This is the maximum common length of a B wave within a flat correction.
Because minute wave x as a triangle would be a relatively shallow correction in relation to minute wave w the structure for minor wave B would most likely be a double zigzag. I would expect the second zigzag in the double to move price reasonably beyond the end of the first, so new highs reasonably above 1,883.57 would be expected. There is not normally a Fibonacci ratio between two zigzags in a double so I cannot use the ratio between minute waves w and y to calculate a target for minute wave y to end. We must wait until minuette waves (a) and (b) within minute wave y are complete to calculate a target.
The triangle is not supported by MACD or volume. Normally triangles are associated with low volatility and declining volume. This triangle sees a volume spike within it on 21st March and MACD is not hovering about the zero line here on the hourly chart. For these reasons I expect this wave count has a lower probability than the main wave count.
Bearish Alternate Wave Count.
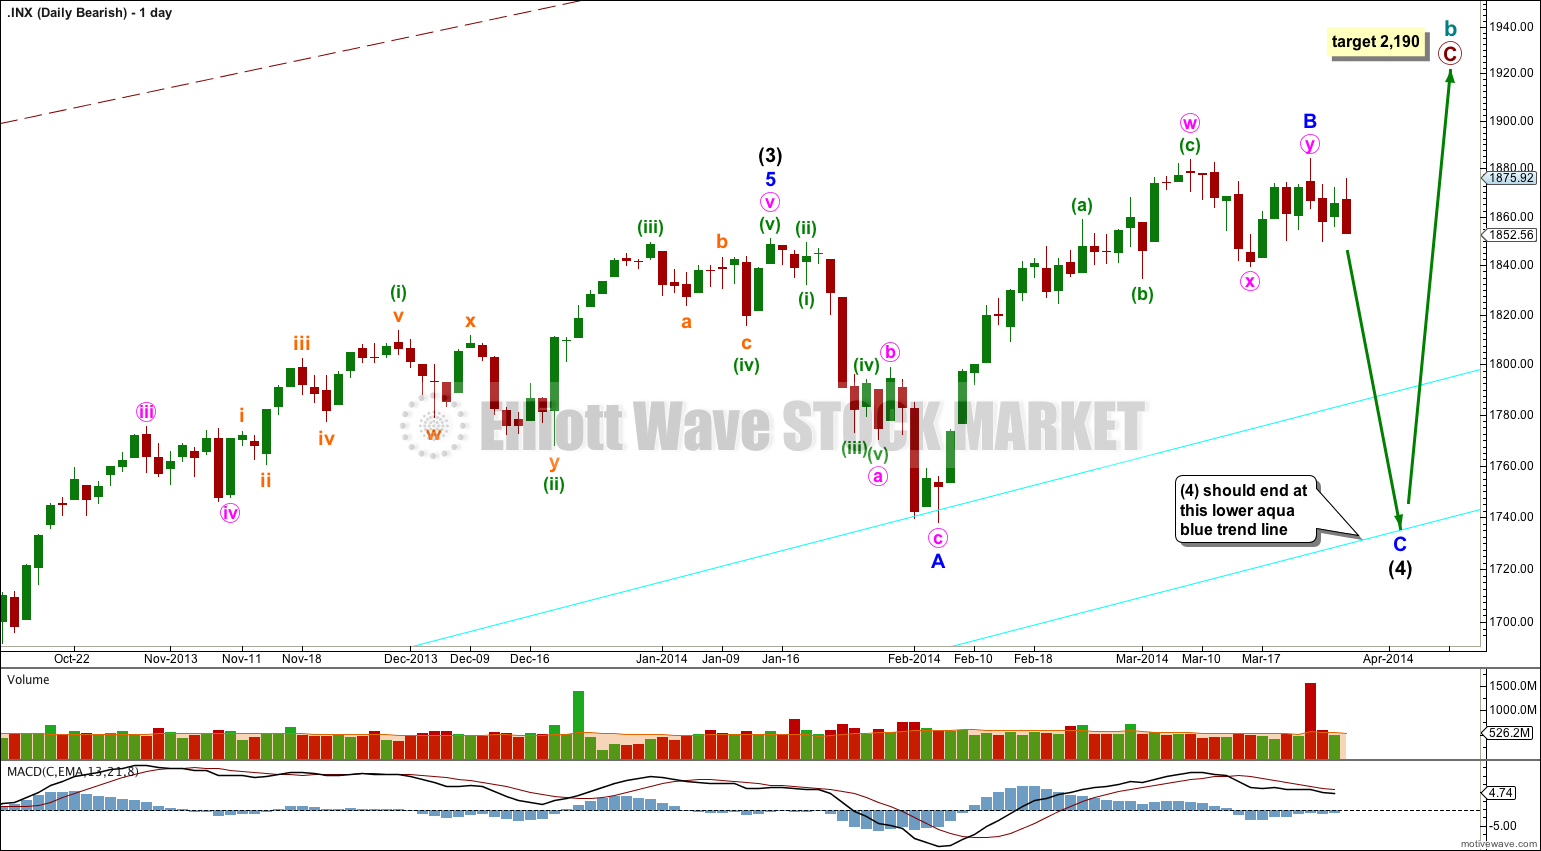
This bearish wave count expects that the correction was not over at 666.79, and that may have been just cycle wave a of a huge expanded flat for a super cycle wave II. Cycle wave b upwards is a close to complete zigzag.
Within flat corrections the maximum common length of B waves in relation to A waves is 138%. So far cycle wave b is a 141% correction of cycle wave a. For this reason only this wave count is an alternate.
Within primary wave C of the zigzag intermediate wave (4) would be incomplete.
The subdivisions for intermediate wave (4) would be the same as the main wave count for intermediate wave (2). I would expect it to end at the lower aqua blue trend line.
At 2,190 primary wave C would reach 1.618 the length of primary wave A. When intermediate wave (4) is complete I would recalculate this target at intermediate degree. I have found Fibonacci ratios between actionary waves (1, 3 and 5) of impulses are more reliable than between A and C waves within zigzags for the S&P500.
If intermediate wave (5) lasts about five to six months it may end about October this year.
The price is $1842. and you are still waiting for the price to move below $1849? Do you have a slow connection?
I’m using a google / yahoo data feed. It has the low for Thursday at 1,852.56.