
Downwards movement was expected.
Price has not moved low enough for confidence in this wave count yet. The outlook is unchanged.
Summary: I want to see movement below 1,849.69 tomorrow to have confidence in a trend change at minor degree. Price needs to break out of the current range.
This analysis is published about 06:35 p.m. EST. Click on charts to enlarge.
Bullish Wave Count.
The aqua blue trend lines are critical for all wave counts. Draw the first trend line from the low of 1,158.66 on 25th November, 2011 to the next swing low at 1,266.74 on 4th June, 2012. Create a parallel copy and place it on the low at 1,560.33 on 24th June, 2013. While price remains above the lower of these two aqua blue trend lines we must assume the trend remains upwards. This is the main reason for the bullish wave count being my main wave count.
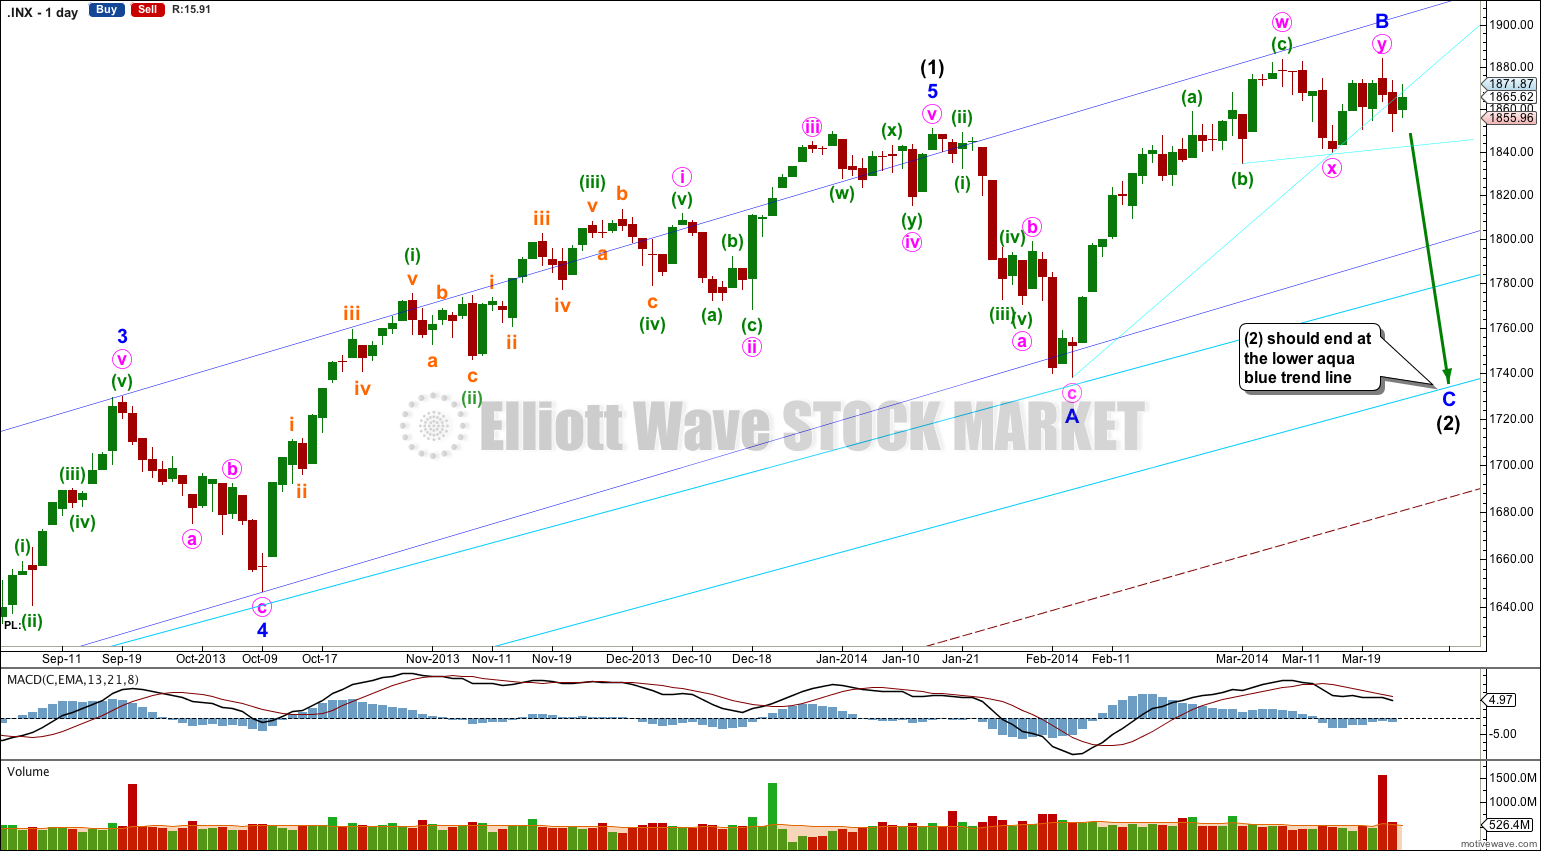
This bullish wave count expects a new bull market began at 666.79 for a cycle wave V. Within cycle wave V primary waves 1 and 2 are complete. Within primary wave 3 intermediate wave (1) is complete at 1,850.84. Intermediate wave (2) is continuing as an expanded flat correction.
Intermediate wave (2) should find strong support at the lower of the two aqua blue trend lines. Minor wave A lasted 14 days and minor wave B lasted 31 days. I would expect minor wave C to be of a similar duration and to last about three to four weeks in total.
For this bullish wave count when intermediate wave (2) is complete then very strong sustained upwards movement would be expected as an intermediate degree third wave within a primary degree third wave upwards unfolds.
Main Hourly Wave Count.
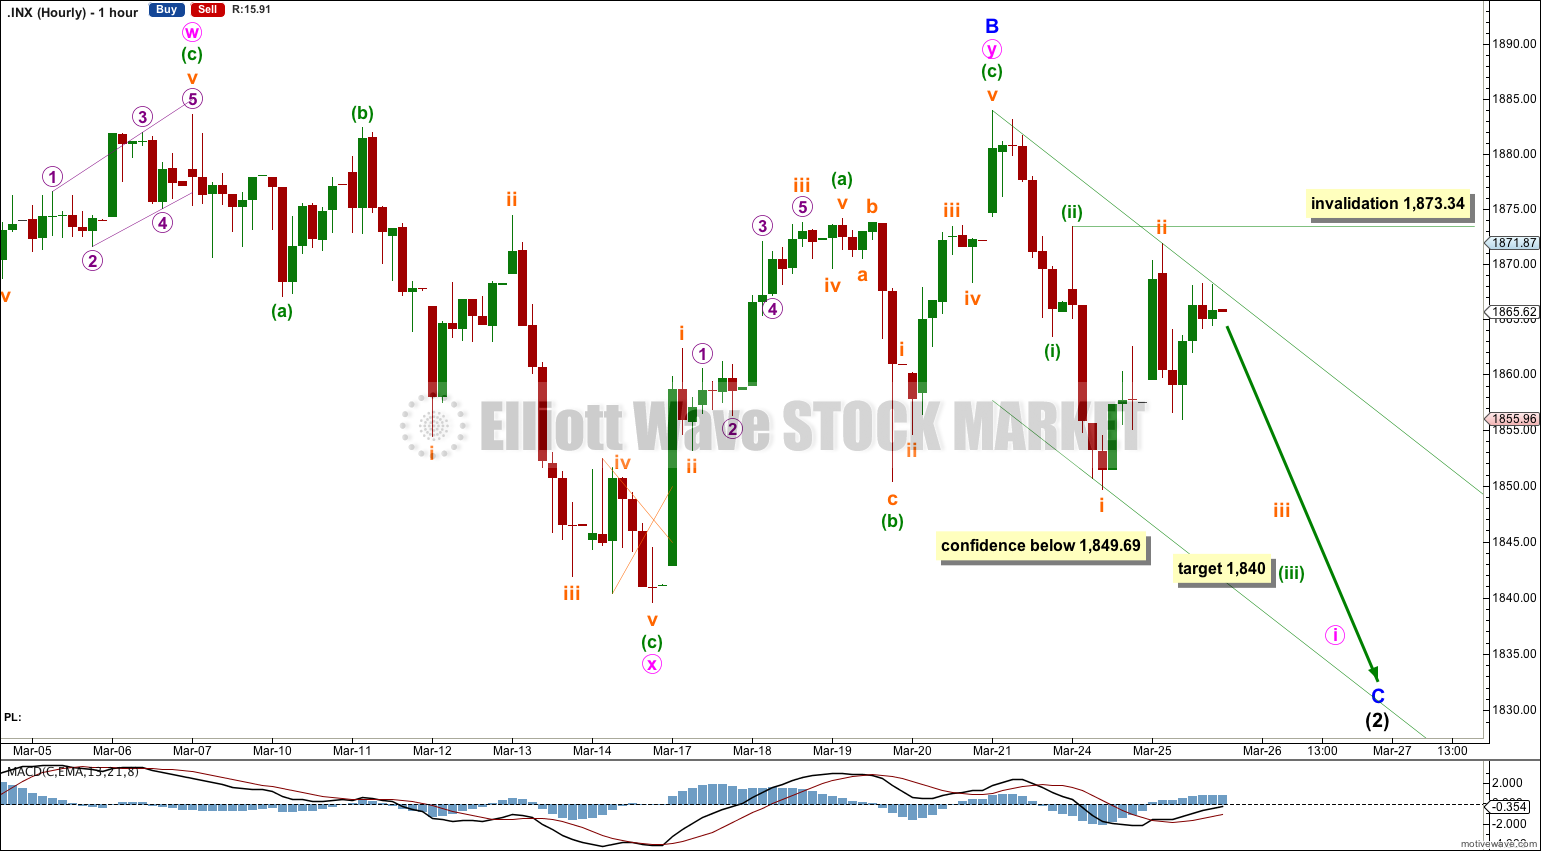
Minor wave C must subdivide as a five wave motive structure, either an impulse or an ending diagonal. An impulse is much more likely as it is more common.
If this main wave count is correct then tomorrow should see an increase in downwards momentum as a third wave within a third wave unfolds. At 1,840 minuette wave (iii) would reach 1.618 the length of minuette wave (i).
Although subminuette wave ii breached the upper edge of the base channel containing minuette waves (i) and (ii) this wave count still has a reasonable probability. The base channel most often provides a guideline to where subsequent second waves should end, but this is a guideline and not always adhered to. A breach of the base channel reduces the probability of this wave count but does not invalidate it.
Movement below 1,849.69 would invalidate the alternate below and provide some confidence in this main wave count.
Subminuette wave ii may not move beyond the start of subminuette wave i. This wave count is invalidated with movement above 1,873.34.
Alternate Hourly Wave Count.
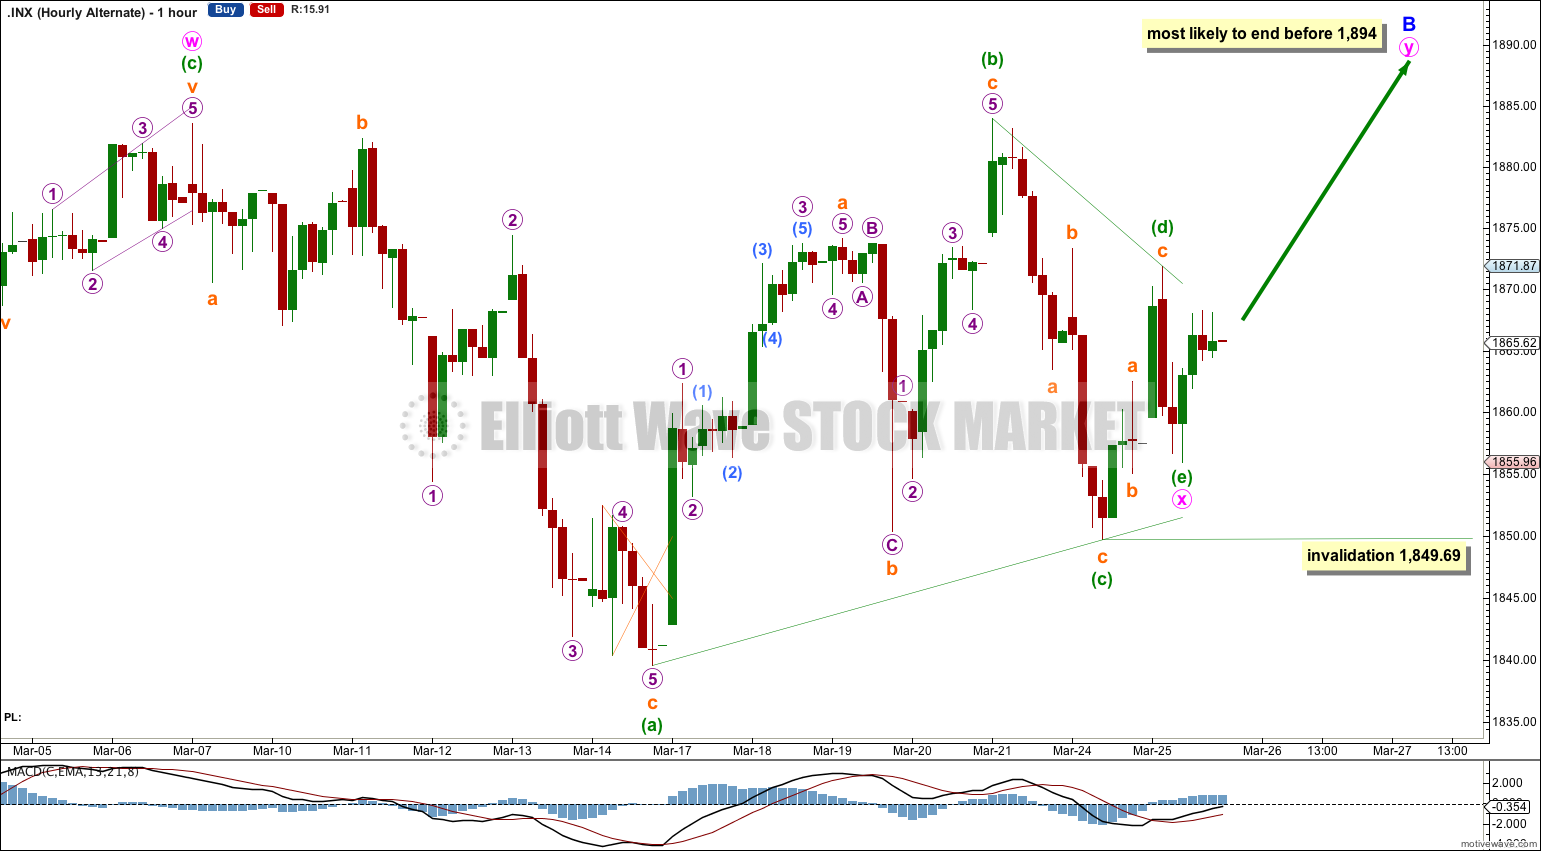
This alternate wave count sees minor wave B as an incomplete double combination or double zigzag. Within the double minute wave x may be a running contracting triangle which may have just completed. This nicely explains the choppy overlapping movement of the last few days.
Within the triangle minuette wave (e) would most likely have ended on Tuesday, undershooting the A-C trend line which is most common.
If minuette wave (e) continues lower it may not move beyond the end of minuette wave (c) below 1,849.69.
If minor wave B continues higher then it would most likely end before 1,894 where it would be a 138% correction of minor wave A. This is the maximum common length of a B wave within a flat correction.
Because minute wave x as a triangle would be a relatively shallow correction in relation to minute wave w the structure for minor wave B would most likely be a double zigzag. I would expect the second zigzag in the double to move price reasonably beyond the end of the first, so new highs reasonably above 1,883.57 would be expected. There is not normally a Fibonacci ratio between two zigzags in a double so I cannot use the ratio between minute waves w and y to calculate a target for minute wave y to end. We must wait until minuette waves (a) and (b) within minute wave y are complete to calculate a target.
Bearish Alternate Wave Count.
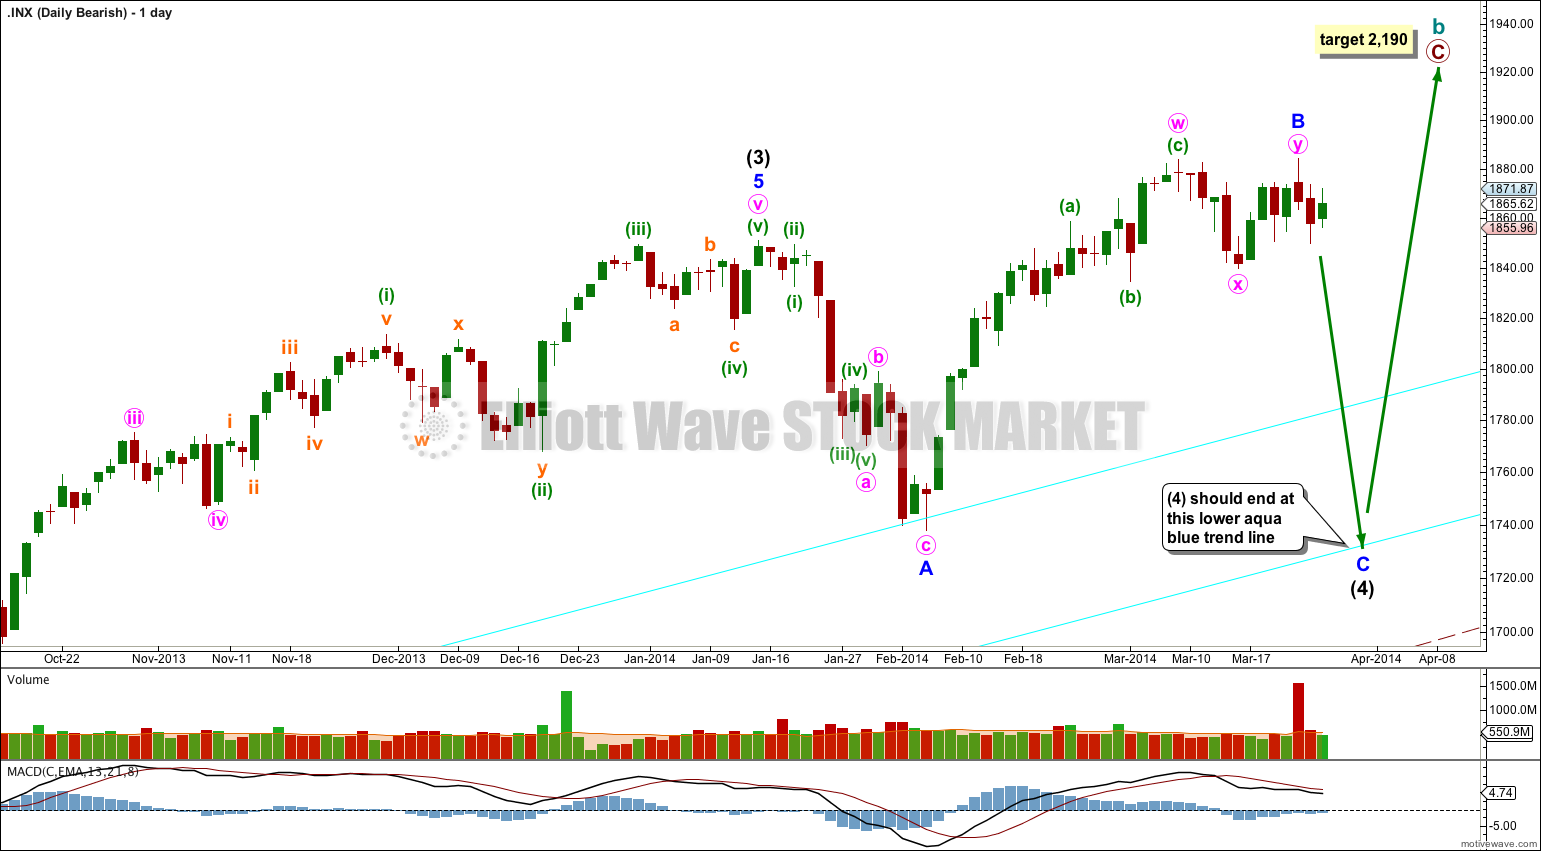
This bearish wave count expects that the correction was not over at 666.79, and that may have been just cycle wave a of a huge expanded flat for a super cycle wave II. Cycle wave b upwards is a close to complete zigzag.
Within flat corrections the maximum common length of B waves in relation to A waves is 138%. So far cycle wave b is a 141% correction of cycle wave a. For this reason only this wave count is an alternate.
Within primary wave C of the zigzag intermediate wave (4) would be incomplete.
The subdivisions for intermediate wave (4) would be the same as the main wave count for intermediate wave (2). I would expect it to end at the lower aqua blue trend line.
At 2,190 primary wave C would reach 1.618 the length of primary wave A. When intermediate wave (4) is complete I would recalculate this target at intermediate degree. I have found Fibonacci ratios between actionary waves (1, 3 and 5) of impulses are more reliable than between A and C waves within zigzags for the S&P500.
If intermediate wave (5) lasts about five to six months it may end about October this year.
Hi Lara. What are the chances that the triangle breaks to the downside as opposed to the upside?
That’s possible. The triangle could be subminuette wave (x) within a combination for minute wave x. But x waves rarely subdivide into multiples themselves.
It could not be a B wave within a flat because it would not end low enough to be 90% the length of the a wave.