
Price has moved sideways in a very small range to complete a small red doji. Because a slight new high was made the wave count is changed slightly.
Summary: The situation is unclear but in the bigger picture I still favour the idea that we should see overall downwards movement for about three weeks. Downwards movement should find support at the lower of the two aqua blue trend lines on the daily charts. In the short term I expect one final upwards push tomorrow to 1,880 before a trend change at minor degree.
This analysis is published about 6:30 p.m. EST. Click on charts to enlarge.
Bullish Wave Count.
The aqua blue trend lines are critical for all wave counts. Draw the first trend line from the low of 1,158.66 on 25th November, 2011 to the next swing low at 1,266.74 on 4th June, 2012. Create a parallel copy and place it on the low at 1,560.33 on 24th June, 2013. While price remains above the lower of these two aqua blue trend lines we must assume the trend remains upwards. This is the main reason for the bullish wave count being my main wave count.
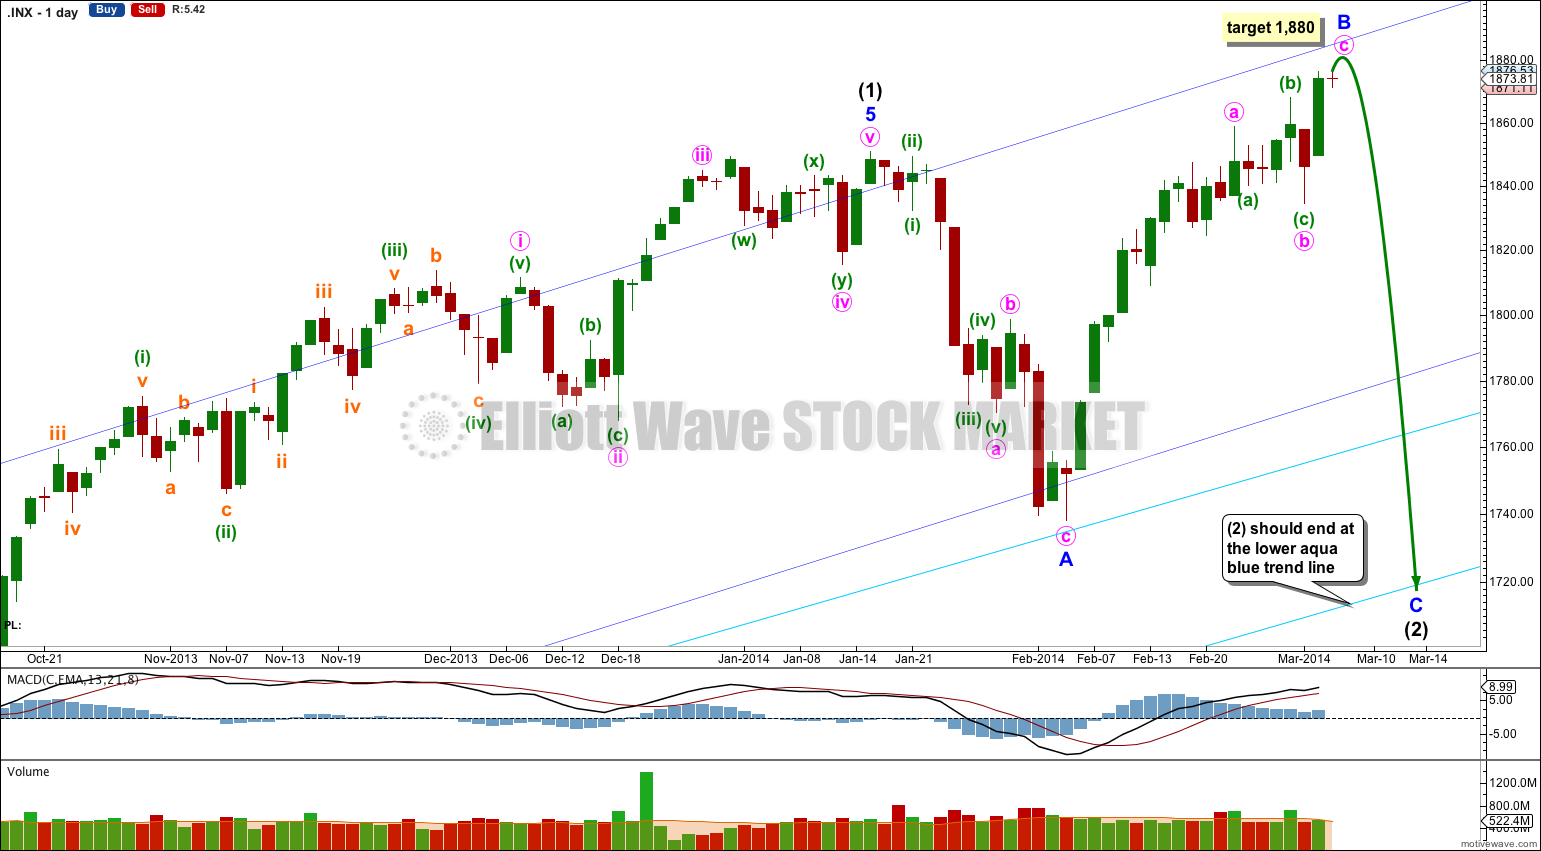
This bullish wave count expects a new bull market began at 666.79 for a cycle wave V. Within cycle wave V primary waves 1 and 2 are complete. Within primary wave 3 intermediate wave (1) is complete at 1,850.84. Intermediate wave (2) is most likely continuing as an expanded flat correction.
Intermediate wave (2) should find strong support at the lower of the two aqua blue trend lines. Minor wave A lasted 14 days and minor wave B lasted 16 days. I would expect minor wave C to be of a similar duration and to last about three weeks in total.
For this bullish wave count when intermediate wave (2) is complete then very strong sustained upwards movement would be expected as an intermediate degree third wave within a primary degree third wave upwards unfolds.
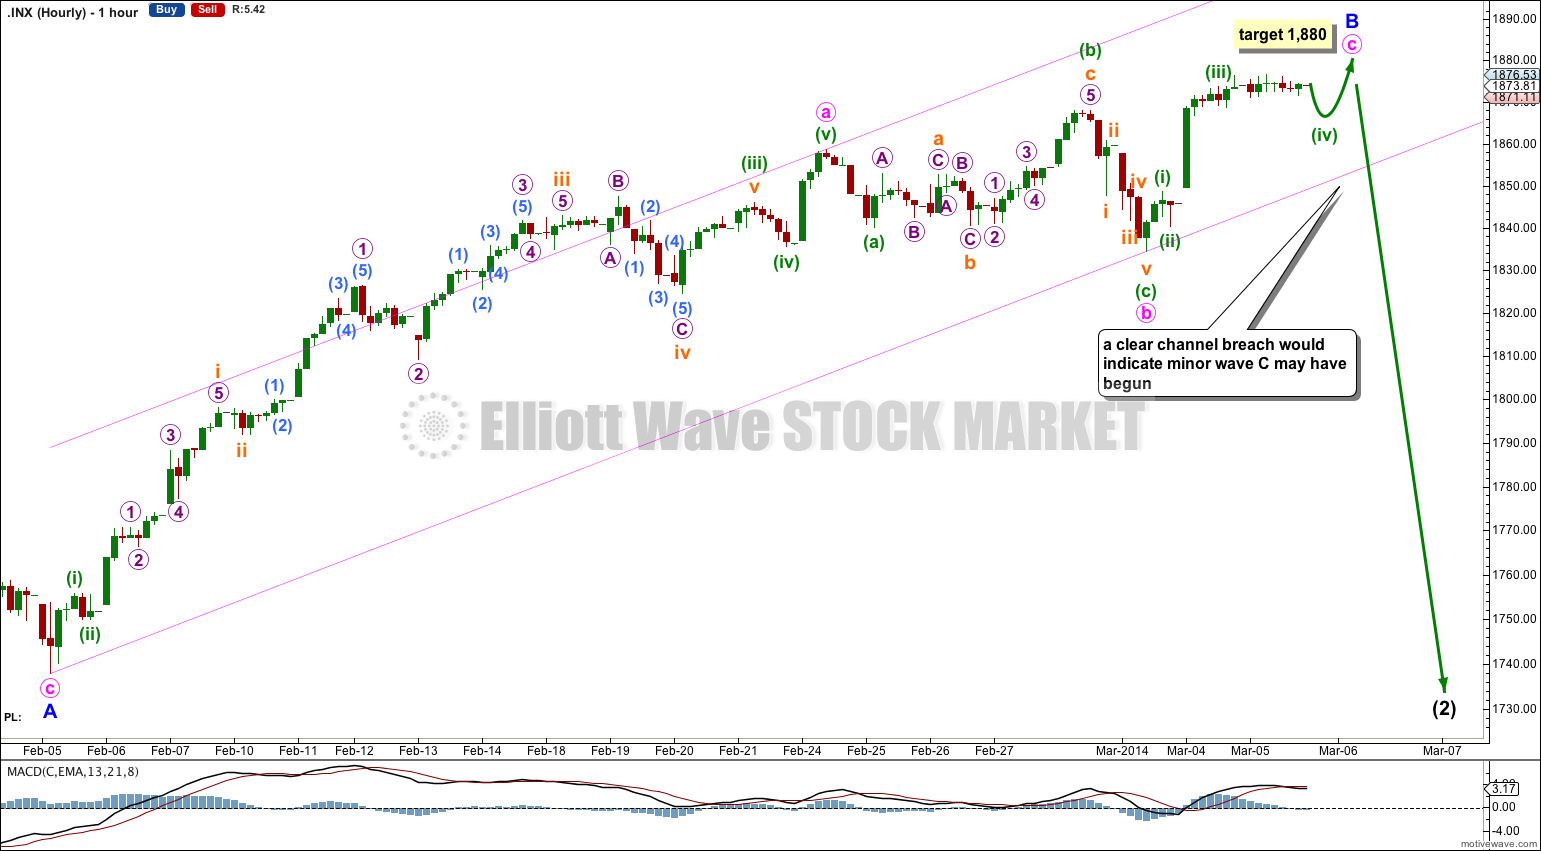
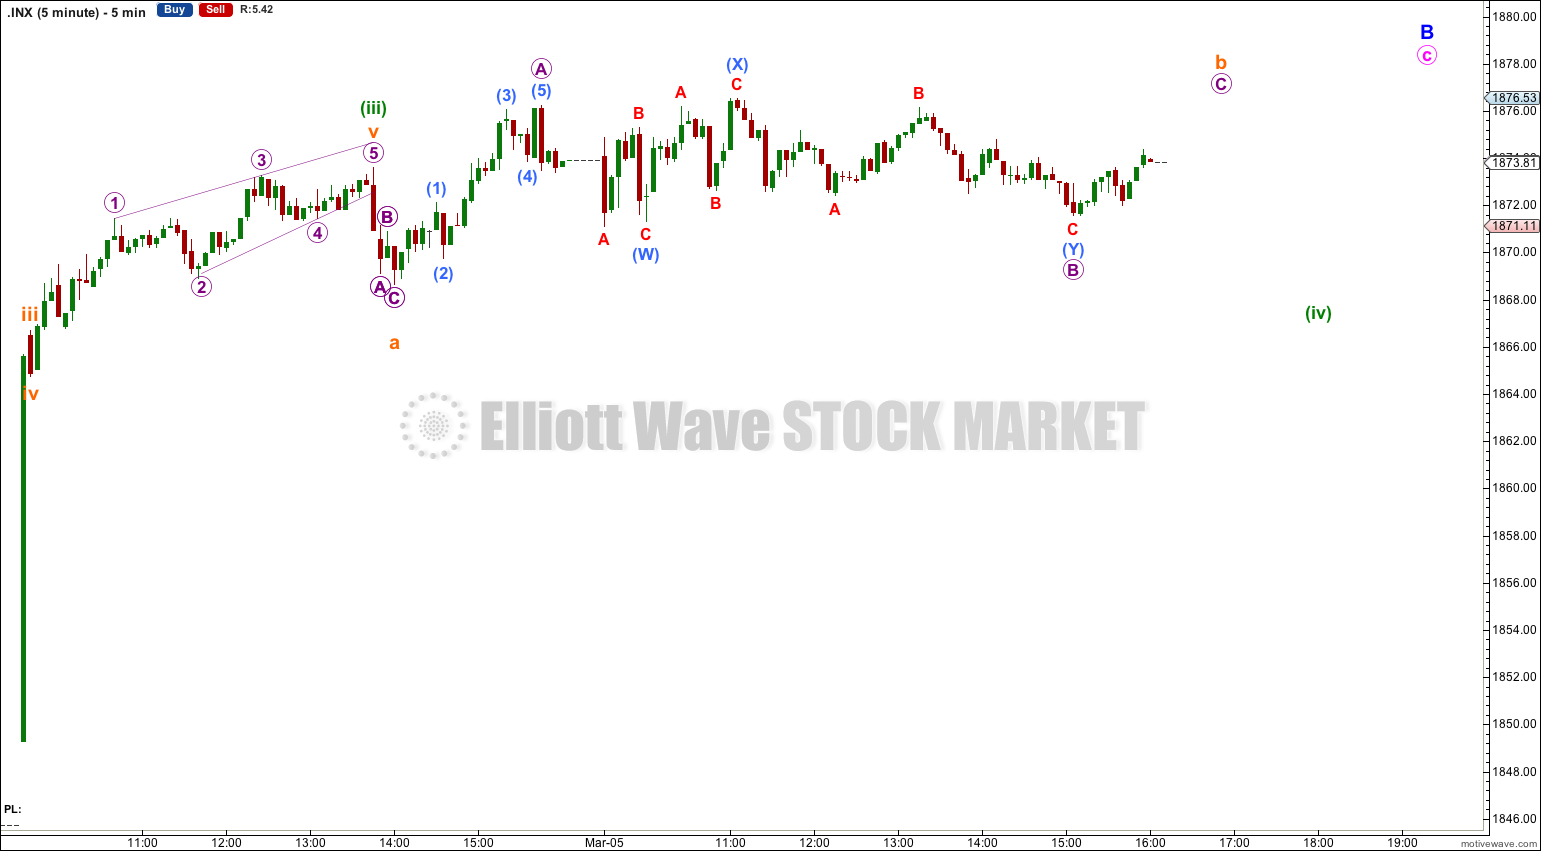
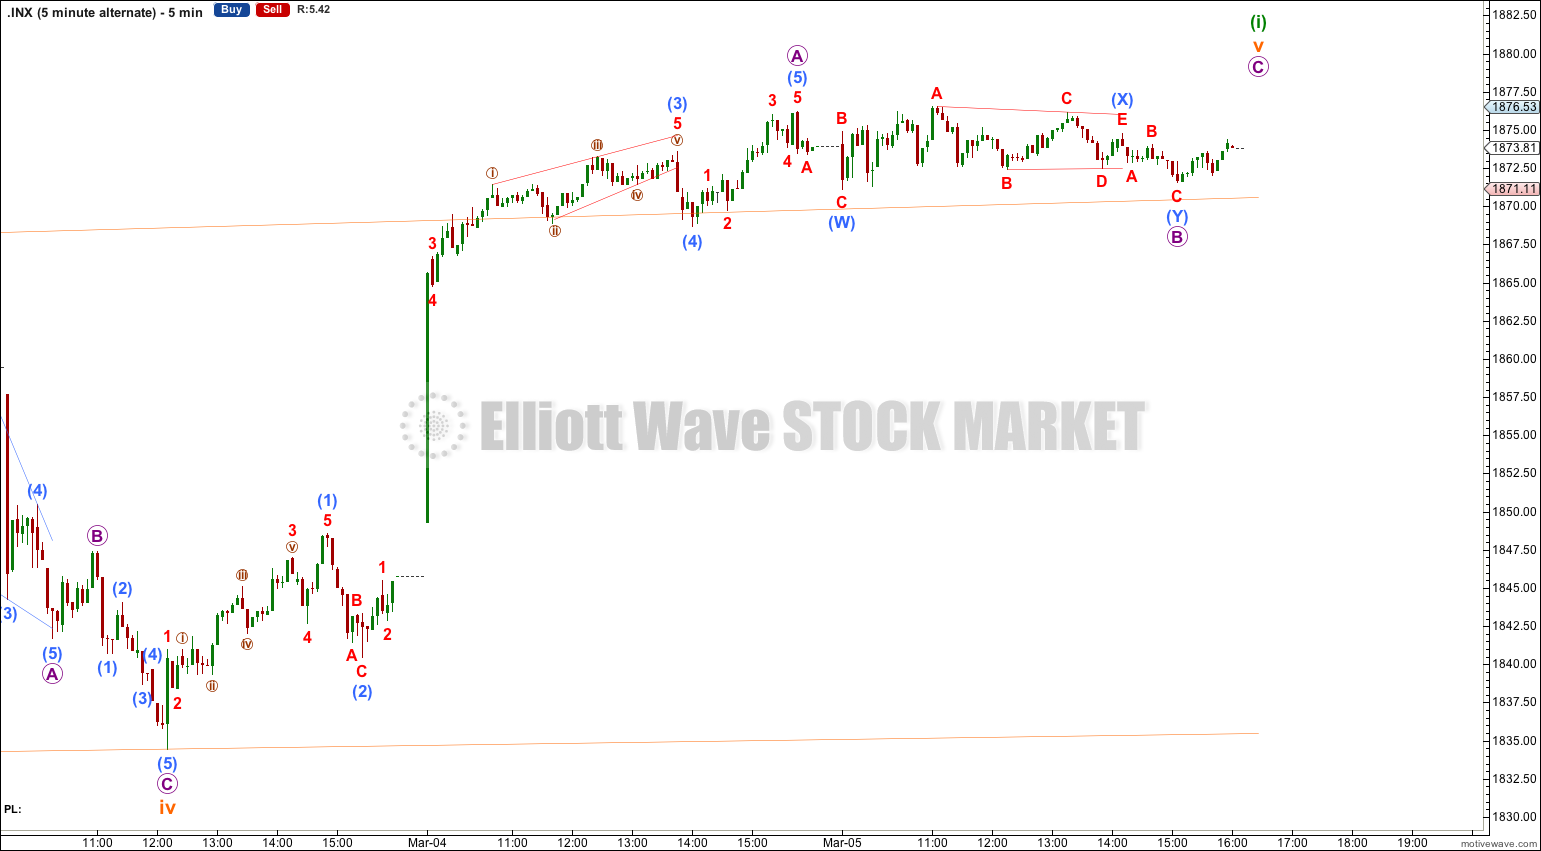
A slight new high was made in very choppy overlapping sideways movement. I have looked for a triangle in this movement and it does not fit. I expect this is a continuation of minuette wave (iv) as a double combination, and this fits on the five minute chart.
On the five minute chart it looks likely that minuette wave (iv) is incomplete. It may end early during tomorrow’s session with a little downwards movement. I would not expect it to move much lower as the purpose of combinations is to move price sideways and take up time.
When minuette wave (iv) is complete I would expect a little upwards movement for a final fifth wave. At 1,880 minute wave c would reach 0.382 the length of minute wave a.
I would expect minor wave B to remain contained within the pink channel drawn here using Elliott’s technique for a correction. When this pink channel is clearly breached on the hourly chart with downwards movement we shall have an early indication that minor wave B may then be over and minor wave C downwards may be underway.
Minuette wave (iv) may not move into minuette wave (i) price territory below 1,848.54.
Alternate Bullish Wave Count.
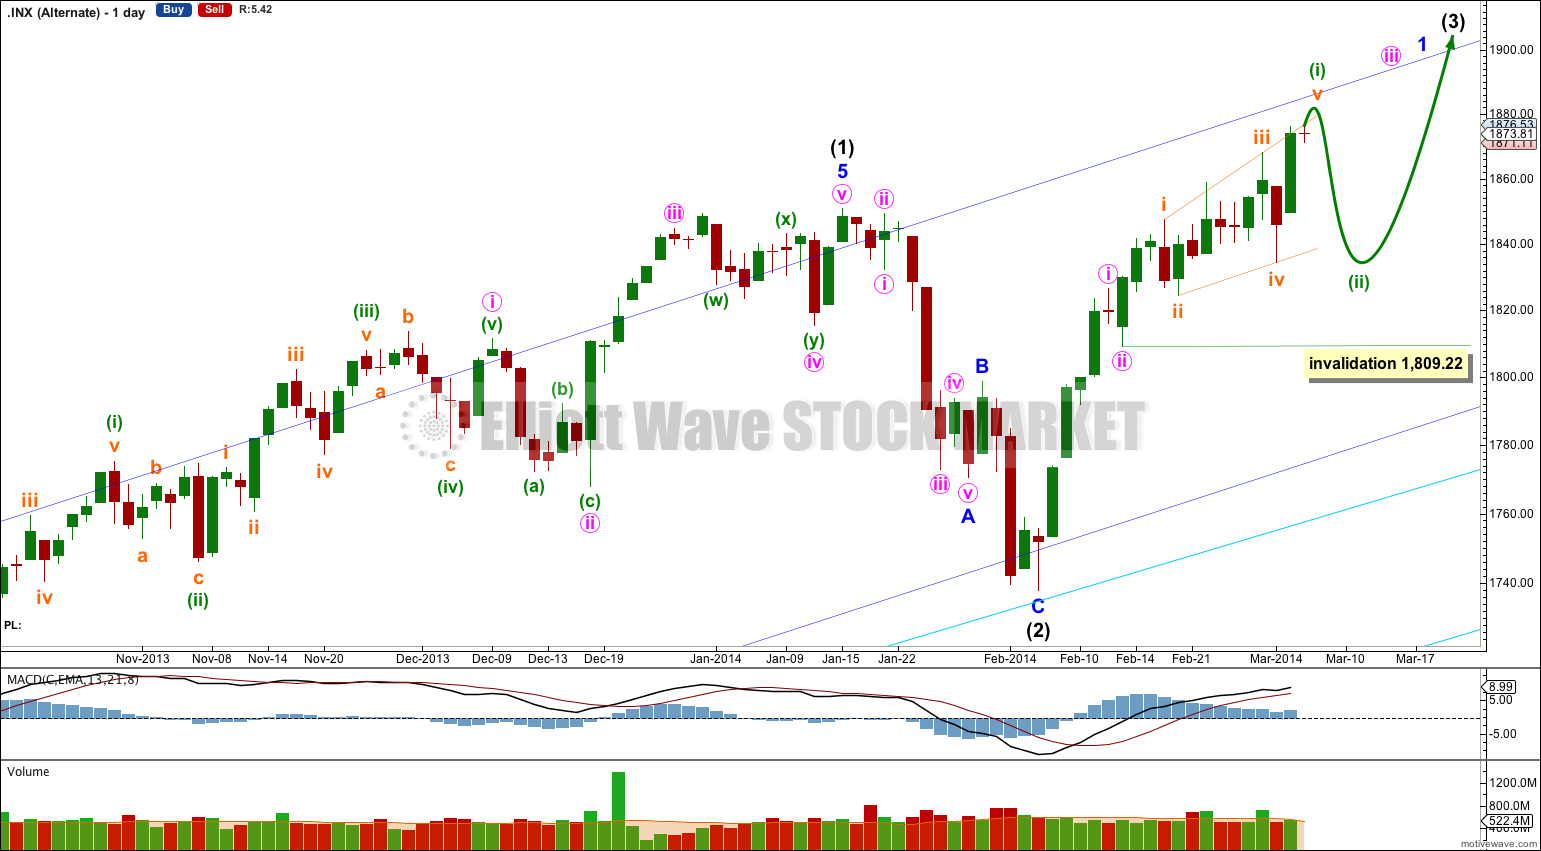
This wave count reverts to the idea that intermediate wave (2) may be over. However, if it is over there it would have been a remarkably brief correction for intermediate degree and it would not have breached the channel which contains intermediate wave (1). For these two reasons this wave count has a lower probability and is an alternate.
If intermediate wave (3) has begun then within it minor wave 1 is unlikely to be complete.
Within minor wave 1 minute wave i may be a complete impulse, minute wave ii a complete brief zigzag, and minute wave iii may have just begun with a leading expanding diagonal.
Minuette wave (ii) may not move beyond the start of minuette wave (i). This wave count is invalidated with movement below 1,809.22.
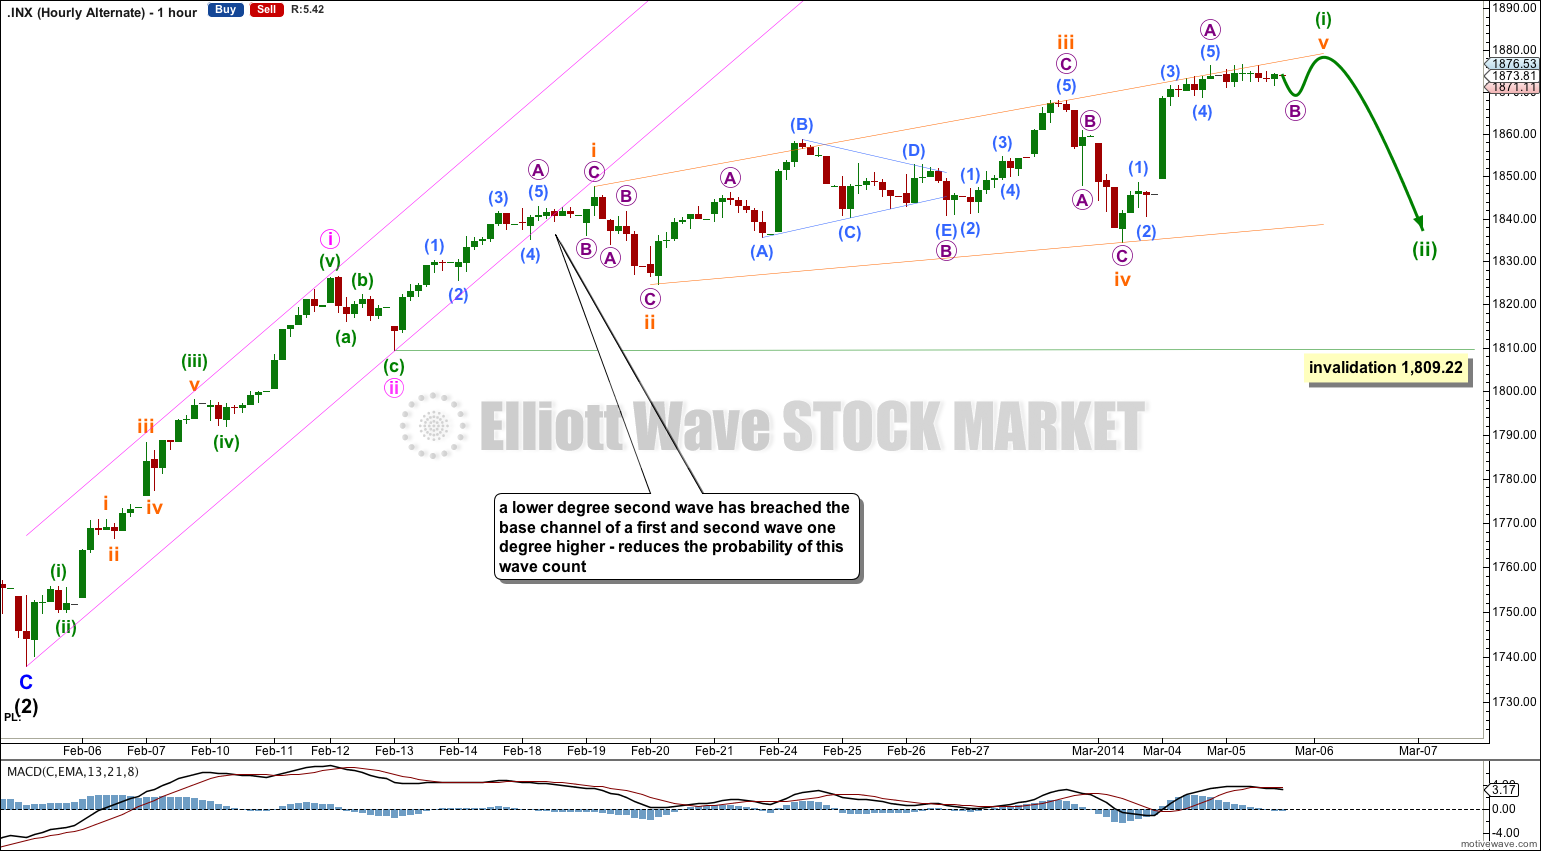
The pink base channel drawn about minute waves i and ii is very clearly breached to the downside. This is unusual and reduces the probability of this alternate wave count.
The diagonal is expanding. Within it subminuette wave v may be an incomplete zigzag, and so the diagonal may be leading or ending. This wave count sees it as leading.
Following a leading diagonal in a first wave position the second wave is most often very deep. Minuette wave (ii) should be deep but may not move below the start of minuette wave (i) below 1,809.22.
On the five minute chart it is possible to see a small barrier triangle within today’s sideways movement. This may be correct, but it does not have a very good look. The A-C trend line is too flat. Either way this sideways movement is a combination or of some description and it is most likely incomplete.
Bearish Alternate Wave Count.
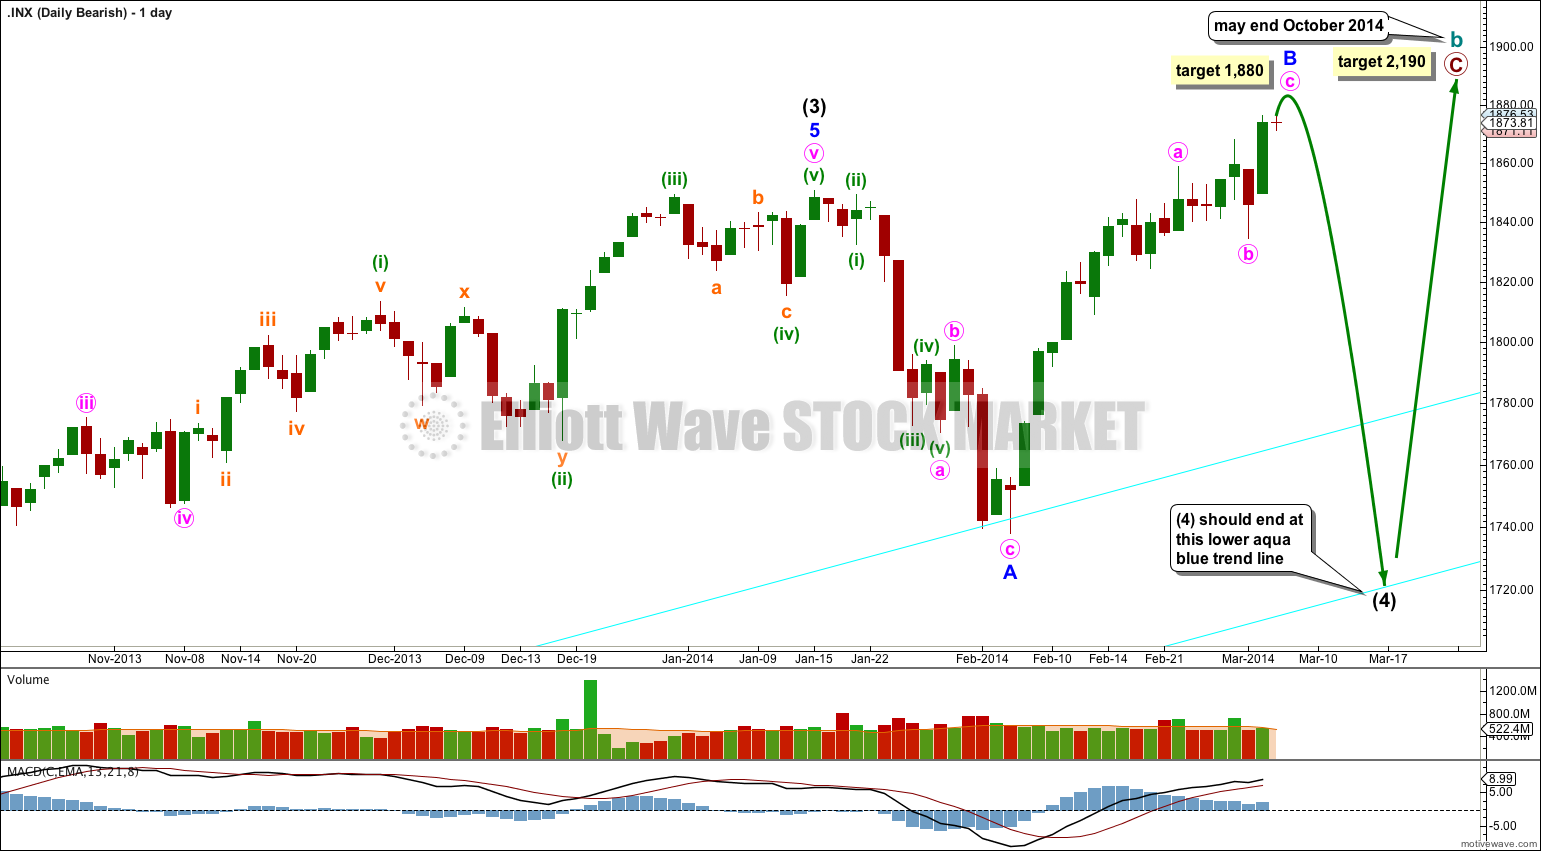
This bearish wave count expects that the correction was not over at 666.79, and that may have been just cycle wave a of a huge expanded flat for a super cycle wave II. Cycle wave b upwards is a close to complete zigzag. Within primary wave C of the zigzag intermediate wave (4) would be incomplete.
The subdivisions for intermediate wave (4) would be the same as the main wave count for intermediate wave (2). I would expect it to end at the lower aqua blue trend line.
At 2,190 primary wave C would reach 1.618 the length of primary wave A. When intermediate wave (4) is complete I would recalculate this target at intermediate degree. I have found Fibonacci ratios between actionary waves (1, 3 and 5) of impulses are more reliable than between A and C waves within zigzags for the S&P500.
If intermediate wave (5) lasts about five to six months it may end about October this year.
Hi Lara,
In nate’s marketanalysis 3 possibilities are covered for wave starting from 1733
1. A-B-C correction ending @1880
2. Impulse with 2 at 1834 and 3rd wave in progress.
3. A double zig zag of W-X-Y where X ended at 1834 and (a) of Y is complete
I think 1,2 are addressed in your analysis. Could you please cover “double zig zag” scenario with some targets.
I just want to make sure nothing is missed out. Currently I’m short on SPX and your advise would be a great value addition to my trading.
Thx
I think SPX is manipulated a lot to get technicals right. Dow is giving a much better picture of Laras original bearish count.
Watch what happens every single day with the USD/JPY carry trade, it’s like clockwork. Also, daily QE in the billions is rigging the game. Lara does analysis through honesty but the game is sadly rigged. Manipulation until the whole charade comes crashing down.
I know this is actually a somewhat popular idea, but it’s not one that fits an Elliott wave view.
This is really unpopular, but I think that QE and the flow of money is part of social mood. That this upwards push may well be a “last gasp” fueled by unsubstantiated optimism and blind hope. Continuing QE is (to me at least) completely unsustainable. Infinite growth on a finite planet is mathematically impossible and with the global economy reliant upon growth it must crash. QE just looks like it is pumping more $$ into the financial sector, not the productive sector, and it’s just delaying the inevitable. I wonder if this means that if a crash comes within my lifetime that this will just make it worse?
I see the manipulation that you see as part of the pattern.
I think at the end of the day you and I are mostly saying the same thing, we just see it from different angles.
I know many members will disagree with much of what I have written here, and that’s okay. And maybe I’m wrong. The only bit I’m certain of is the math; it is impossible to have perpetual growth in a finite space, and our growth is exponential (it’s at a %) so it’s quite impossible to sustain.
I’m not quite sure how to respond to this request.
I have no problem with a question asking me what I think about a particular idea. But I do have a problem with someone telling me to do a specific wave count and provide targets for that.
The difference is important.
I’ll consider the idea. But I’m only going “cover” it and provide a wave count using it if I think it fits.