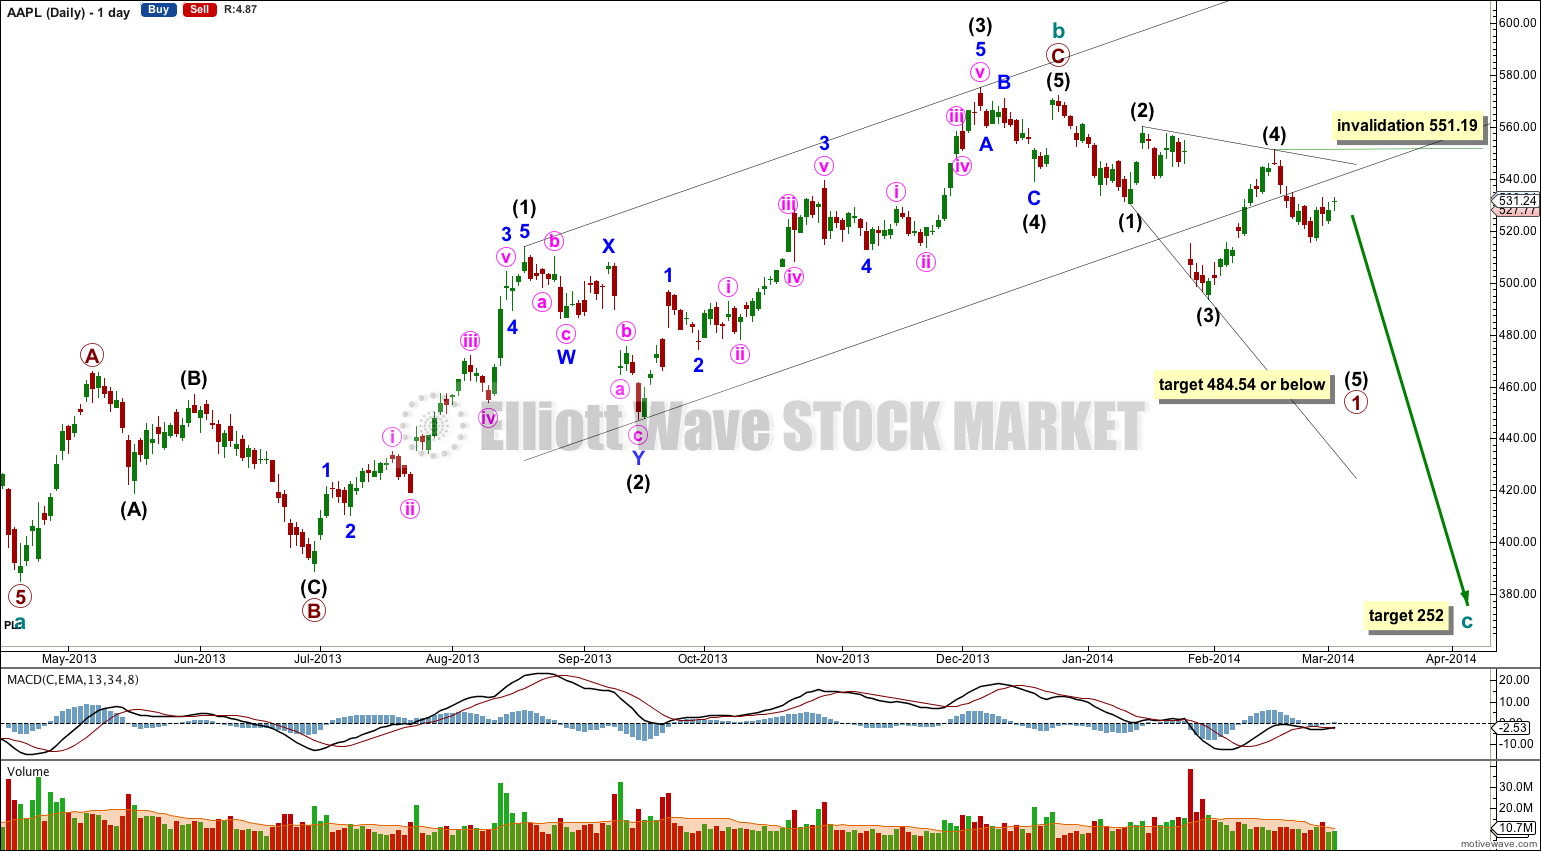
Last analysis of AAPL on 19th February, expected more downwards movement which is what has happened so far. The target has not been met and the structure is incomplete.
Click on charts to enlarge.
Within the bigger picture this wave count sees AAPL in a super cycle zigzag correction which is just over two thirds completed.
Within the zigzag cycle wave b ended at 571.88 with a small truncation in the final fifth wave up.
At this stage I expect a big leading expanding diagonal is unfolding for a first wave at primary degree.
Within the leading diagonal intermediate wave (2) is a 72% correction of intermediate wave (1), and intermediate wave (4) is a 86% correction of intermediate wave (3).
I would expect intermediate wave (5) to be longer than intermediate wave (3) and to reach down to 484.54 or below.
I had expected (two weeks ago) this target should be met in about two to three weeks. Downwards movement is slow and so the target may be yet another three weeks away.
Intermediate wave (1) lasted 12 days, and intermediate wave (3) lasted 11 days. So far intermediate wave (5) has lasted 10 days. It may end in another 5 to 15 days, as I would expect it to be longer in both price and duration than intermediate wave (3).
Within intermediate wave (5) no second wave nor B wave may move beyond the start of the first or A wave. This wave count is invalidated with movement above 551.19.
At 252 cycle wave c would reach equality in length with cycle wave a. This target is about one year away.


Hi Lara,
Does Apple still look like it’s headed lower?
Yes.
to me it makes more sense that uptrend continues since main waves 1 and 2 have completed and wave 3 has started.
Could it be that your wave count is off target, wrong?
your leading diagonal is beginning to look strange …
Just saying
I most certainly could be wrong. There is no way I’ll always be right and the probability that I’ll be wrong sometimes is 100%.
Do you see a third wave up beginning? A chart of your idea would be helpful. I’m struggling to see what you are saying.
So far this possible leading diagonal actually looks pretty typical. I don’t have a problem with it.
Dear Lara,
Trading AAPL has been frustrating lately. It appears to me that AAPL did 5 waves down (on the hourly chart) from the high of 539.66 last week to the low of 523 on Fri. Then on Mon it appears that it started an ABC corrective move upwards, with A (523-529.90; two days) and B (529.90-525.20; two days) complete. We are currently in wave C (upside target of 535???) on the hourly chart. Is this analysis correct? Do you still think that we will hit your target of 485 in the coming 2-3 weeks? I would greatly appreciate an update.
Thank you in advance!
That sounds right. That’s pretty much what my wave count would be. It sounds like you don’t need my help with this!
Yes. My target is the same.
or does it look more like a double three where w = zigzag and y=expanded flat? If top was hit today near $532, ‘c’ was a perfect 1.618 * a for the expanded flat.
Dear Lara,
Your new analysis of AAPL is great, thank you! It looks like the upward correction is over (at 536.24) and now the downtrend resumes. How long do you think wave (iii) on the hourly chart will last to your 505 target?
I think it’s probably over now.
At the time of writing this reply price is finding support at the lower edge of the channel containing minute wave ii. We need to see a clear breach of that channel on the hourly chart to have confidence that minute wave iii is underway.