
Movement below 1,841.13 invalidated the first hourly wave count and confirmed the second. It looks likely now that the S&P 500 is still in an intermediate degree correction.
Summary: I expect overall downwards movement for about three weeks in total from the high of 1,867.92. For the bullish wave count the lower aqua blue trend line should provide strong support. If that trend line is clearly breached then the bearish wave count would be possible.
This analysis is published about 7:30 p.m. EST. Click on charts to enlarge.
Bullish Wave Count.
The aqua blue trend lines are critical for all wave counts. Draw the first trend line from the low of 1,158.66 on 25th November, 2011 to the next swing low at 1,266.74 on 4th June, 2012. Create a parallel copy and place it on the low at 1,560.33 on 24th June, 2013. While price remains above the lower of these two aqua blue trend lines we must assume the trend remains upwards. This is the main reason for the bullish wave count being my main wave count.

This bullish wave count expects a new bull market began at 666.79 for a cycle wave V. Within cycle wave V primary waves 1 and 2 are complete. Within primary wave 3 intermediate wave (1) is complete at 1,850.84. Intermediate wave (2) is most likely continuing as an expanded flat correction.
Intermediate wave (2) should find strong support at the lower of the two aqua blue trend lines. Minor wave A lasted 14 days and minor wave B lasted 16 days. I would expect minor wave C to be of a similar duration and to last about three weeks in total.
For this bullish wave count when intermediate wave (2) is complete then very strong sustained upwards movement would be expected as an intermediate degree third wave within a primary degree third wave upwards unfolds.
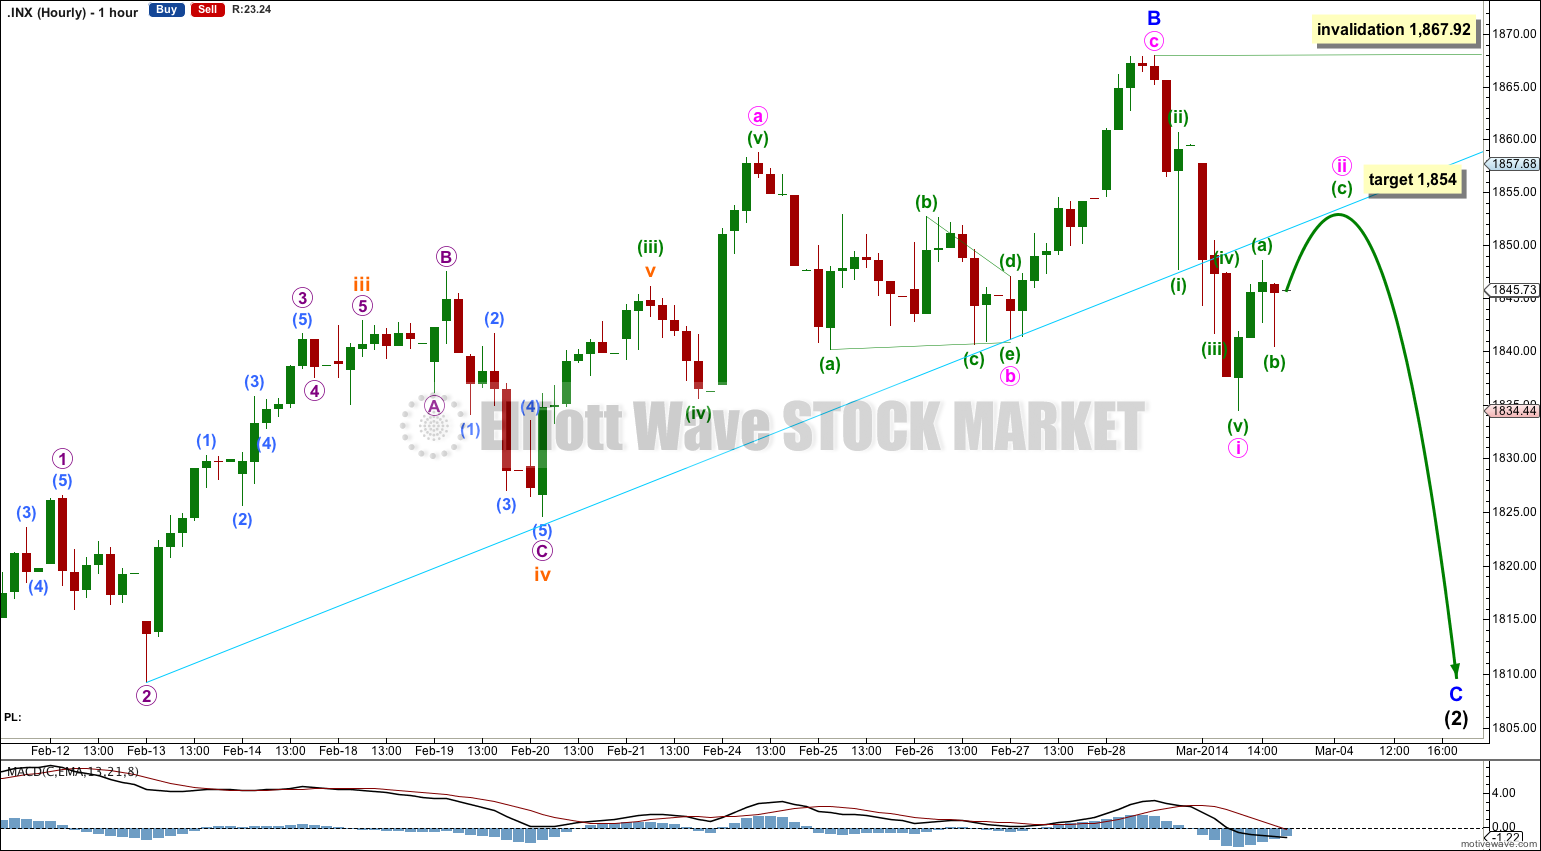
Minor wave B is a 115% correction of minor wave A. Minor wave C should find support at the lower of the two aqua blue trend lines.
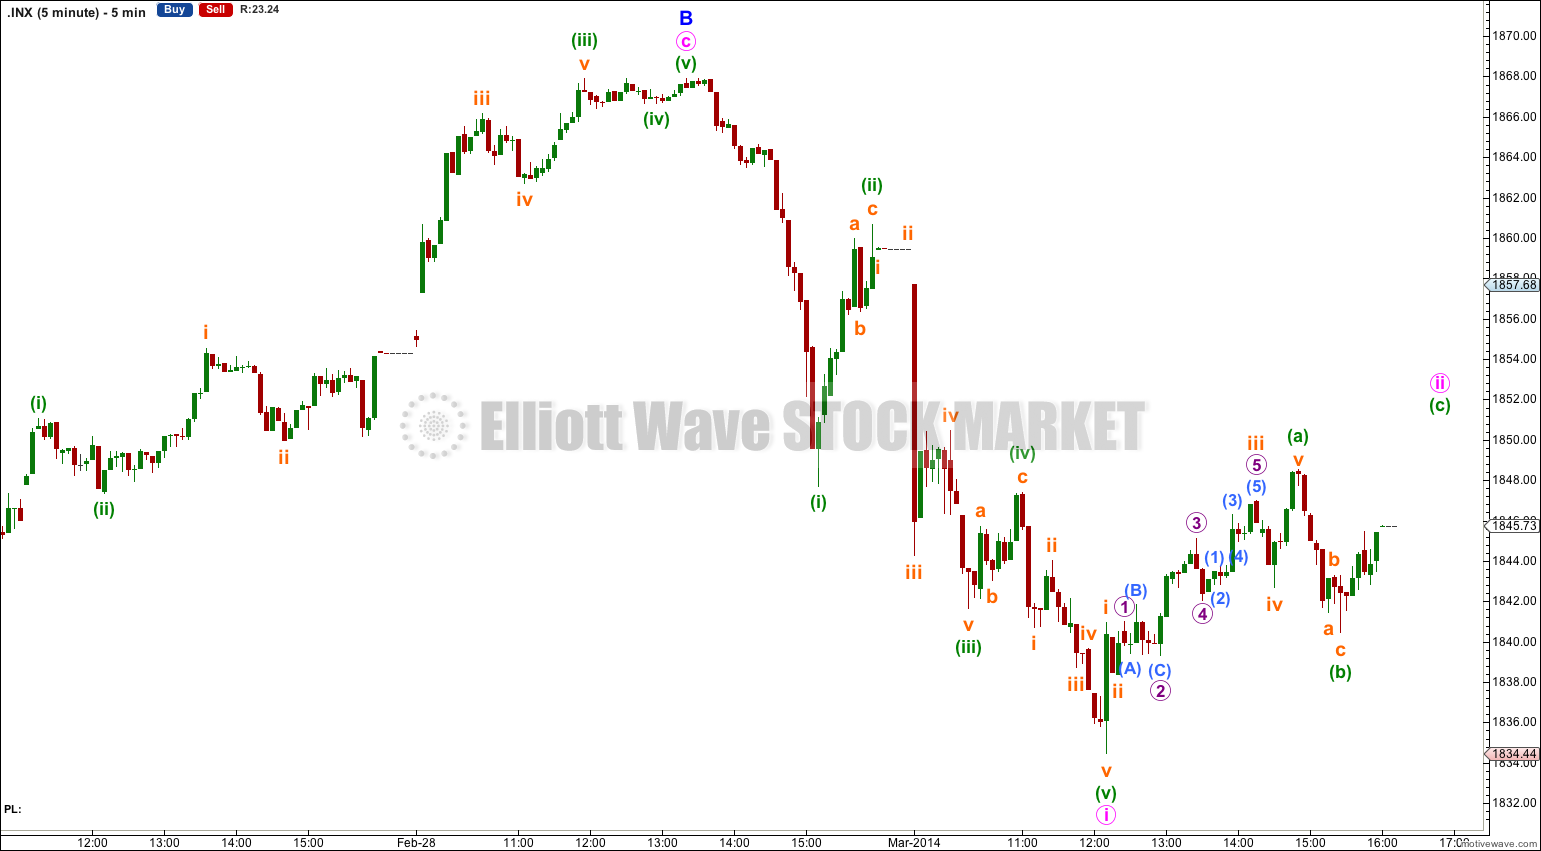
So far within minor wave C downwards there is a complete five wave structure for minute wave i. The following upwards correction for minute wave ii is incomplete on the five minute chart. I would expect it to move a little higher to start tomorrow’s session. At 1,854 minuette wave (c) would reach equality in length with minuette wave (a). Upwards movement should find resistance at the aqua blue trend line which previously provided support.
When minute wave ii is complete then I can calculate a target downwards for you for minute wave iii. I cannot do that today. I would expect minute wave iii to be about 54.17 points in length, 1.618 the length of minute wave i.
Minute wave ii may not move beyond the start of minute wave i. This wave count is invalidated with movement above 1,867.92.
Bearish Alternate Wave Count.
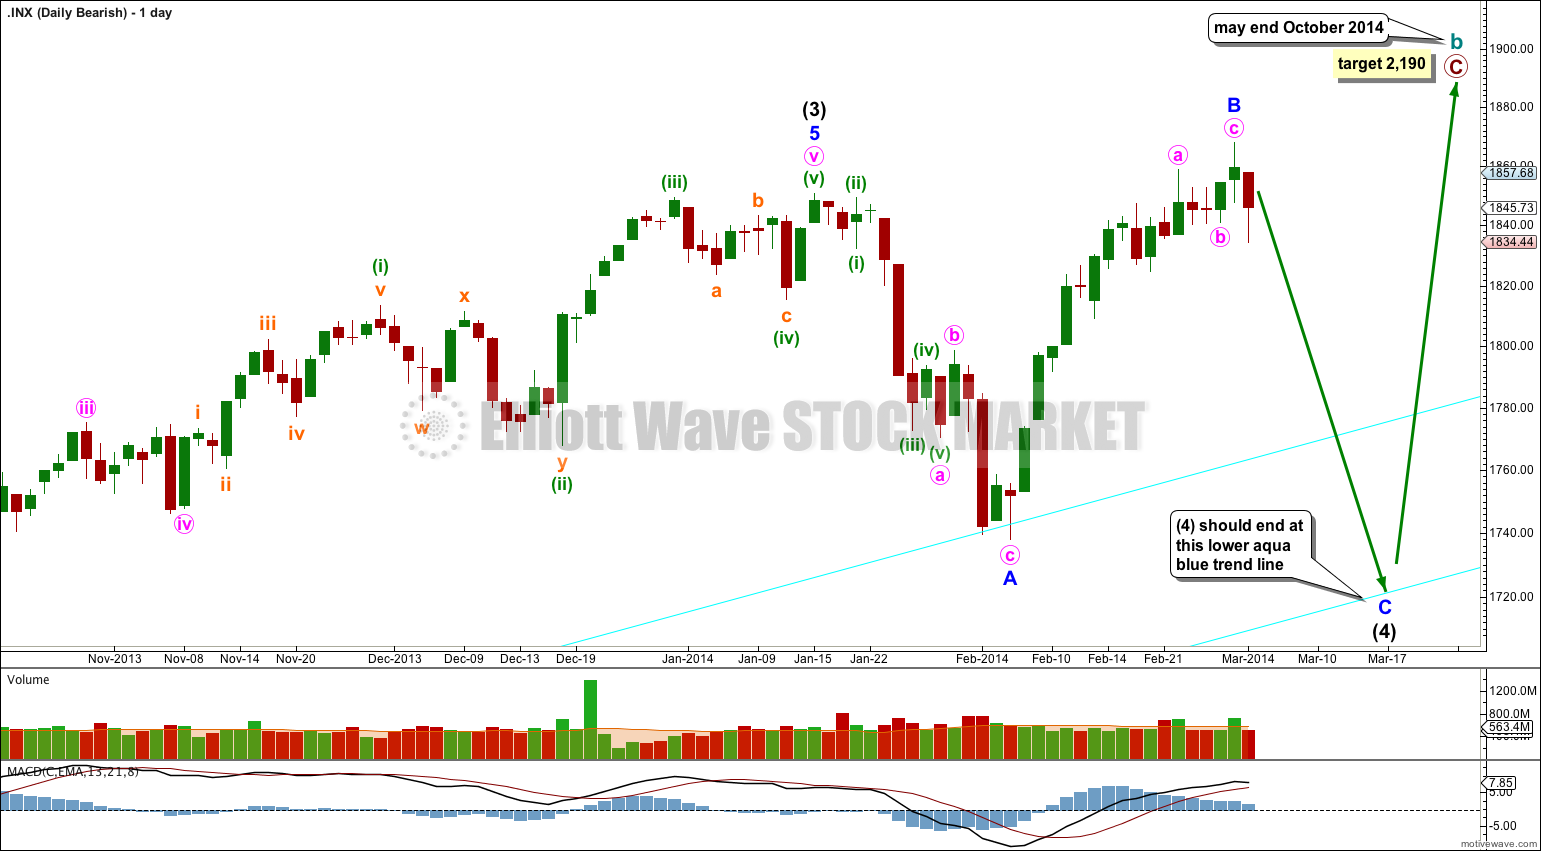
This bearish wave count expects that the correction was not over at 666.79, and that may have been just cycle wave a of a huge expanded flat for a super cycle wave II. Cycle wave b upwards is a close to complete zigzag. Within primary wave C of the zigzag intermediate wave (4) would be incomplete.
The subdivisions for intermediate wave (4) would be the same as the second bullish wave count for intermediate wave (2). I would expect it to end at the lower aqua blue trend line.
Thereafter, if intermediate wave (5) lasts about five to six months it may end about October this year.
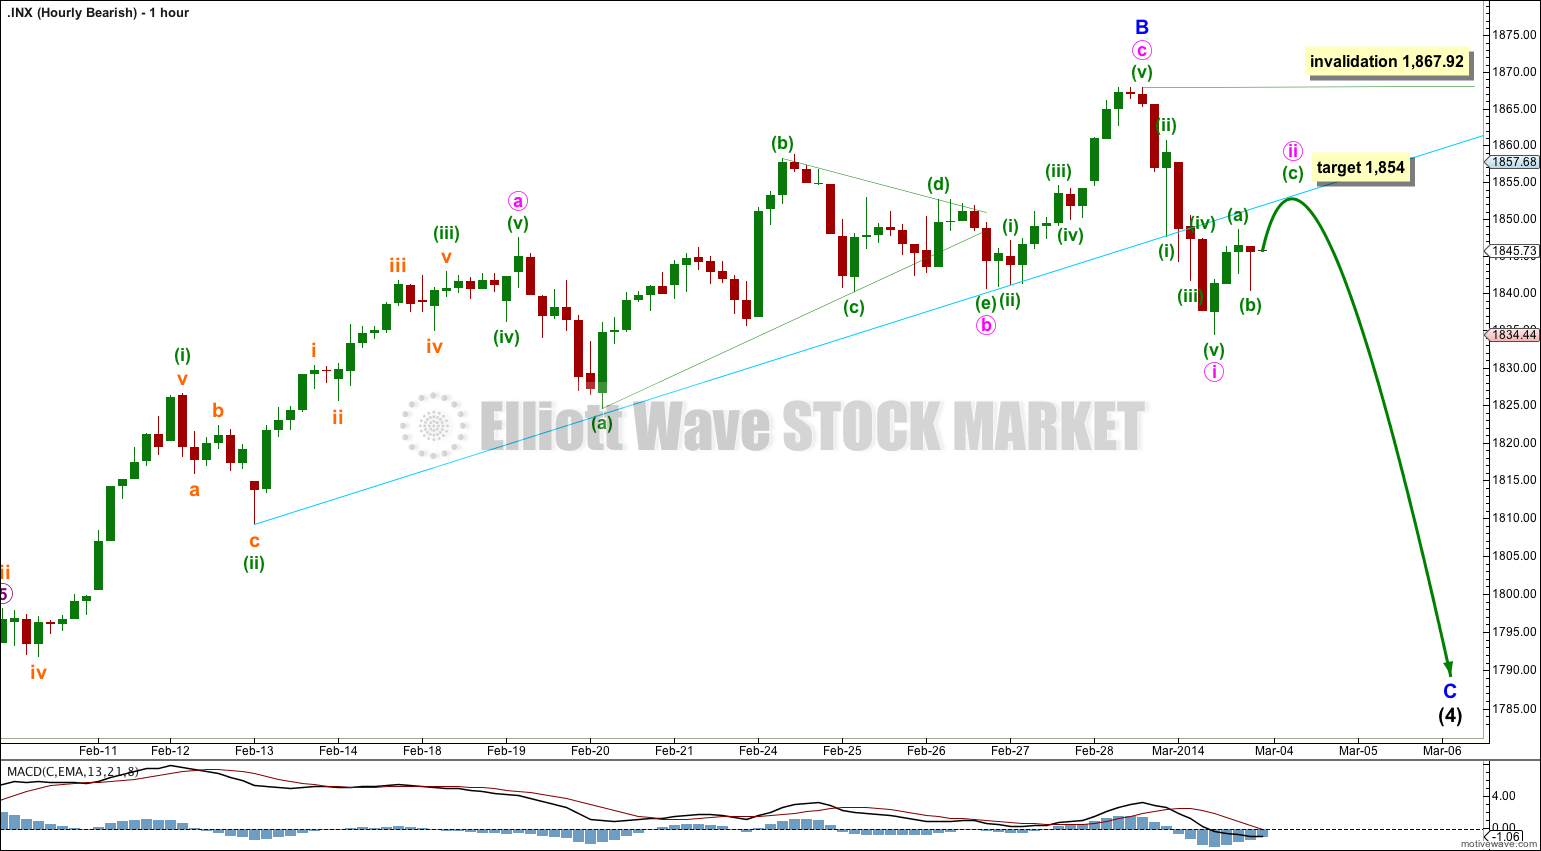
There is more than one way to see a possible triangle within the upwards movement labeled minor wave B. No matter how the subdivisions are seen within that movement with a clear breach of the aqua blue trend line which provided support I expect that the upwards wave is over and the next wave down is underway.
Thereafter, the subdivisions of the first downwards piece of movement are exactly the same. This bearish wave count does not diverge from the bullish wave count and may not diverge until the end of this year.
I’ve just charted it and it looks REALLY good for the S&P. Except… for one small problem.
The fifth wave on the S&P hits the 1-3 trend line indicating it should be over (the diagonal is expanding) at today’s high. But the problem is that upwards move subdivides as a five. Not a three.
Which indicates… a leading diagonal for a first wave… and we’re going higher with increased momentum.
The many possibilities are endless at this stage! How many charts shall I publish today? Probably too many for most and not enough for some 🙂
Steve, thanks for posting that chart. Yes, a cursory look at SPX sees it is possible. I’ll chart it and maybe use it today if it looks good.
I have another idea; that minute b was an expanded flat. That fits the subdivisions very nicely. And it has the same result as your chart above.
Hi Laura, is it possible that we are tracing out a Vodaphone Pattern similar to the one I´m posting here, for the S&P 500? From the look of the futures it looks like we are going to make a new all time high today on the S&P 500.
hi lara,
s&p 500 already hit 1867 in spot futures…
crazy markets!
I agree, crazy market. We are clearly in an impulsive upwards movement. Questions are:
1) is the correction on a minute level over or will we see a wave c downwards?
2) is the Feb. low (1737.92) an intermediate 2 (as one of Lara’s previous posts suggested)? If so, the target for Primary 3 would be 2917. A bit strange, which is why I think a recount is neccessary. But then again, I’m no expert…
I’m working on it. Yes. It’s a crazy market.
Looking at momentum, although today’s green candlestick is long and looks strong, it has not increase momentum beyond that seen earlier within this upwards wave. We still have classic technical divergence.
My initial response is this is the end of minor B.
And that aqua blue trend line on the hourly chart did not work 🙁
Hello Lara
Could this be start of a new wave 1 ?