
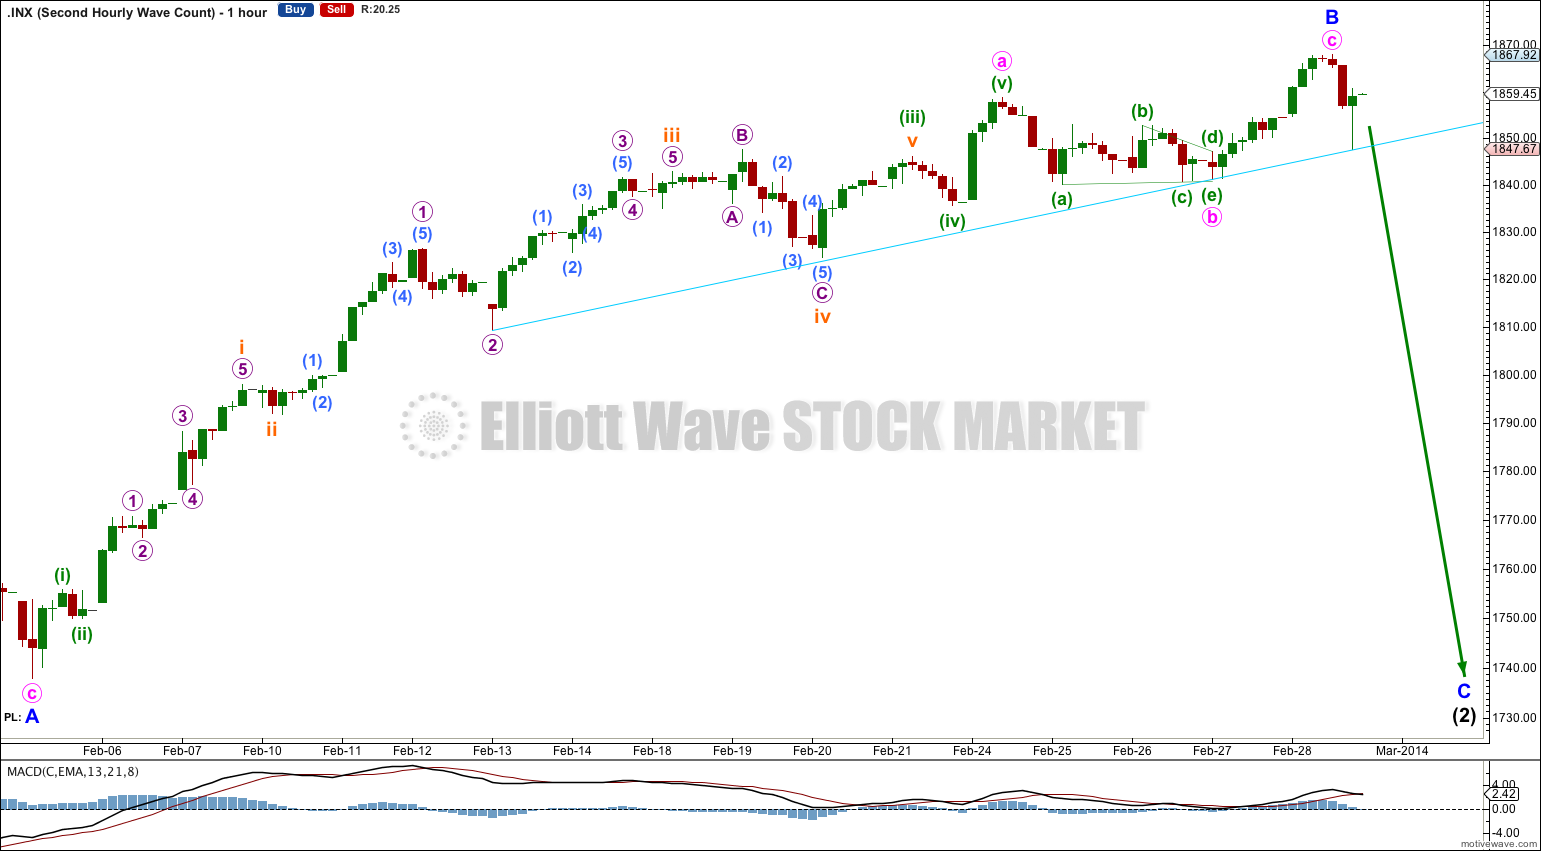
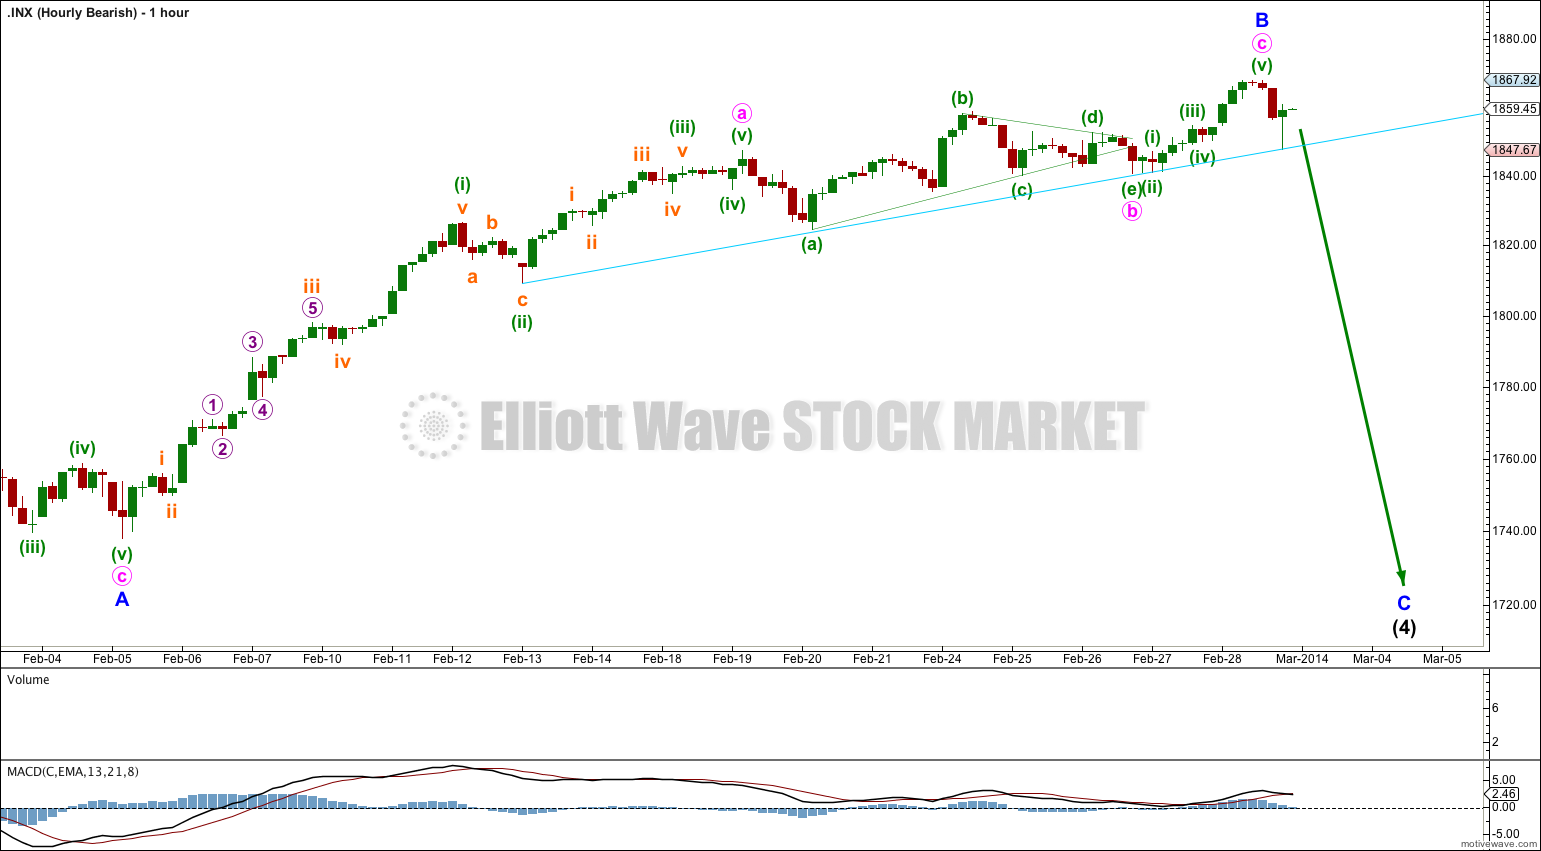
Movement above 1,858.71 invalidated the main hourly wave count and confirmed the alternate.
I have a new wave count for you this week.
Summary: The situation with the S&P 500 and DJIA is unclear. The only thing which looks clear at this stage is that recent upwards movement is lacking in momentum and is choppy and overlapping. At this stage I judge the first and second bullish wave counts to have about an even probability.
This analysis is published about 9:45 p.m. EST. Click on charts to enlarge.
Bullish Wave Count.
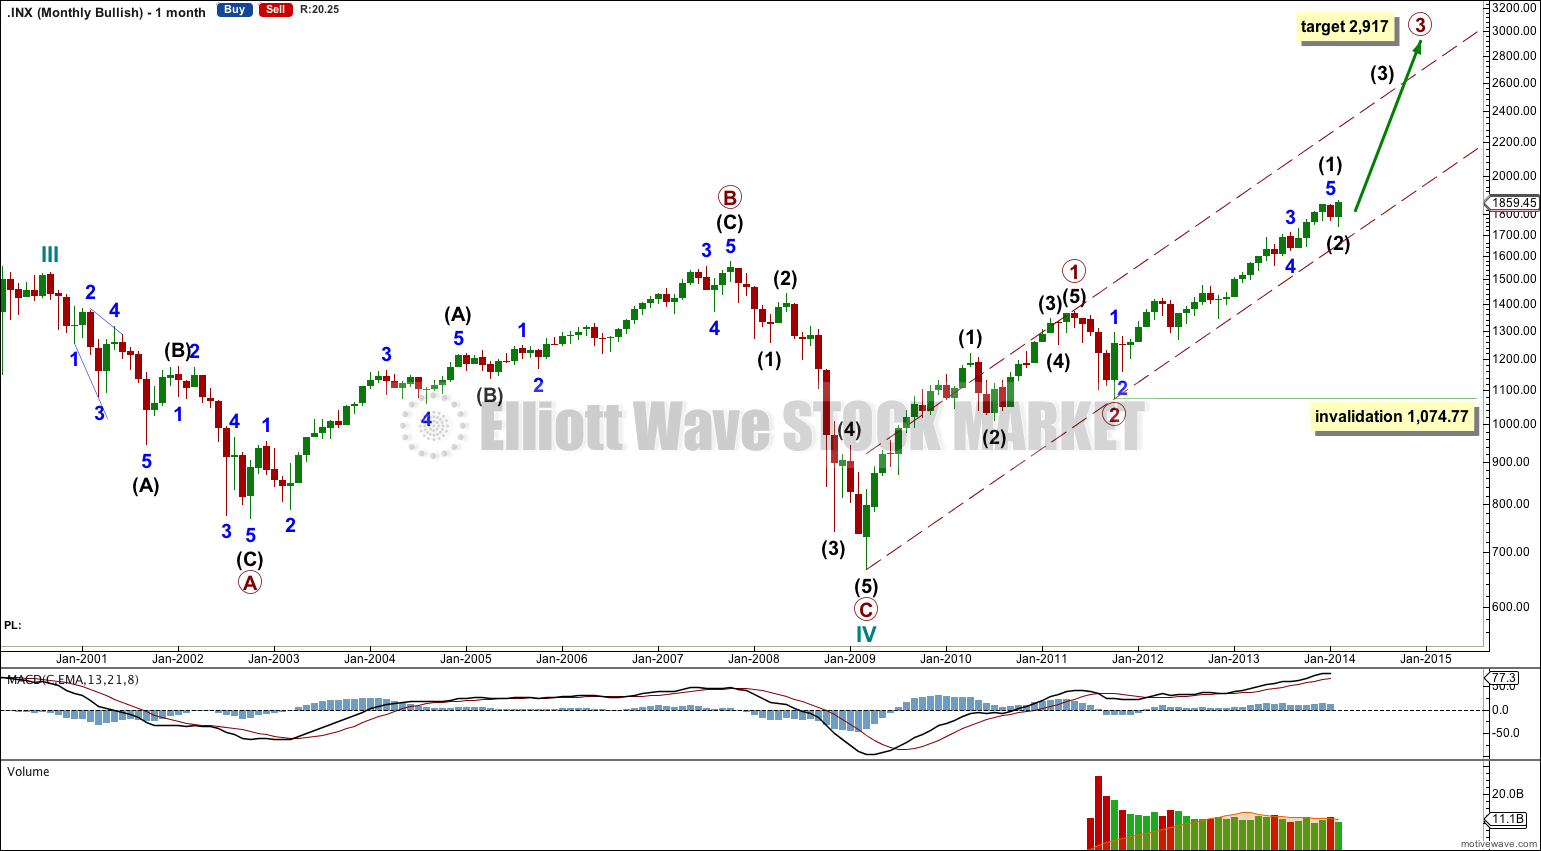
If the S&P is in a new bull market then the third wave has not yet reached its middle, let alone passed it. Primary wave 3 must move above the acceleration channel containing primary waves 1 and 2, and it should have done so by now.
Upwards momentum for primary wave 3 has increased beyond that seen for primary wave 1 which fits this wave count. Volume is lower which also fits for a third wave.
At 2,917 primary wave 3 would reach 2.618 the length of primary wave 1 and price would be above the acceleration channel.
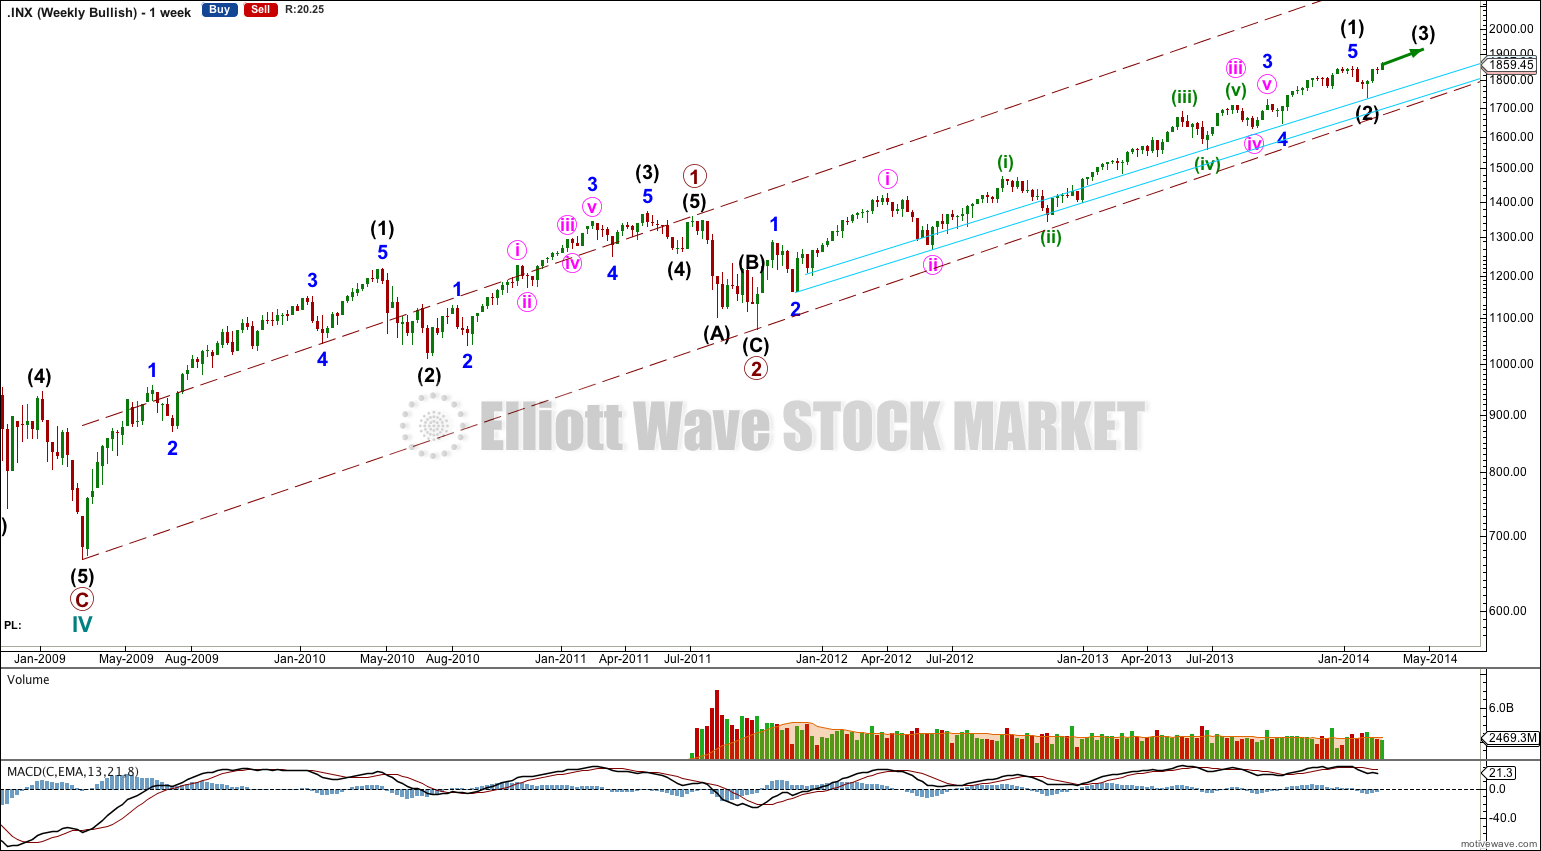
At the weekly chart level this wave count fits in terms of subdivisions, momentum and volume, but it does not move price above the acceleration channel. Within primary wave 3 I would have expected intermediate wave (1) to have moved above the acceleration channel.
If this wave count is correct then intermediate wave (3) must move above the acceleration channel and it should do that soon.
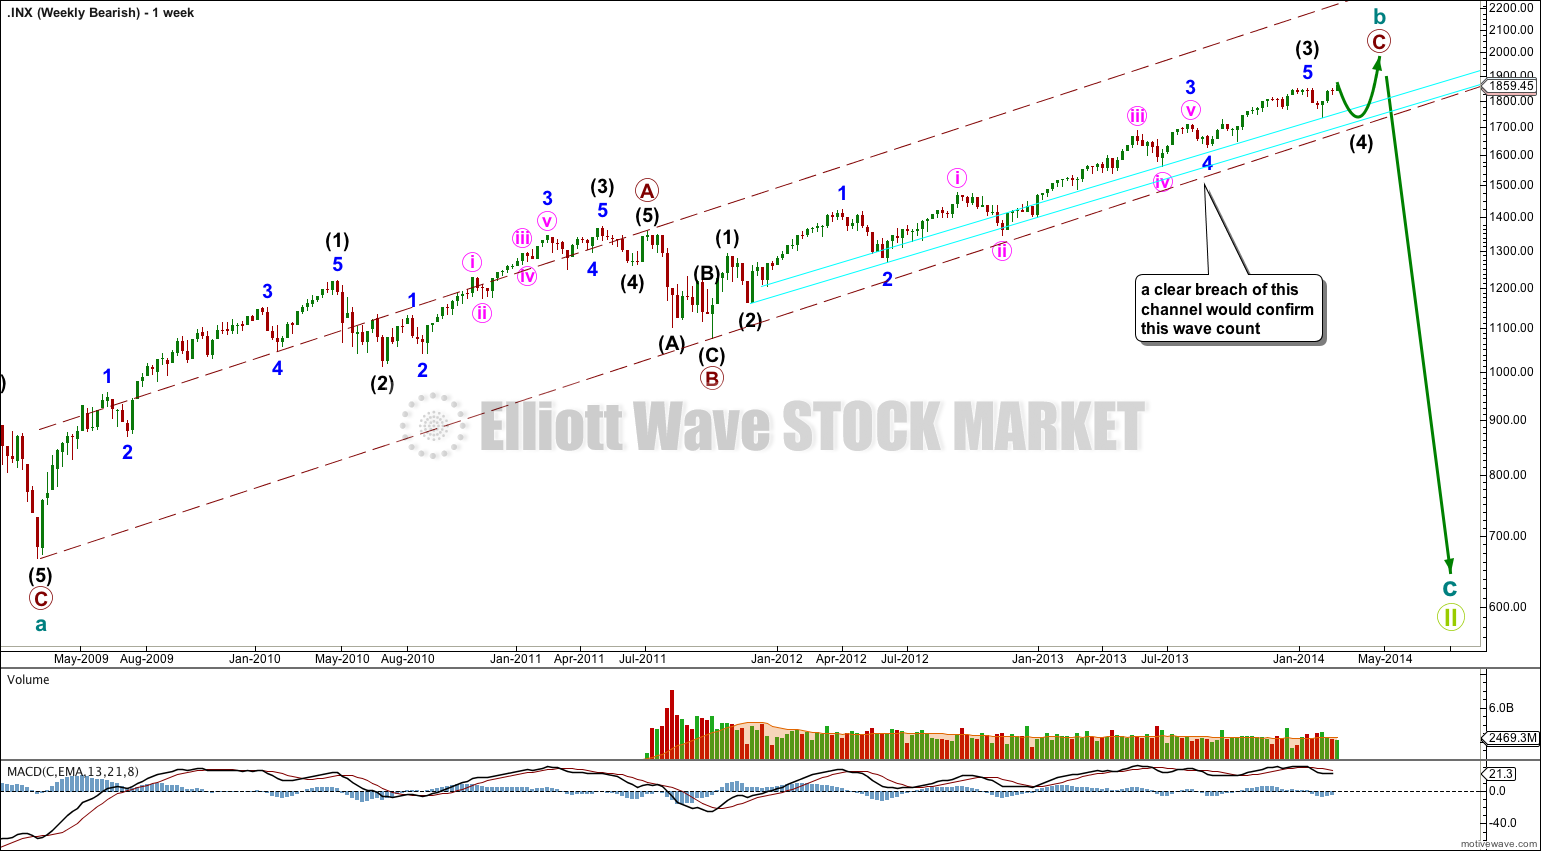
The aqua blue trend lines are critical for all wave counts. Draw the first trend line from the low of 1,158.66 on 25th November, 2011 to the next swing low at 1,266.74 on 4th June, 2012. Create a parallel copy and place it on the low at 1,560.33 on 24th June, 2013. While price remains above the lower of these two aqua blue trend lines we must assume the trend remains upwards. This is the main reason for the bullish wave count being my main wave count.
First Daily Bullish Wave Count.
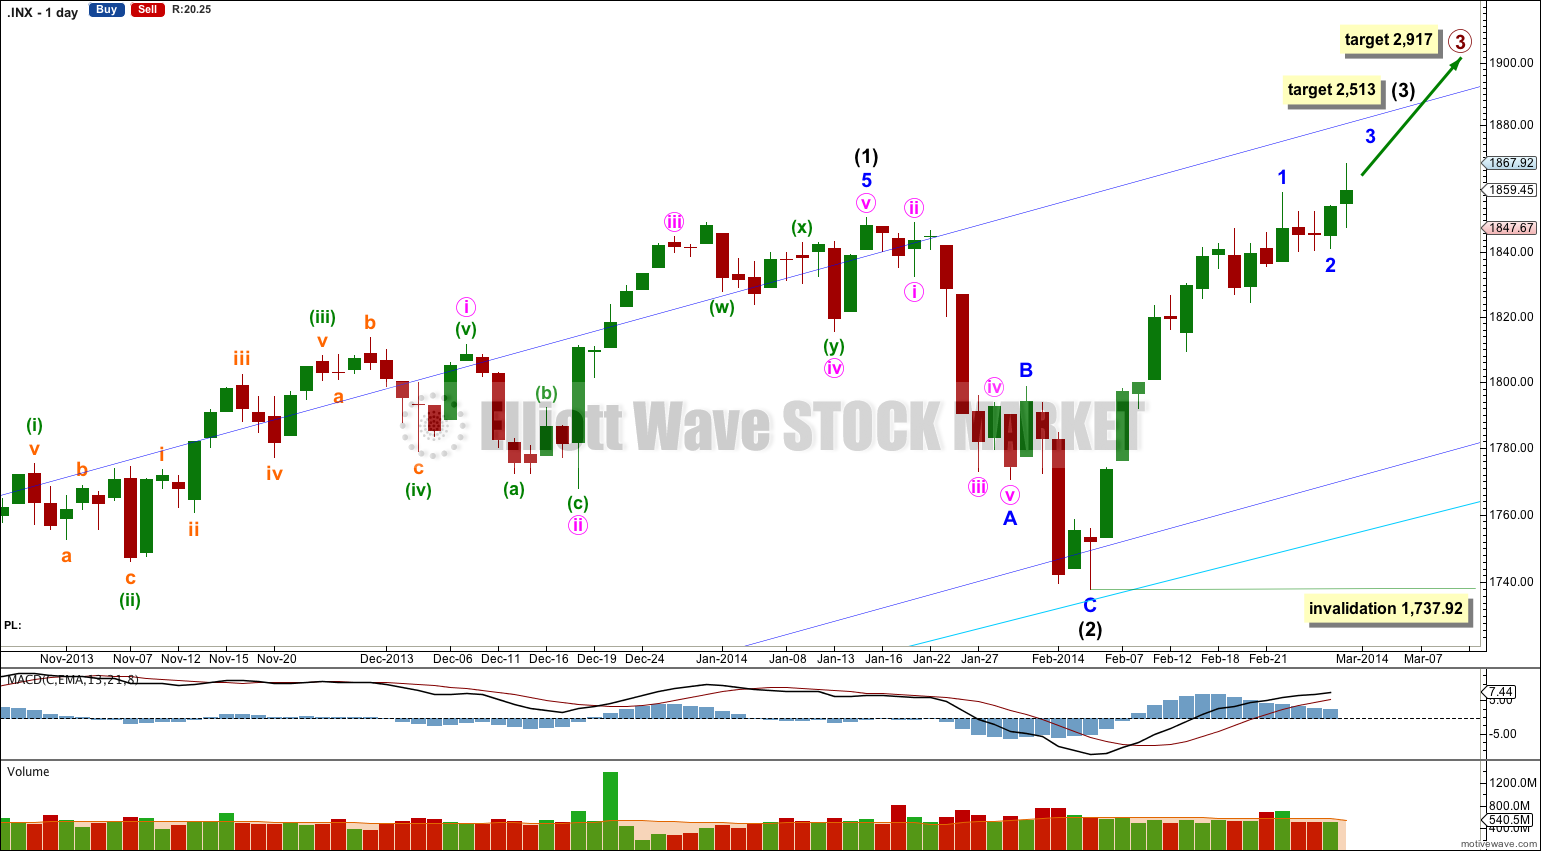
This bullish wave count expects a new bull market began at 666.79 for a cycle wave V. Within cycle wave V primary waves 1 and 2 are complete. Within primary wave 3 intermediate wave (1) is complete at 1,850.84. Intermediate wave (2) is either over as a brief shallow zigzag, or it is continuing as an expanded flat correction (second wave count below).
At 2,513 intermediate wave (3) would reach equality in length of intermediate wave (1).
At 2,917 primary wave 3 would reach 2.618 the length of primary wave 1.
Primary wave 3 should breach the upper edge of the maroon – – – channel on the monthly and weekly charts. This wave count requires a strong increase in upwards momentum.
Within intermediate wave (3) no second wave correction may move beyond the start of its first wave. This wave count is invalidated with movement below 1,737.92.
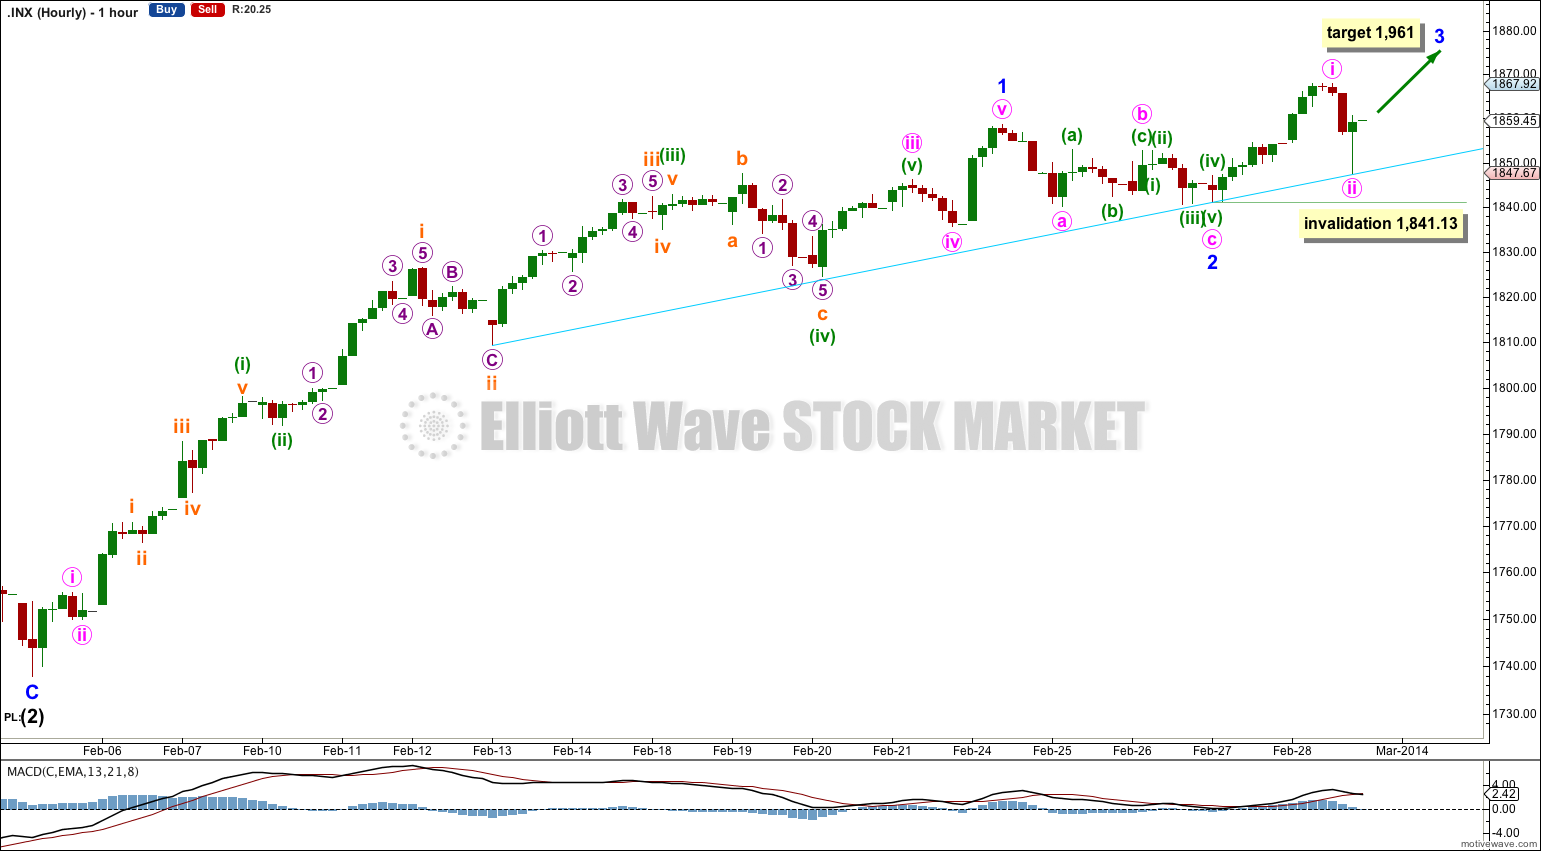
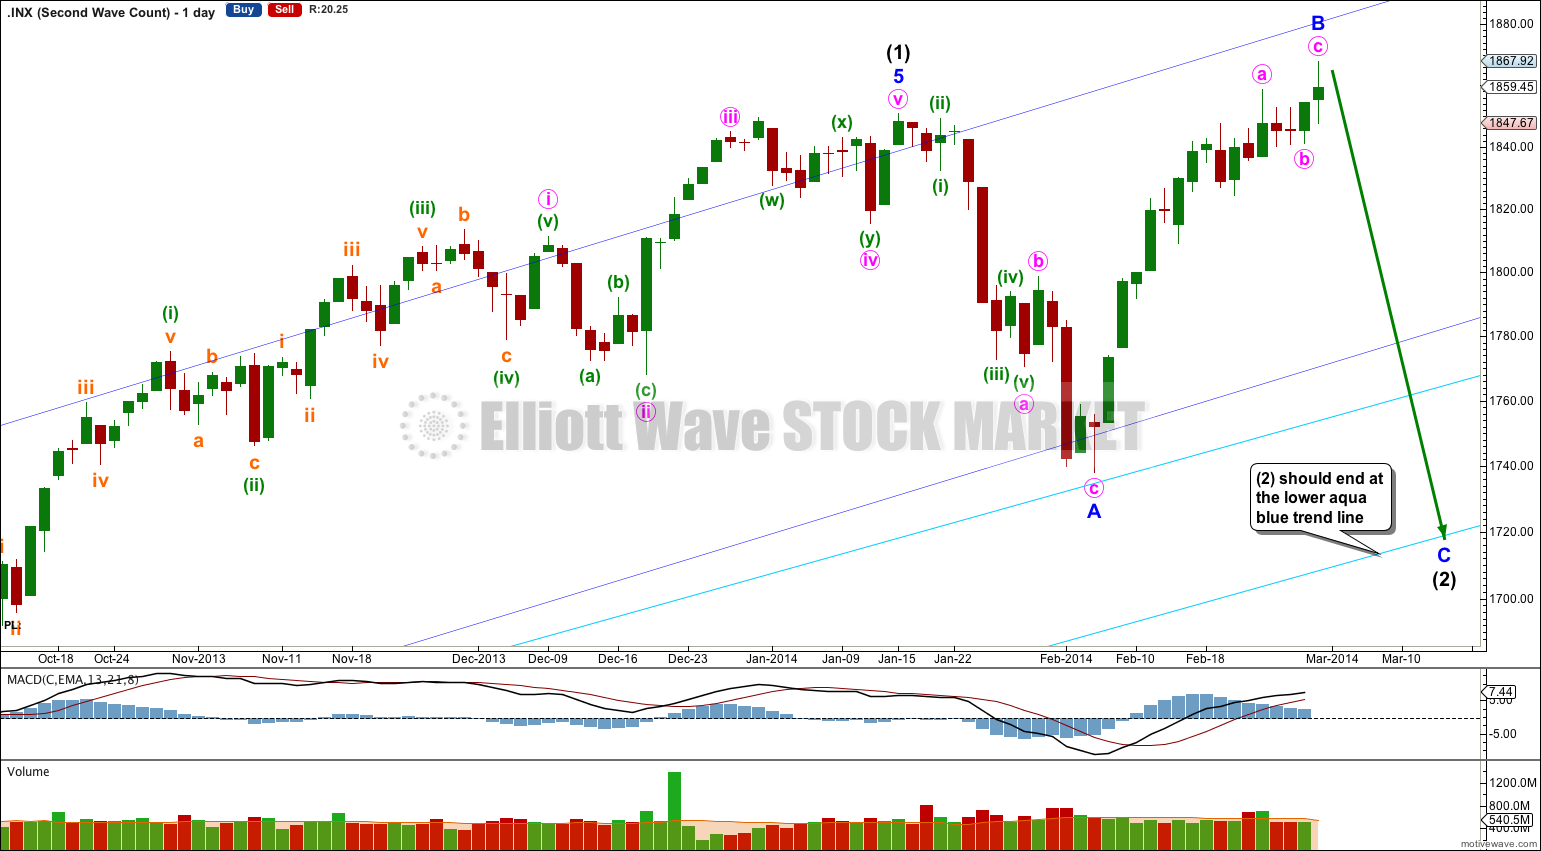
Minor wave 2 may have ended with a slightly truncated minute wave c as a small shallow zigzag. The first wave upwards for Friday’s session may be minute wave i within minor wave 3. Although this wave count includes two small truncations the subdivisions fit perfectly on the five minute chart.
At 1,961 minor wave 3 would reach equality in length with minor wave 1.
Within minor wave 3 minute wave ii may not move beyond the start of minute wave i. This wave count is invalidated with movement below 1,841.13.
This wave count requires a strong increase in upwards momentum. So far there is divergence between price trending higher and momentum trending lower (using MACD as a momentum indicator). This does not fit so far with this wave count. For this reason I am considering the second wave count below.
Second Daily Bullish Wave Count.
It is also still possible that intermediate wave (2) is not over and will continue for about another three weeks yet. This would see it better in proportion for an intermediate degree wave, and would allow for it to breach the darker blue channel which contains intermediate wave (1).
Minor wave B is now a 115% correction of minor wave A. Minor wave C should find support at the lower of the two aqua blue trend lines.
Minor wave A lasted 14 days. I would expect minor wave C to be of about the same duration.
I have looked for a triangle ending about 1,847. This triangle has the best fit in terms of trend lines, but the subdivisions do not have the best fit. Minuette wave (a) within the triangle subdivides perfectly as a five wave impulse and imperfectly as a zigzag.
Minute wave c is just 1.72 short of 0.236 the length of minute wave a.
The lower aqua blue trend line is drawn in the same way on all hourly charts. It shows where downwards movement for the last few days is finding support. When this aqua blue trend line is clearly breached then I would expect a trend change at least at minor degree.
Bearish Alternate Wave Count.
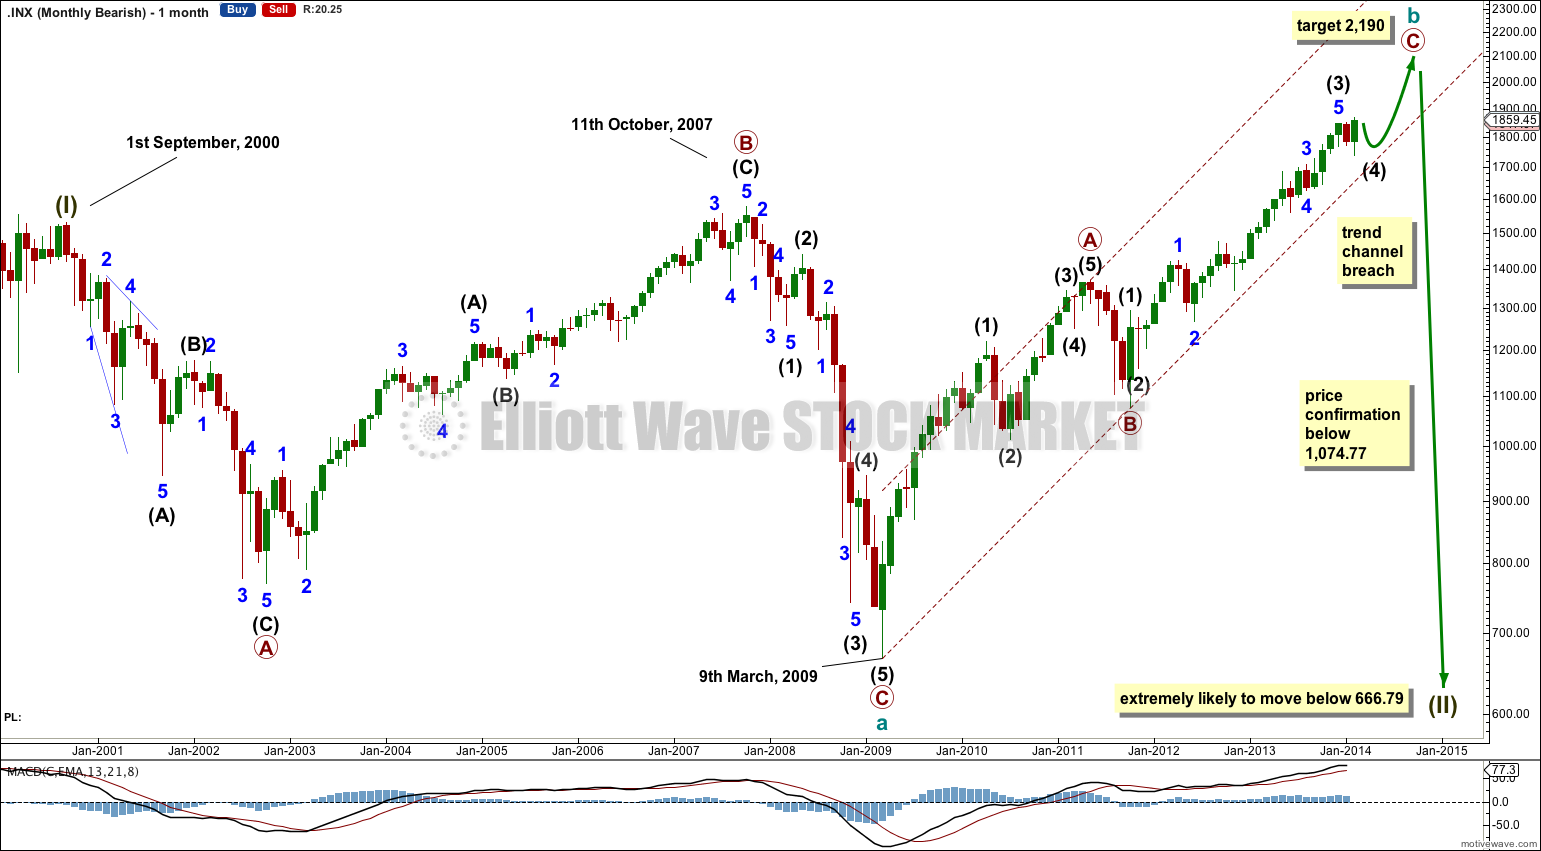
This bearish wave count sees the flat correction beginning September 2000 and ending March 2009 as only cycle wave a within a super cycle wave II expanded flat correction. This wave count expects that an upwards impulse ended at 1,530.09 on 1st September, 2000 with a truncated fifth wave.
Because upwards movement for primary wave C remains in the lower half of the acceleration channel this wave count has overall a good look. It also fits nicely with social mood.
I expect that for this alternate intermediate wave (4) may be incomplete. It may finish as an expanded flat correction, showing nice alternation with intermediate wave (2) which was a zigzag.
Thereafter a final upwards wave for intermediate wave (5) may end about 2,190 where primary wave C would reach 1.618 the length of primary wave A. When intermediate wave (4) is complete I would recalculate the target at intermediate wave degree so it would probably change.
Within the zigzag of cycle wave b intermediate wave C would reach 1.618 the length of intermediate wave A at 2,190. At this point cycle wave b would be a 174% correction of cycle wave a. Although this is longer than the maximum common length of a B wave within a flat correction it is allowable within Elliott wave rules and I have seen plenty of expanded flats over the years with particularly long B waves. The length of this particular B wave is the reason for this wave count being relegated to an alternate.
This bearish wave count requires a clear breach of the lower aqua blue trend line, and the larger maroon – – – channel, before it should be taken seriously. While price remains within the maroon – – – channel and above the lower aqua blue trend line then we should assume that the trend remains upwards.
It the channel is breached then I would calculate downwards targets for you and this would be my only wave count.
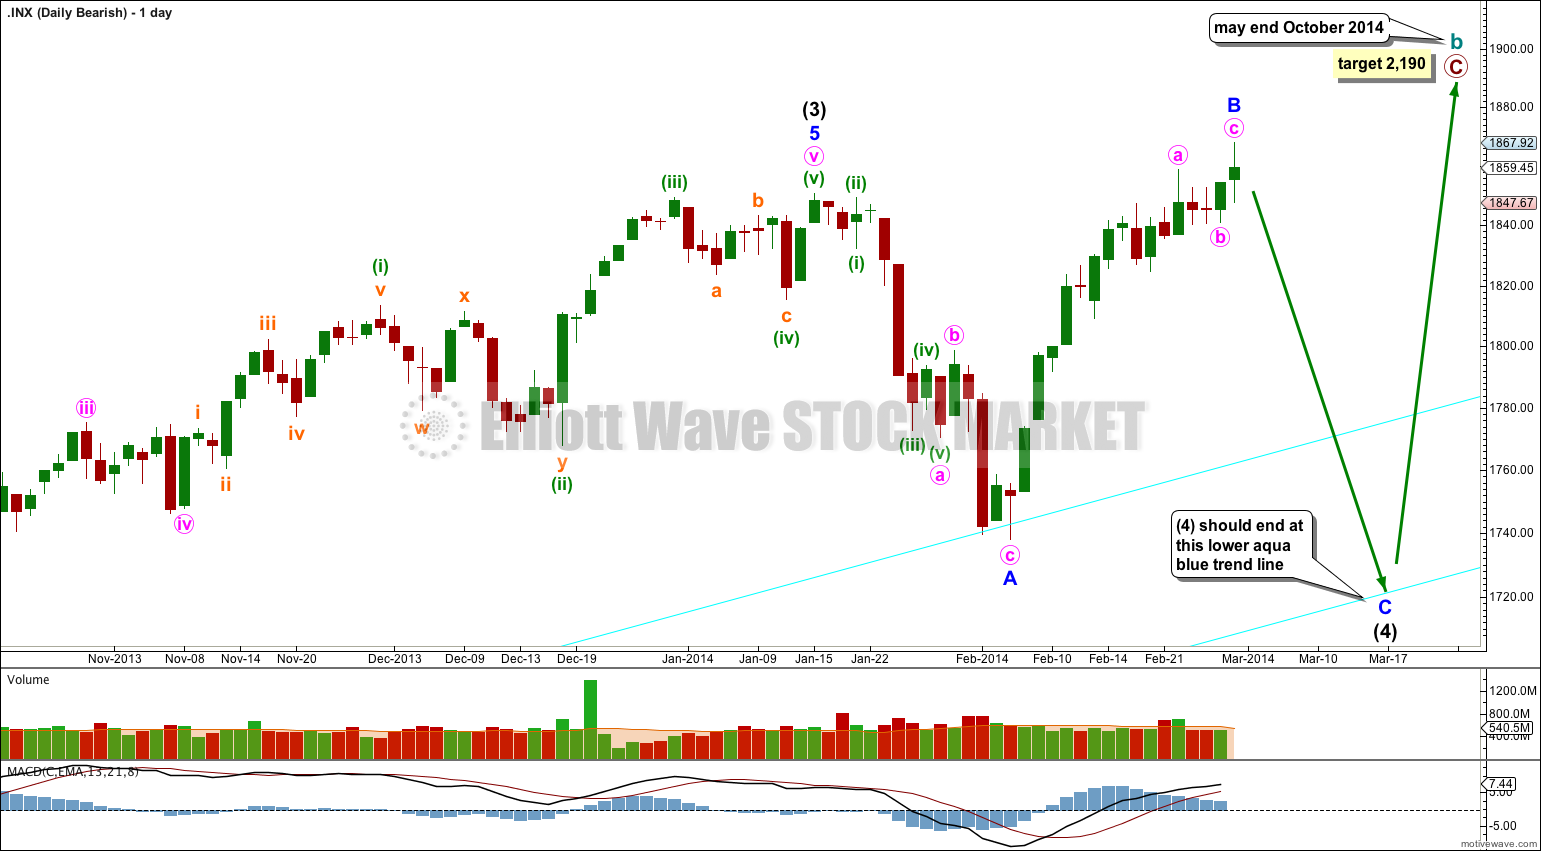
The subdivisions for intermediate wave (4) would be the same as the second bullish wave count for intermediate wave (2). I would expect it to end at the lower aqua blue trend line.
Thereafter if intermediate wave (5) lasts about five to six months it may end about October this year.
I publish this wave count mostly to illustrate there is more than one way to see a possible triangle within this upwards movement.
This triangle does not have as good a look in terms of its trend lines. Also minuette waves (a) and (c) within the triangle subdivide best on the five minute chart as five wave structures.
At this stage it makes no difference to the wave count at minor degree. No matter how we see the subdivisions within the upwards movement for minor wave B it can be seen as a three wave structure which may be complete.
I see today that the Ukraine is in turmoil. The turmoil seems to have spread from the Middle East to Eastern Europe (although I am aware that many in the Ukraine would not like themselves to be so classified). This really does not look like an approaching middle of a third wave up.
And then there’s Venezuela and Argentina… adding to the problems in Europe and the Middle East.
I don’t like to read the “news”. But from the little I see it really doesn’t look peachy keen.
It looks like the majority of populations are not on board with the supposed “recovery”. Otherwise, why would they be rioting? Surely the middle of a third wave should “rise all boats”?
But then, there is also the possibility that the US stock markets are now divorced from social mood in the rest of the world. Which is highly unlikely and a whole other conversation entirely.
Feels like a titanic bulls/bears struggle is going on, Lara. We know a major trend change to down is indicated by social mood – and social mood causes price movement – while bulls are desperately refusing to let go.
Could IWM ( etf for Russell 2000 ) provide a better wave count for the current dilemma? Its January decline was a clear zig zag indicating its corrective nature.
Unfortunately, not necessarily.
However, I am looking at the Russell 2000 from a more classic technical analysis POV.