
I had expected downwards movement for Thursday’s session to a short term target at 1,822. This is not what happened. Price moved higher but has remained just below the invalidation point.
All three wave counts remain valid and remain mostly the same.
Summary: I still expect it is most likely we shall see downwards movement from here. It may be towards 1,806 as per the main wave count, or only 1,836 as per the alternate. The bearish wave count also remains valid and could see downwards movement from here.
This analysis is published about 8:15 p.m. EST. Click on charts to enlarge.
Main Bullish Wave Count.
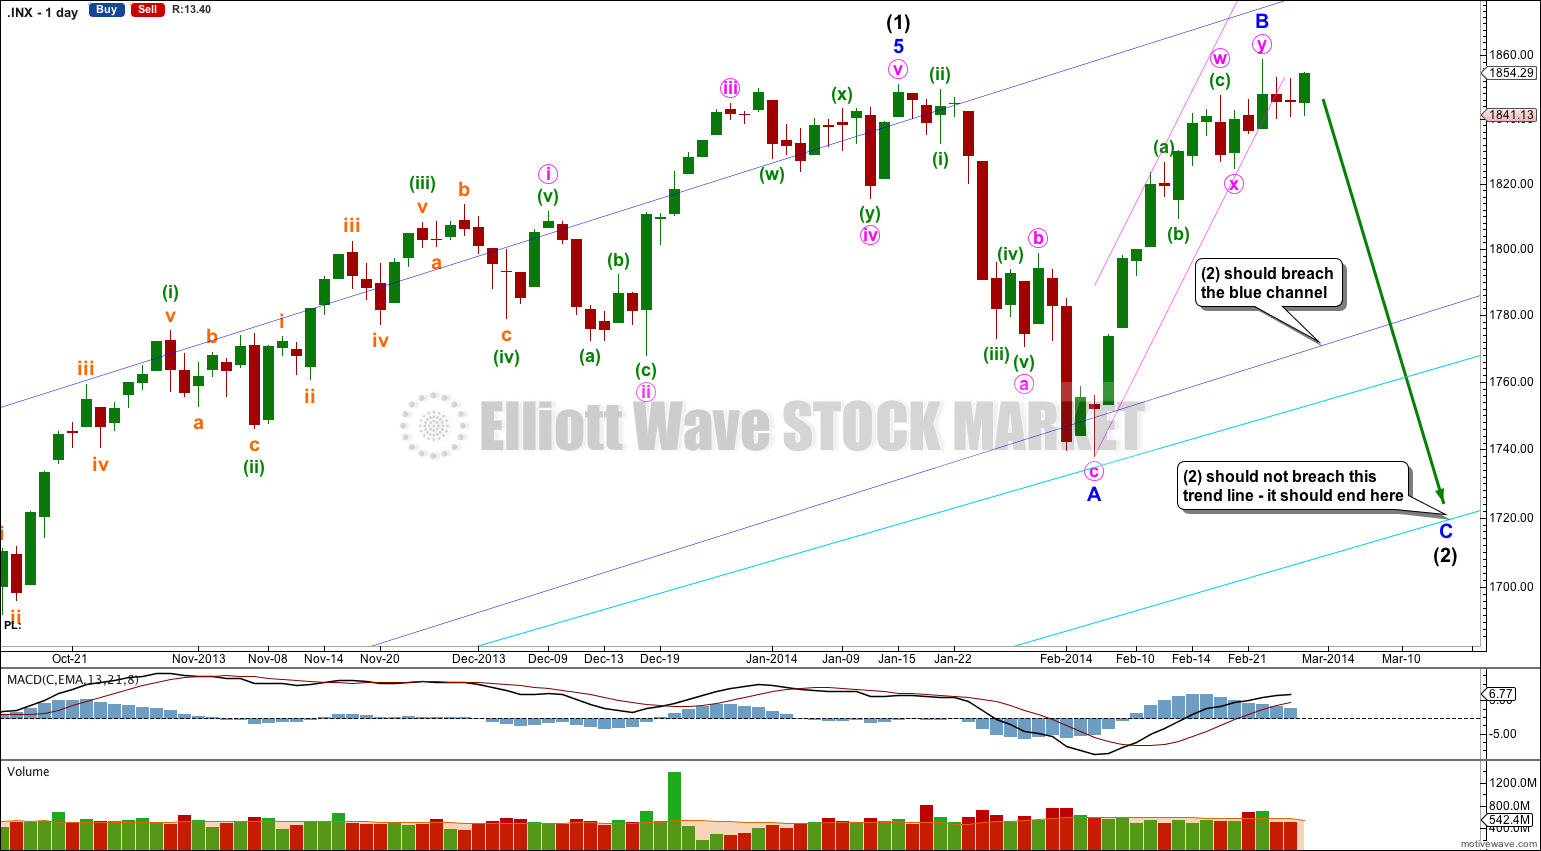
This bullish wave count expects a new bull market began at 666.79 for a cycle wave V. Within cycle wave V primary waves 1 and 2 are complete. Within primary wave 3 intermediate wave (1) is complete at 1,850.84. Intermediate wave (2) is most likely an incomplete expanded flat correction.
The aqua blue trend lines are very important. Draw them on the weekly chart (as shown in the bearish alternate chart at the end of this analysis) and copy them over to the daily chart. While price remains above the lower of these two trend lines I will assume that the trend remains upwards; the trend remains the same until proven otherwise.
Within intermediate wave (2) minor wave A found support at the upper aqua blue trend line. Minor wave C may find support at the lower aqua blue trend line.
The small pink channel about minor wave B is now clearly breached providing some confidence in this minor degree trend change.
Minor wave B is a 106% correction of minor wave A so this flat is an expanded flat. Expanded flats normally have C waves which move substantially beyond the end of their A waves. If intermediate wave (2) ends at the lower aqua blue trend line then minor wave C would have moved well below the end of minor wave A.
Movement to a new low below 1,737.92 would be highly likely for this wave count as minor wave C is likely to move below the end of minor wave A to avoid a truncation and a rare running flat.
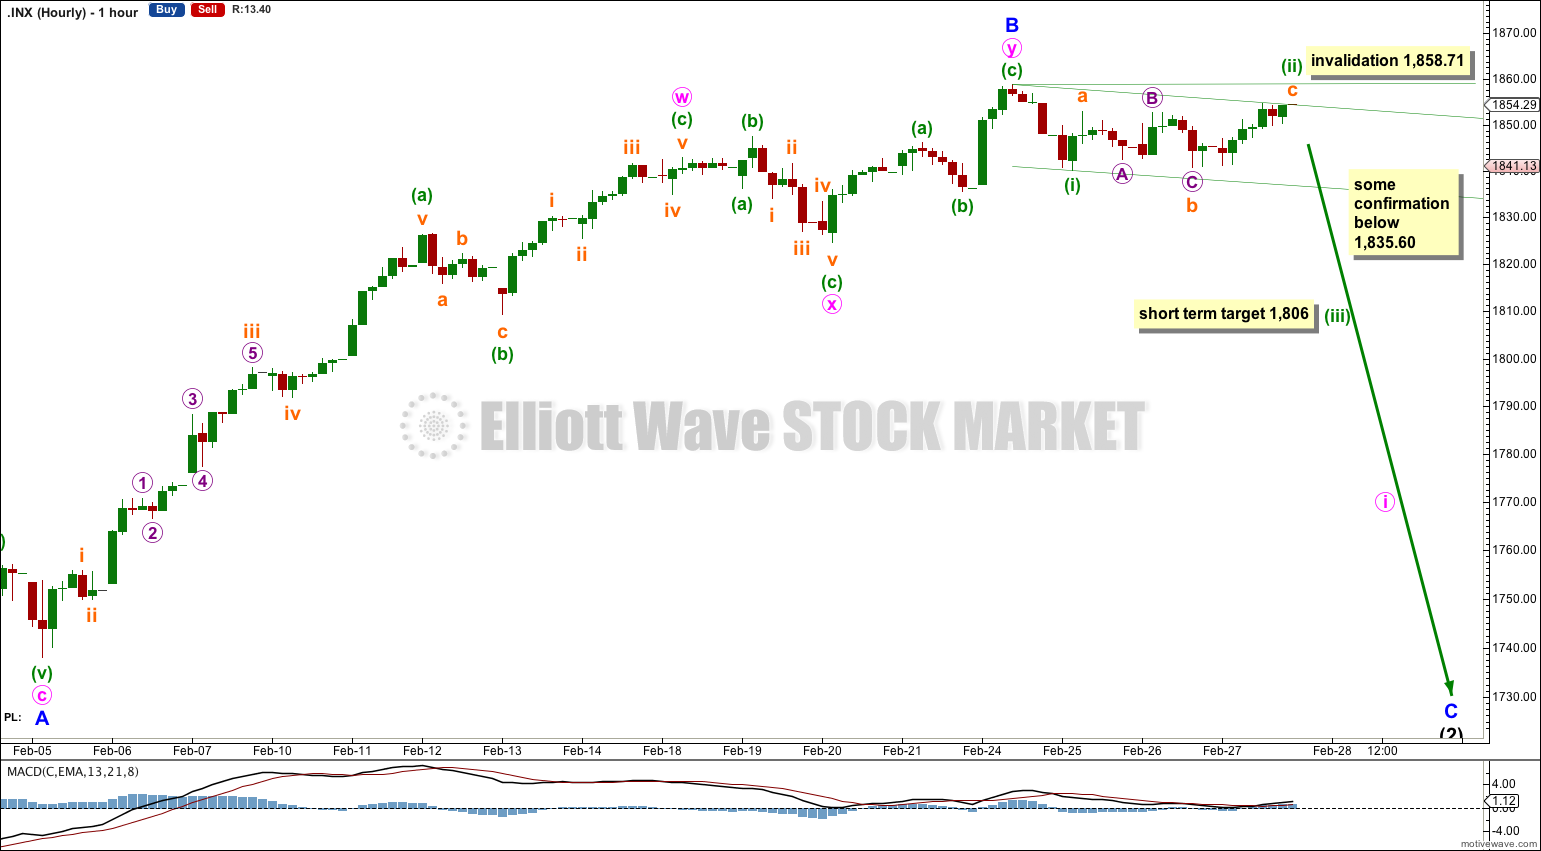
Movement below 1,835.60 would provide confidence in this trend change at minor degree.
Minuette wave (ii) may have continued further sideways and higher as a deep flat correction. Because this second wave is so very deep I would expect the following third wave to be more likely to reach 2.618 the length of the first wave.
If the next move down is a third wave then it should breach the lower edge of the parallel channel. As drawn here it is an acceleration channel, and as drawn on the alternate it is a corrective channel.
Minuette wave (ii) may not move beyond the start of minuette wave (i). This wave count is invalidated with movement above 1,858.71.
Alternate Bullish Wave Count.
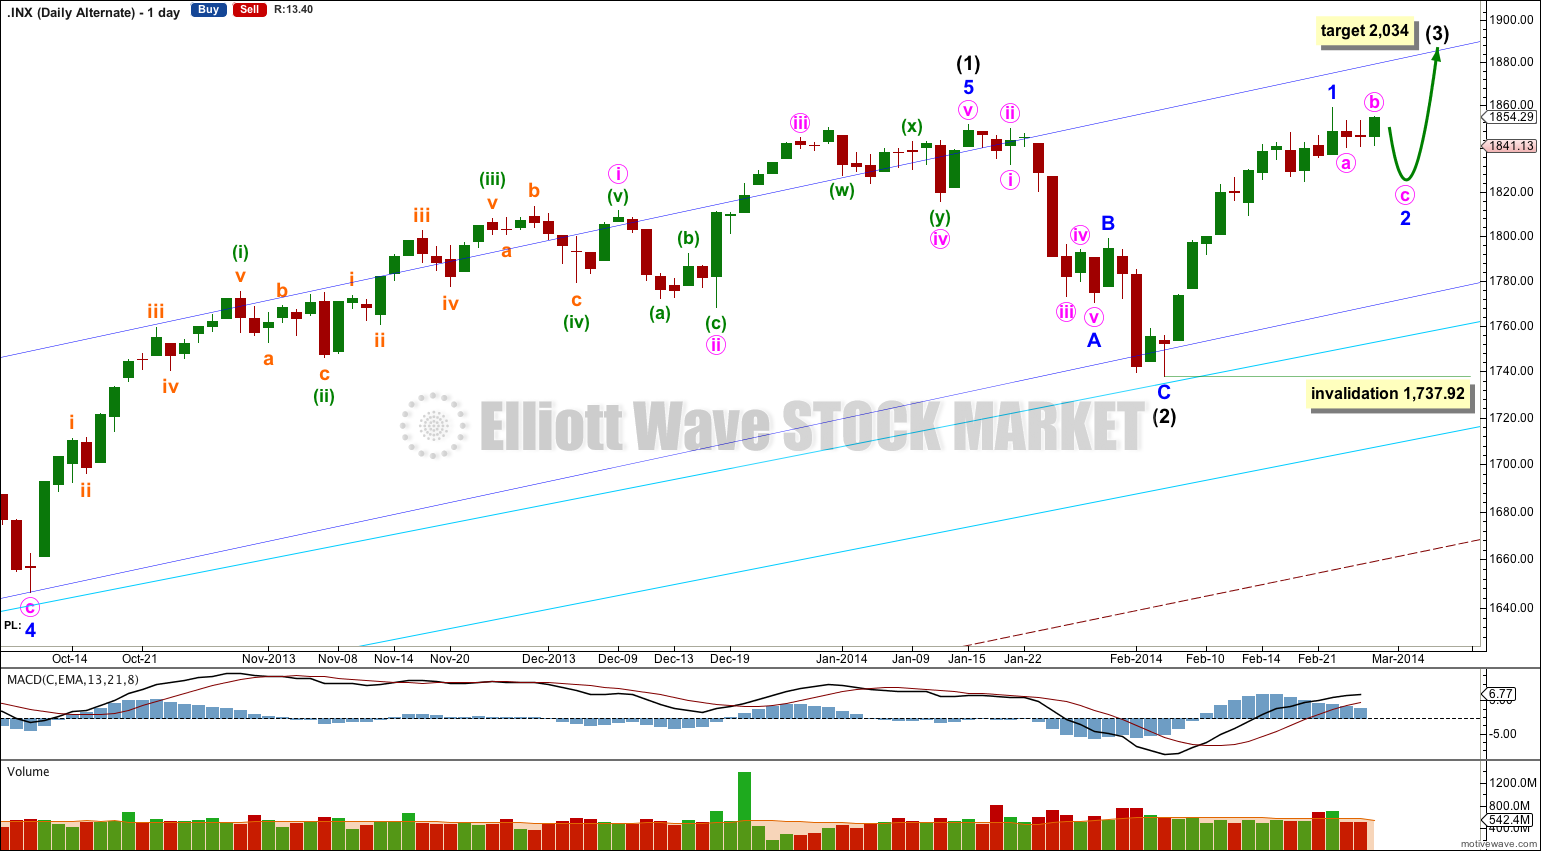
It is possible that intermediate wave (2) is over as a remarkably brief shallow zigzag which did not breach the channel containing intermediate wave (1). But this wave count has a low probability.
If upwards movement continues from here then a third wave would be forming and upwards momentum should increase significantly.
This wave count is extremely bullish in the short and long term. At 2,034 intermediate wave (3) would reach 0.382 the length of intermediate wave (1). If intermediate wave (3) passes this target, or price gets there and the structure is incomplete, then a higher target would be calculated for both intermediate wave (3) and primary wave 3.
The target for primary wave 3 would be the same: at 2,213 primary wave 3 would reach 1.618 the length of primary wave 1.
Within intermediate wave (3) minor wave 2 may not move beyond the start of minor wave 1 below 1,737.92.
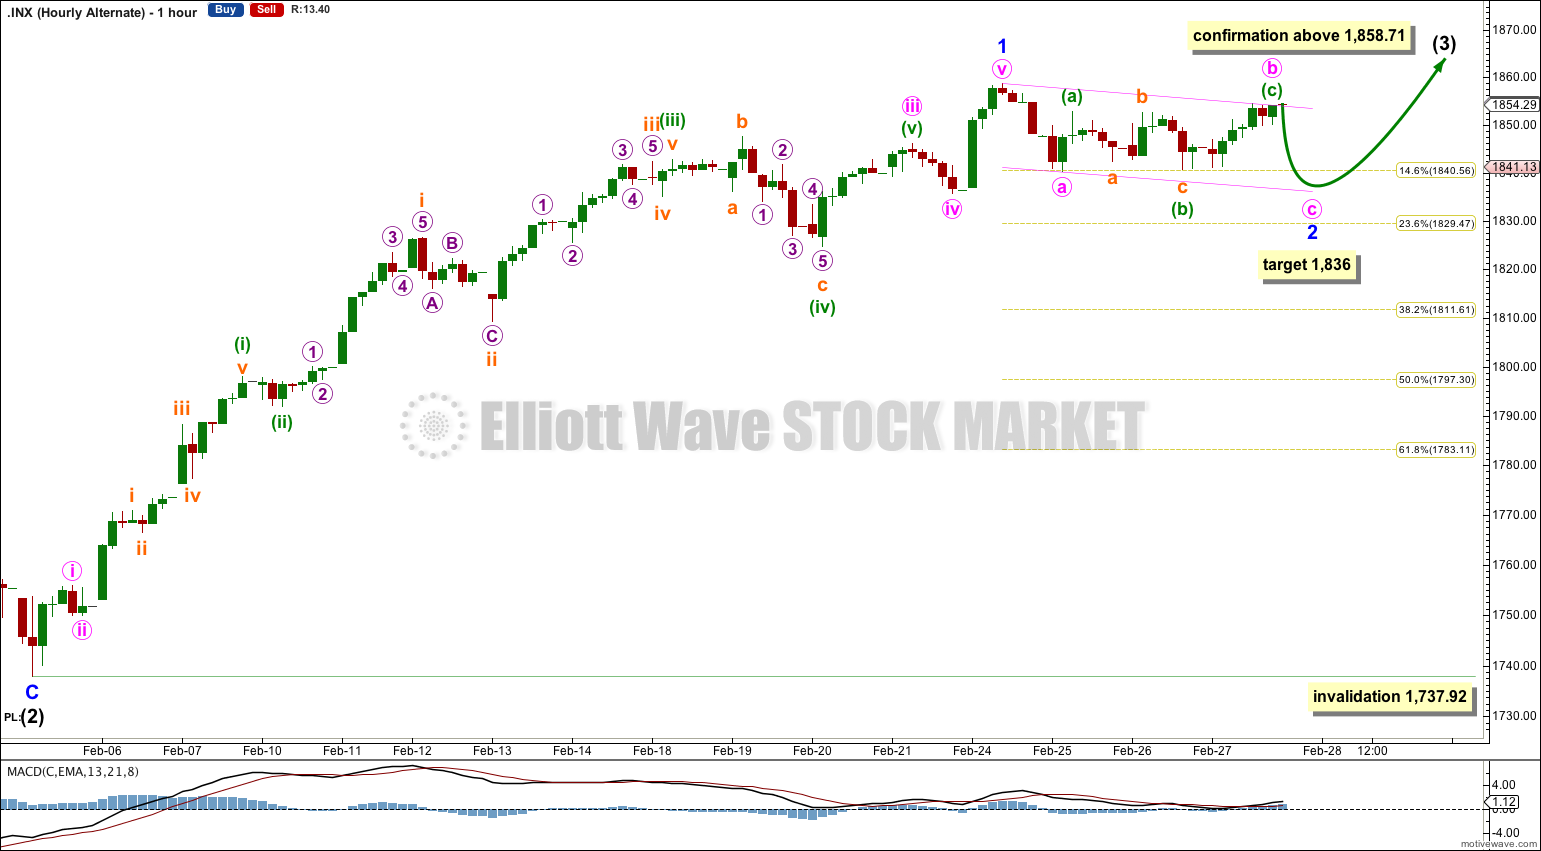
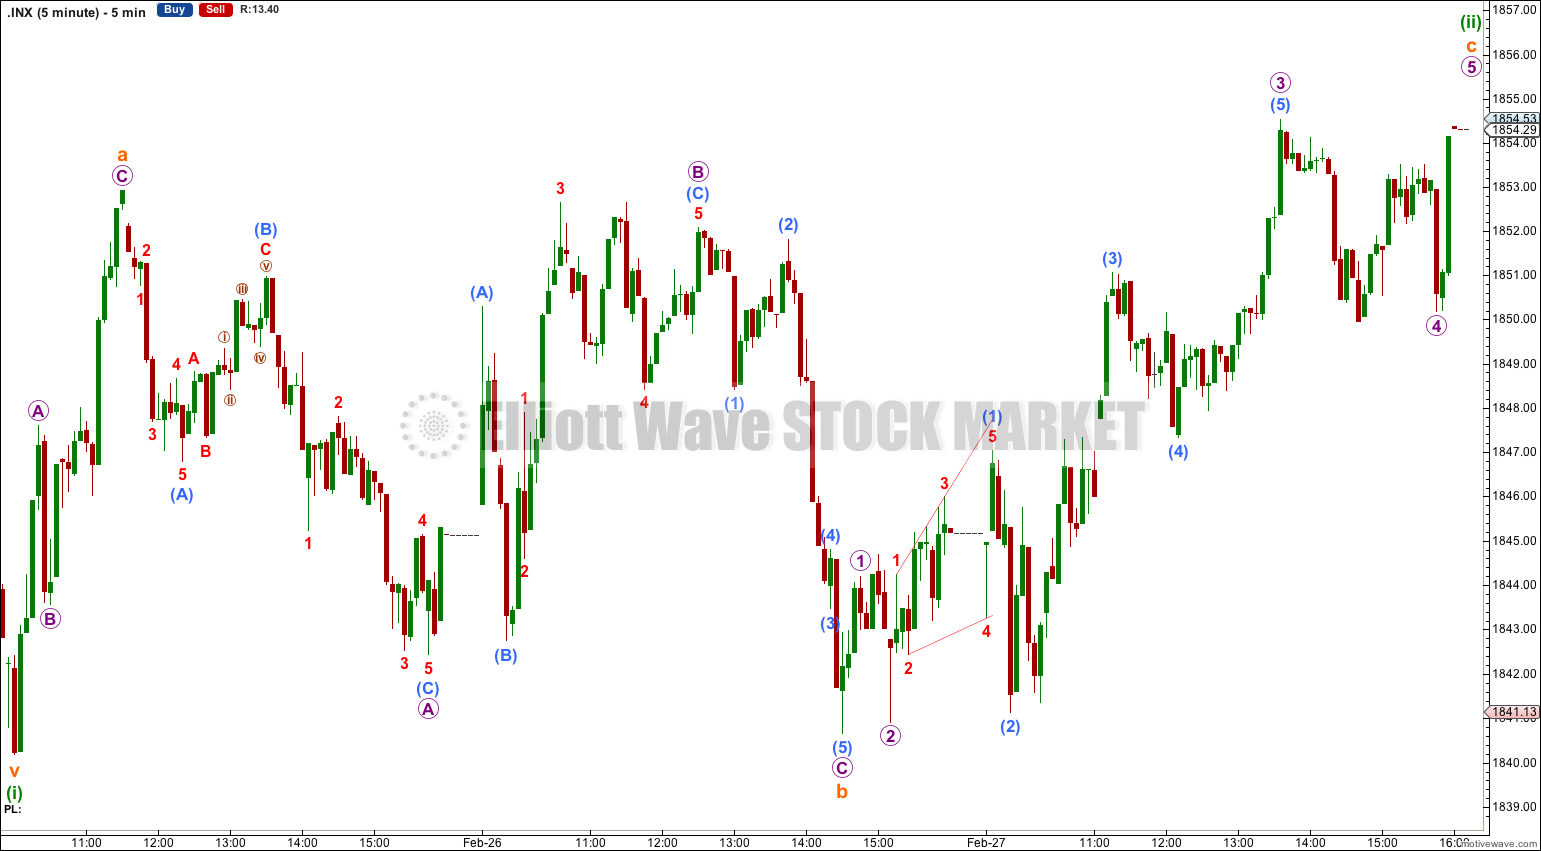
Because the downwards labeled here minute wave a subdivides so neatly as a five wave impulse on the five minute chart I expect that minor wave 2 would most likely be a zigzag. Within the zigzag minute wave b is also complete. At 1,836 minute wave c would reach equality in length of minute wave a. It may find support at the lower edge of the parallel channel about minor wave 2.
Minor wave 2 may be complete in just one more day. It may be a brief shallow zigzag ending just above the 0.236 Fibonacci ratio.
The short term outlook for this alternate is identical to the main wave count above.
Minor wave 2 may not move beyond the end of minor wave 1 below 1,737.92.
Bearish Alternate Wave Count.
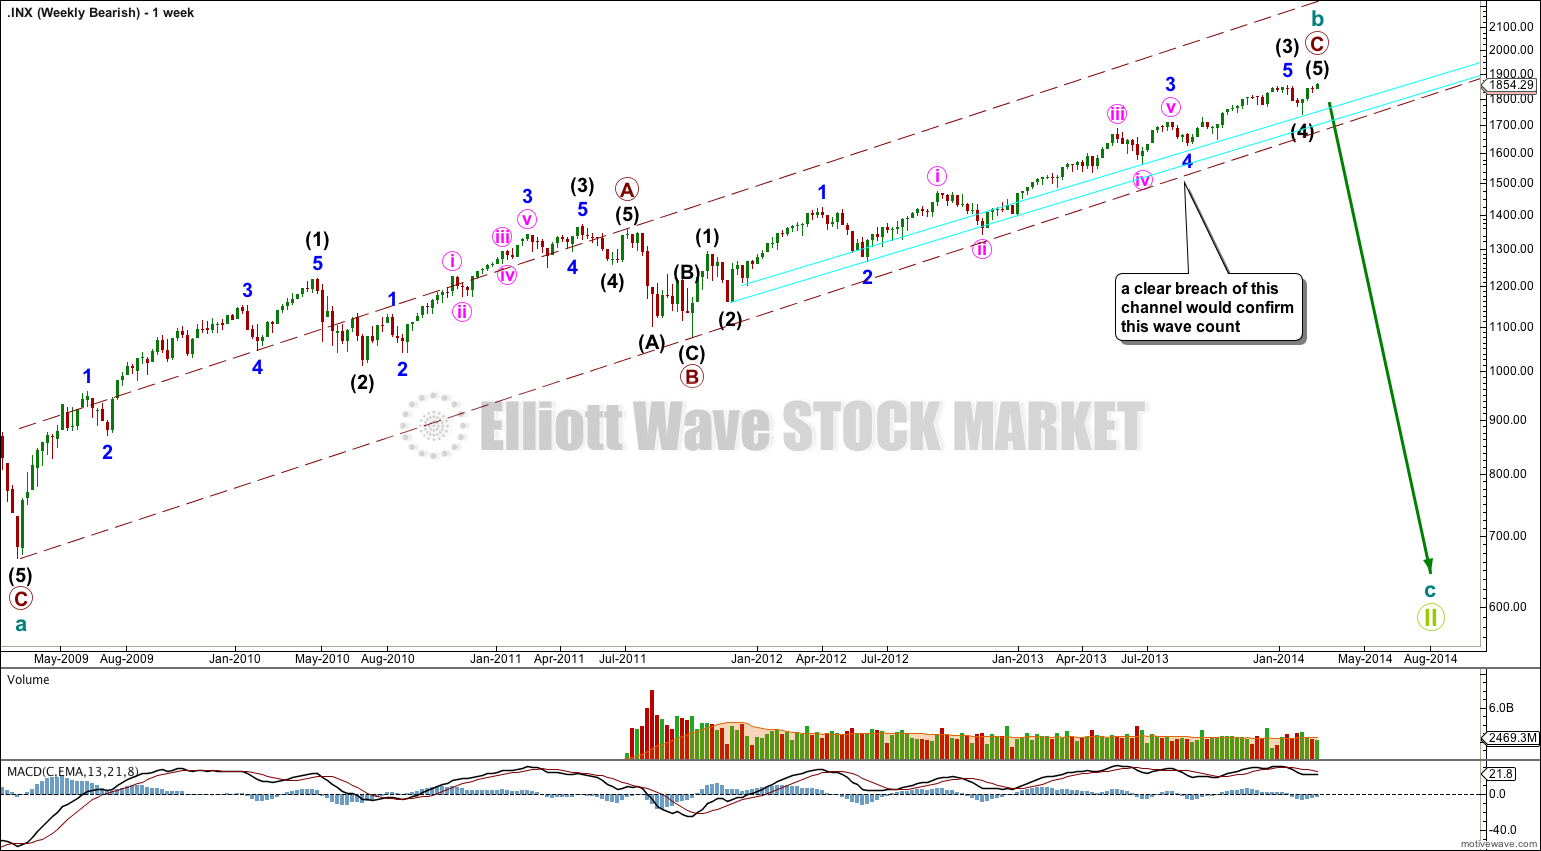
This bearish wave count sees the flat correction beginning September 2000 and ending March 2009 as only cycle wave a within a super cycle wave II expanded flat correction.
This wave count expects that an upwards impulse ended at 1,530.09 on 1st September, 2000 with a truncated fifth wave.
Within the huge expanded flat correction cycle wave b may have ended at 1,858.71, or this high may be part of intermediate wave (4) with the final intermediate wave (5) upwards yet to come.
Cycle wave b is now just slightly longer than 138% the length of cycle wave a. It is now longer than the maximum common length of a B wave in relation to an A wave within a flat correction, and so this bearish wave count is now relegated to an alternate. If price continues higher then the probability of this wave count will reduce further.
This bearish wave count requires a clear breach of the lower aqua blue trend line, and the larger maroon – – – channel, before it would again be taken seriously. While price remains within the maroon – – – channel and above the lower aqua blue trend line then we should assume that the trend remains upwards.
It the channel is breached then I would calculate downwards targets for you and this would be my only wave count.
The triangle idea is entirely valid and I’m working on a wave count now which looks at that movement as a triangle.
The first chart you posted has an invalid wave count; it labels the triangle as a second wave. Second waves cannot subdivide as triangles.
The second chart of Wilshire 5000 has a slightly different structure to the SPX500. It’s a valid wave count for sure (is that from Danerics?) an an interesting guide to what may be happening for SPX500.
Yes is from Danerics. The other one is from waveprinciple blogspot. I didn’t make them. But I wanted to present the triangle idea to see what you think.
I think it’s really good. I have a couple of wave counts with a triangle there, but not labeled in quite the right way.
I’m writing the analysis now. It should be published in about an hour or so.
New highs today, after new highs next decline to 1750 again.
How come?
I am hearing in other Elliott Wave Blogs that we just broke out of a small triangle seen in the 30 minutes chart in the S&P 500. Im uploading some charts with wave counts. Is it possible that we just broke out of a triangle and are going to make a final 5th wave on the S&P 500 to the 1,880 level?