
Price is moving slowly sideways and slightly lower which fits with the wave count.
The main wave count remains valid. The alternate bullish wave count is reduced in probability. The bearish wave count also remains valid.
Summary: It is most likely that price will continue lower for about one to two weeks to end at support on the lower aqua blue trend line. I have removed the target in favour of using the trend line to show where downwards movement should end.
Click on the charts below to enlarge.
Main Bullish Wave Count.
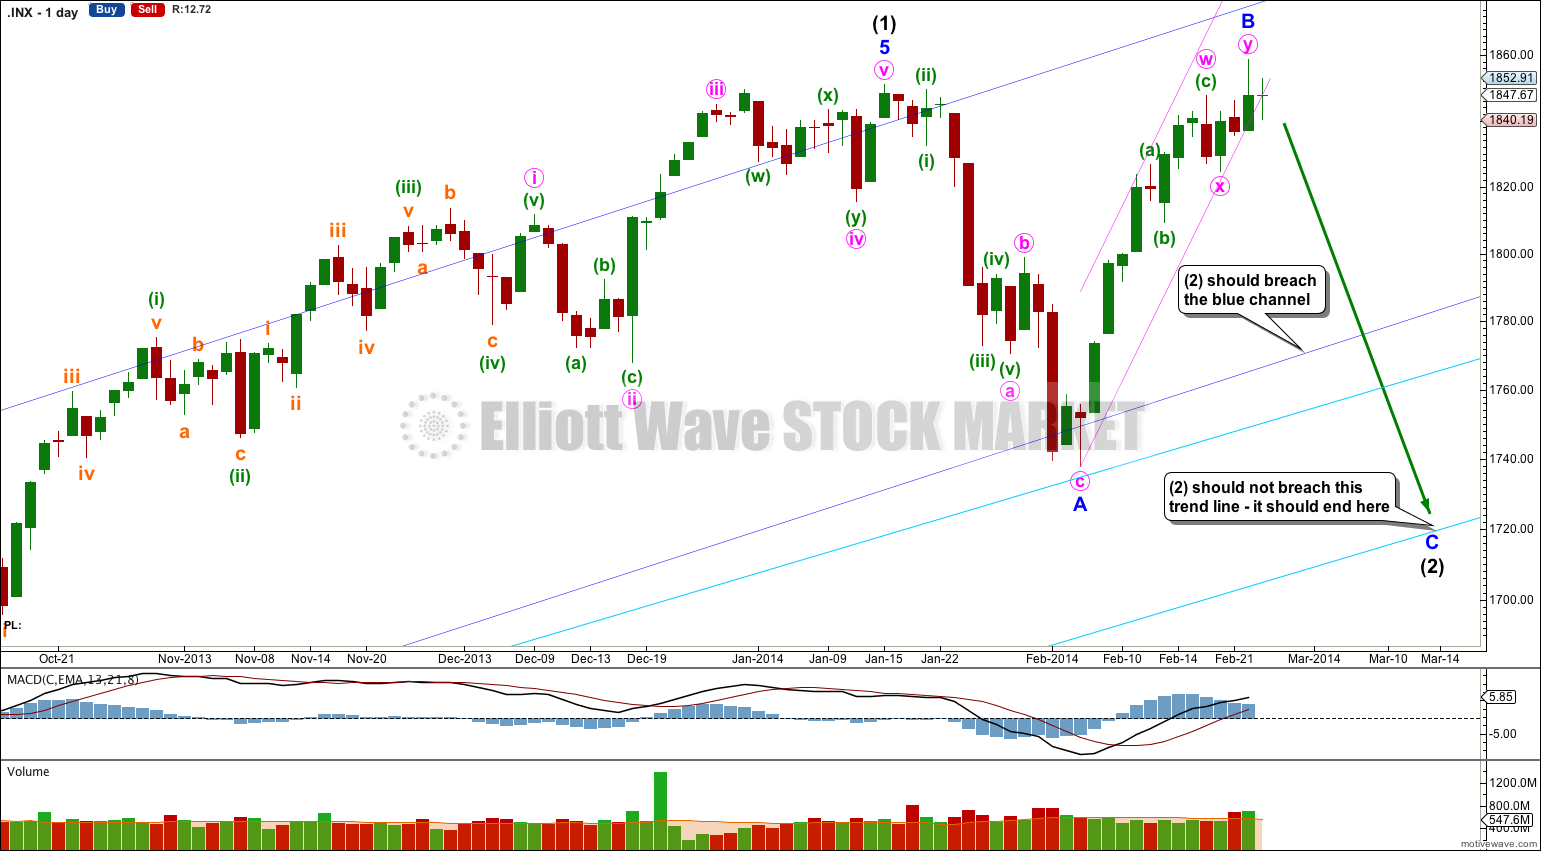
This bullish wave count expects a new bull market began at 666.79 for a cycle wave V. Within cycle wave V primary waves 1 and 2 are complete. Within primary wave 3 intermediate wave (1) is complete at 1,850.84. Intermediate wave (2) is most likely an incomplete expanded flat correction.
Within intermediate wave (2) minor wave A found support at the upper aqua blue trend line. Minor wave C may find support at the lower aqua blue trend line. At 1,676 minor wave C would reach 1.618 the length of minor wave A.
I want to see the small pink channel about minor wave B clearly breached to have any confidence in this minor degree trend change. When there is a full daily candlestick below this pink channel and not touching the lower pink trend line then I would have confidence in the expectation of downwards movement for minor wave C. At this stage the channel is not breached. It may be so in another one or two days.
Minor wave B is a 106% correction of minor wave A so this flat is an expanded flat. Expanded flats normally have C waves which move substantially beyond the end of their A waves. If intermediate wave (2) ends at the lower aqua blue trend line then minor wave C would have moved well below the end of minor wave A.
Movement to a new low below 1,737.92 would be highly likely for this wave count as minor wave C is likely to move below the end of minor wave A to avoid a truncation and a rare running flat.
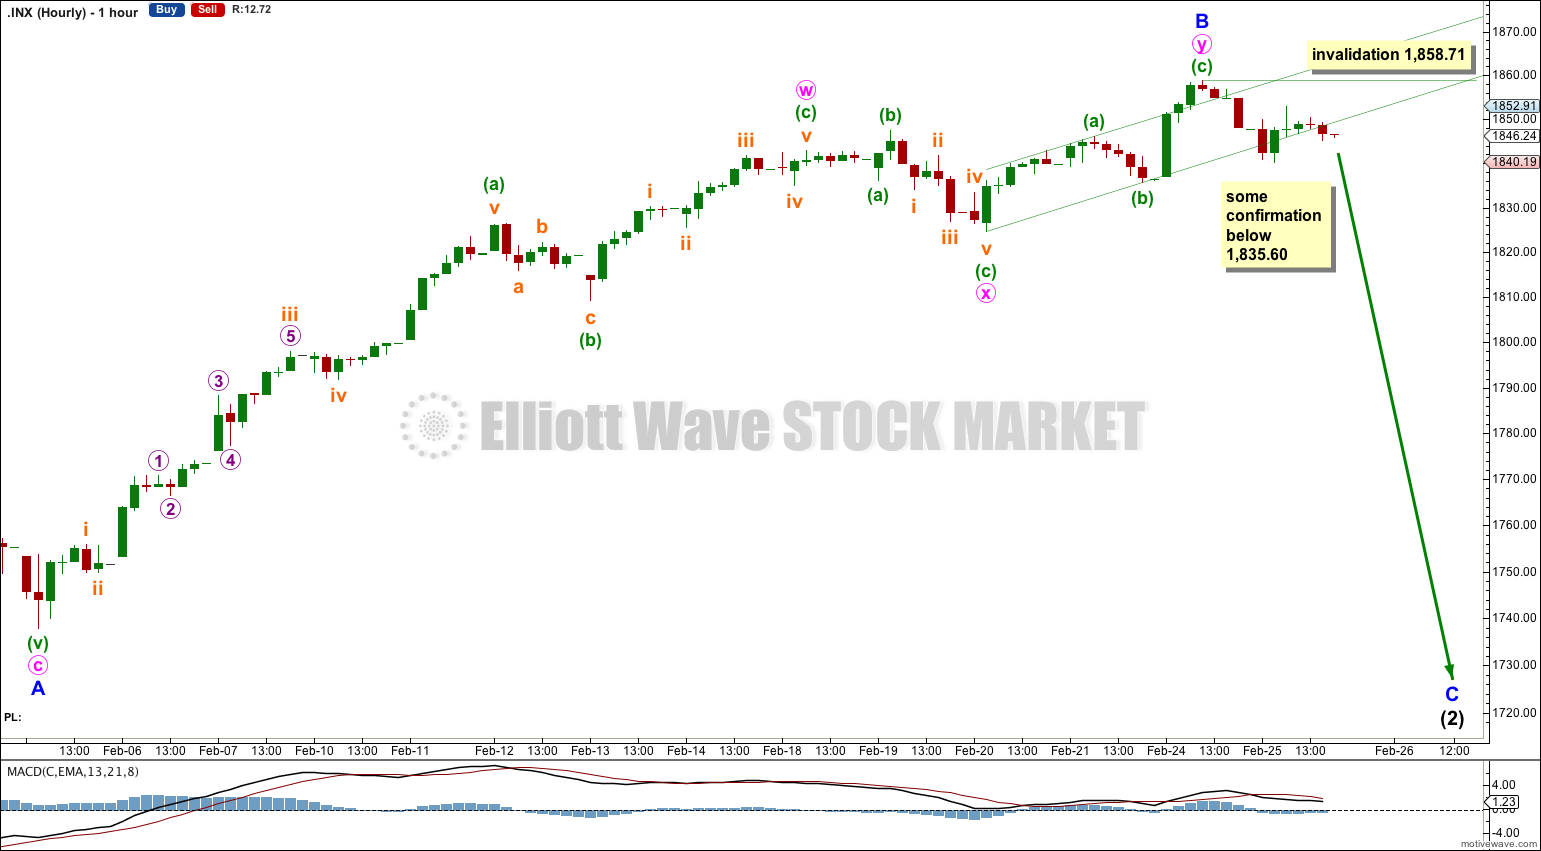
Minor wave B here is seen as subdividing as a double zigzag. Within minute wave w minuette wave (c) is just 0.21 points short of 0.382 the length of minuette wave (a). Within minute wave y minuette wave (c) is just 1.56 longer than equality with minuette wave (a).
Within minor wave C no second wave correction may move beyond the start of its first wave. This main wave count is invalidated with movement above 1,858.71. If that happens within the next few days then the alternate below should be used.
Alternate Bullish Wave Count.
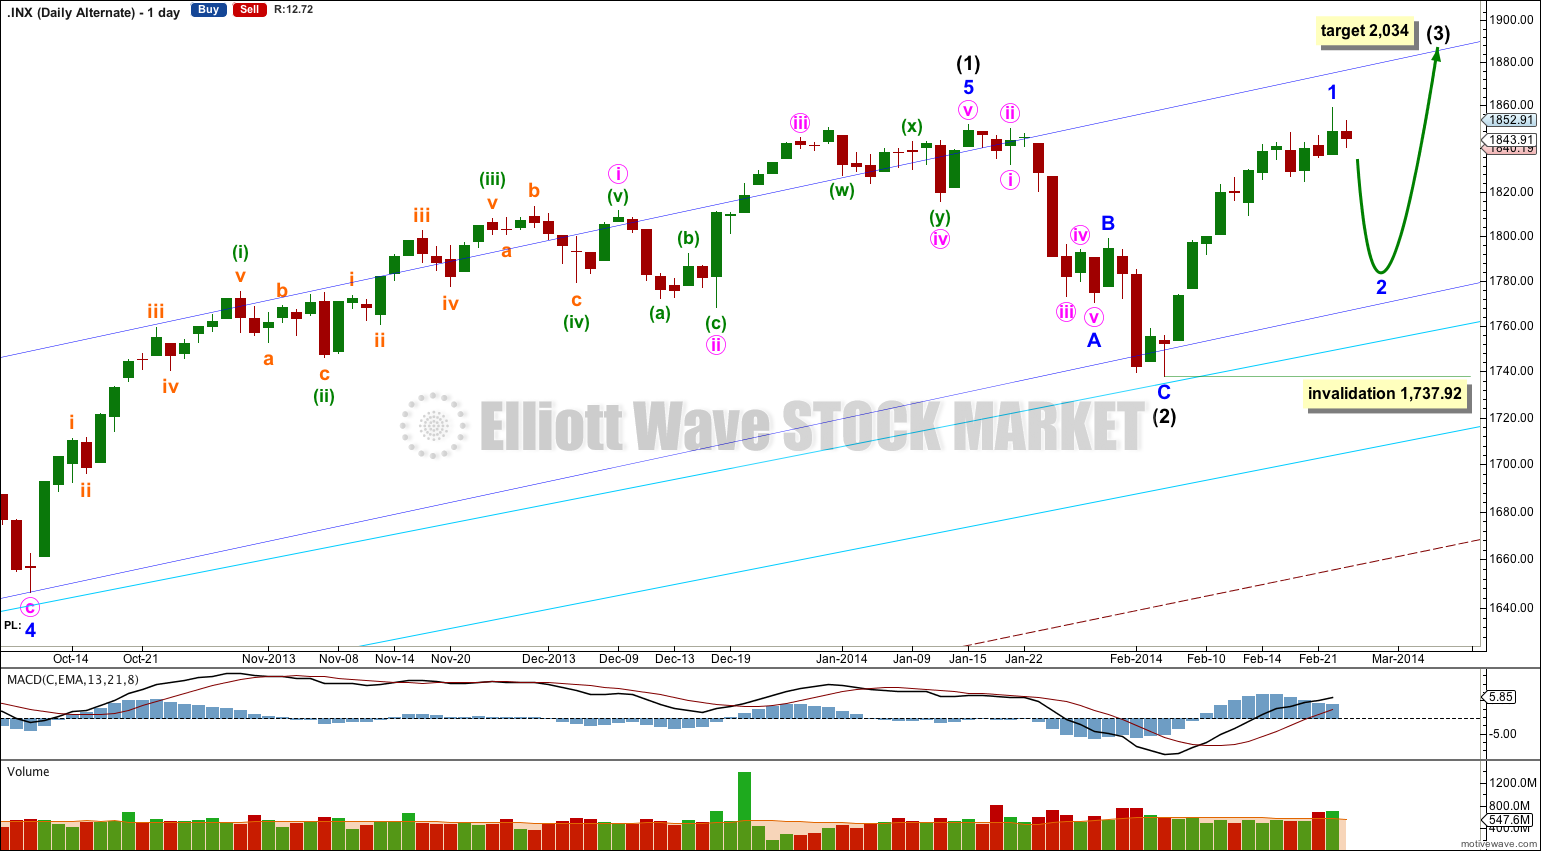
It is possible that intermediate wave (2) is over as a remarkably brief shallow zigzag which did not breach the channel containing intermediate wave (1). But this wave count has a low probability.
If upwards movement continues from here then a third wave would be forming and upwards momentum should increase significantly.
This wave count is extremely bullish in the short and long term. At 2,034 intermediate wave (3) would reach 0.382 the length of intermediate wave (1). If intermediate wave (3) passes this target, or price gets there and the structure is incomplete, then a higher target would be calculated for both intermediate wave (3) and primary wave 3.
The target for primary wave 3 would be the same: at 2,213 primary wave 3 would reach 1.618 the length of primary wave 1.
Within intermediate wave (3) minor wave 2 may not move beyond the start of minor wave 1 below 1,737.92.
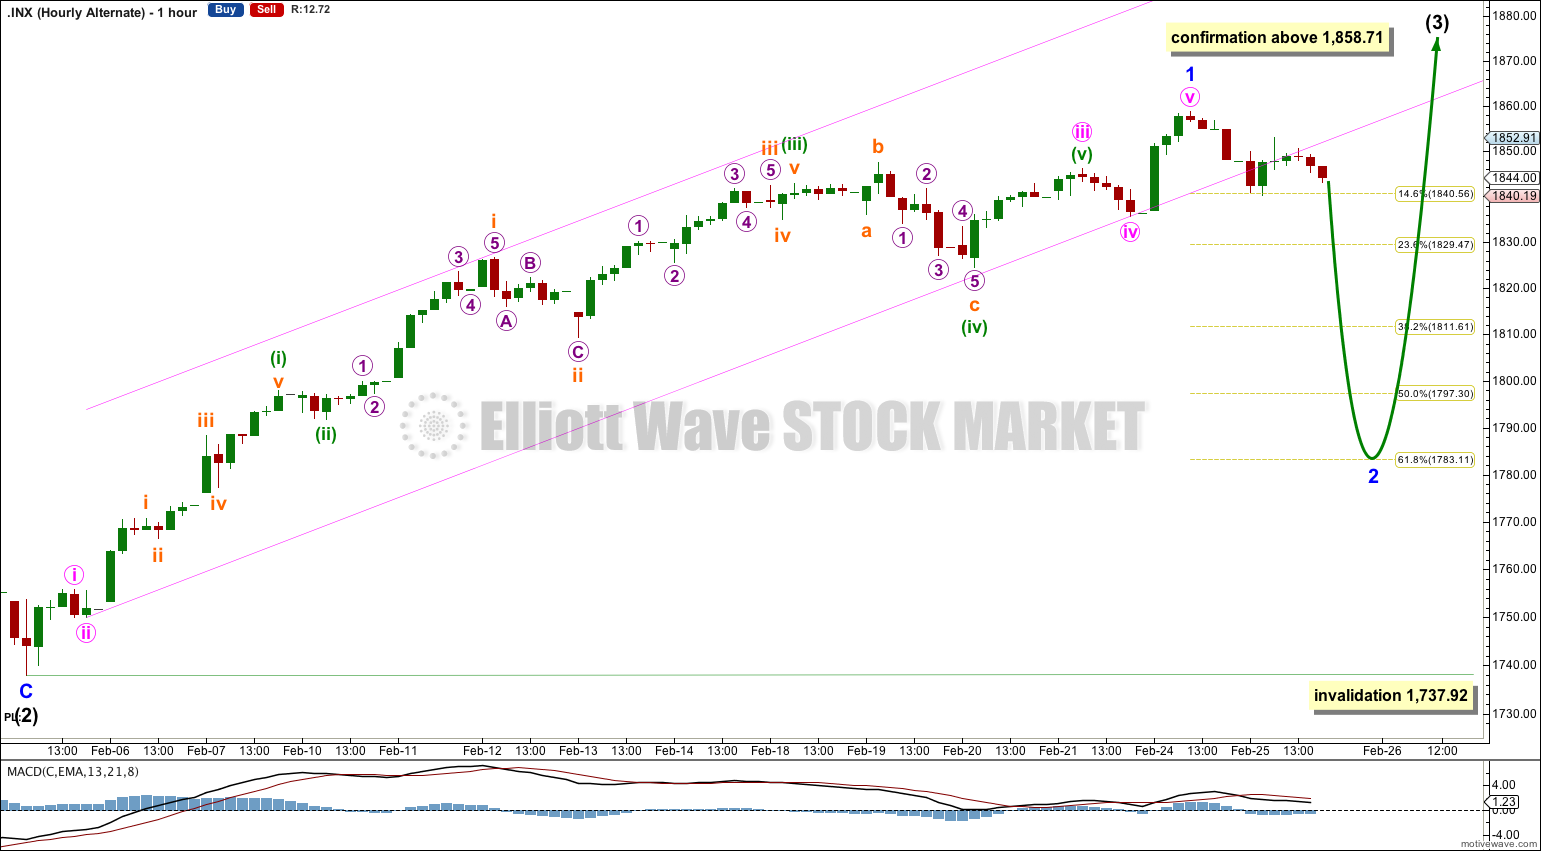
Yesterday I spent a lot of time on analysis of monthly, weekly and daily charts. Today I have spent more time looking at the structure of this last upwards movement on the hourly chart. As a result I have adjusted the wave count within this upwards movement. It subdivides as a five wave structure quite nicely and there are some reasonably good Fibonacci ratios within it.
Ratios within minor wave 1 are: minute wave iii has no Fibonacci ratio to minute wave i, and minute wave v is just 0.73 longer than 0.236 the length of minute wave iii.
Ratios within minute wave iii are: minuette wave (iii) is 4.32 longer than equality with minuette wave (i), and minuette wave (v) is 2.06 longer than 0.382 the length of minuette wave (iii).
I have drawn a best fit channel about minor wave 1. The first trend line is drawn from the lows of minute waves ii to iv, then a parallel copy is placed upon the extreme upper edge. This channel is clearly breached by downwards movement indicating that minor wave 1 is over and minor wave 2 is underway.
I would expect minor wave 2 to most likely end about the 0.618 Fibonacci ratio of minor wave 1 at 1,783. Minor wave 1 lasted 12 days so I would expect minor wave 2 to also last about the same. It may be very choppy and overlapping and within it there may be a new high above 1,858.71 (if it is an expanded flat correction, which is actually quite common). There is no upper invalidation point on this hourly chart for this reason.
Minor wave 2 may not move beyond the end of minor wave 1 below 1,737.92.
Bearish Alternate Wave Count.
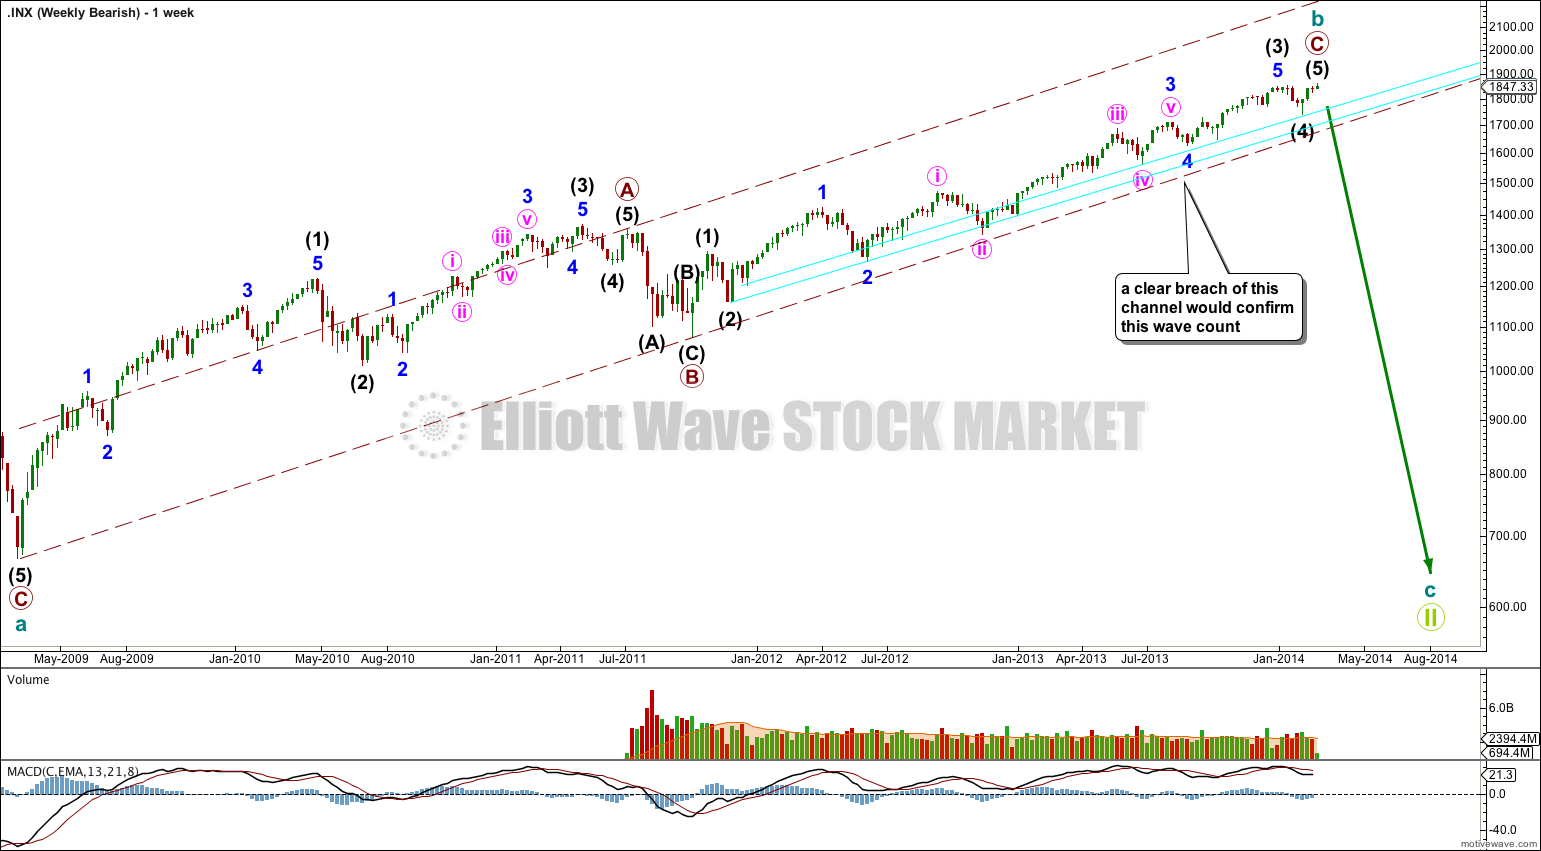
This bearish wave count sees the flat correction beginning September 2000 and ending March 2009 as only cycle wave a within a super cycle wave II expanded flat correction.
Within the huge expanded flat correction cycle wave b may have ended at 1,858.71, or this high may be part of intermediate wave (4) with the final intermediate wave (5) upwards yet to come.
Cycle wave b is now just slightly longer than 138% the length of cycle wave a. It is now longer than the maximum common length of a B wave in relation to an A wave within a flat correction, and so this bearish wave count is now relegated to an alternate. If price continues higher then the probability of this wave count will reduce further.
This bearish wave count requires a clear breach of the lower aqua blue trend line, and the larger maroon – – – channel, before it would again be taken seriously. While price remains within the maroon – – – channel and above the lower aqua blue trend line then we should assume that the trend remains upwards.
It the channel is breached then I would calculate downwards targets for you and this would be my only wave count.
Hi Lara,
It looks like what we got is truncated 5th wave of supercycle 3 and we’re starting supercycle 4 to 1600 range and a final 5th up.
My reasoning is :
Wave 1 –> 1450
Wave 2 –> 1310
Wave 3 –> 1858 ( Extended form)
Wave 4 –> 1600 range
and wave 5 follows.
Please review as it could be important and it’s one of your counts also 🙂
Would this be a wave 5 down?
I would need a chart please.