
The small second wave correction continued higher, turning just below the invalidation point. A small red candlestick for Friday’s session fits the wave count.
The wave count remains the same.
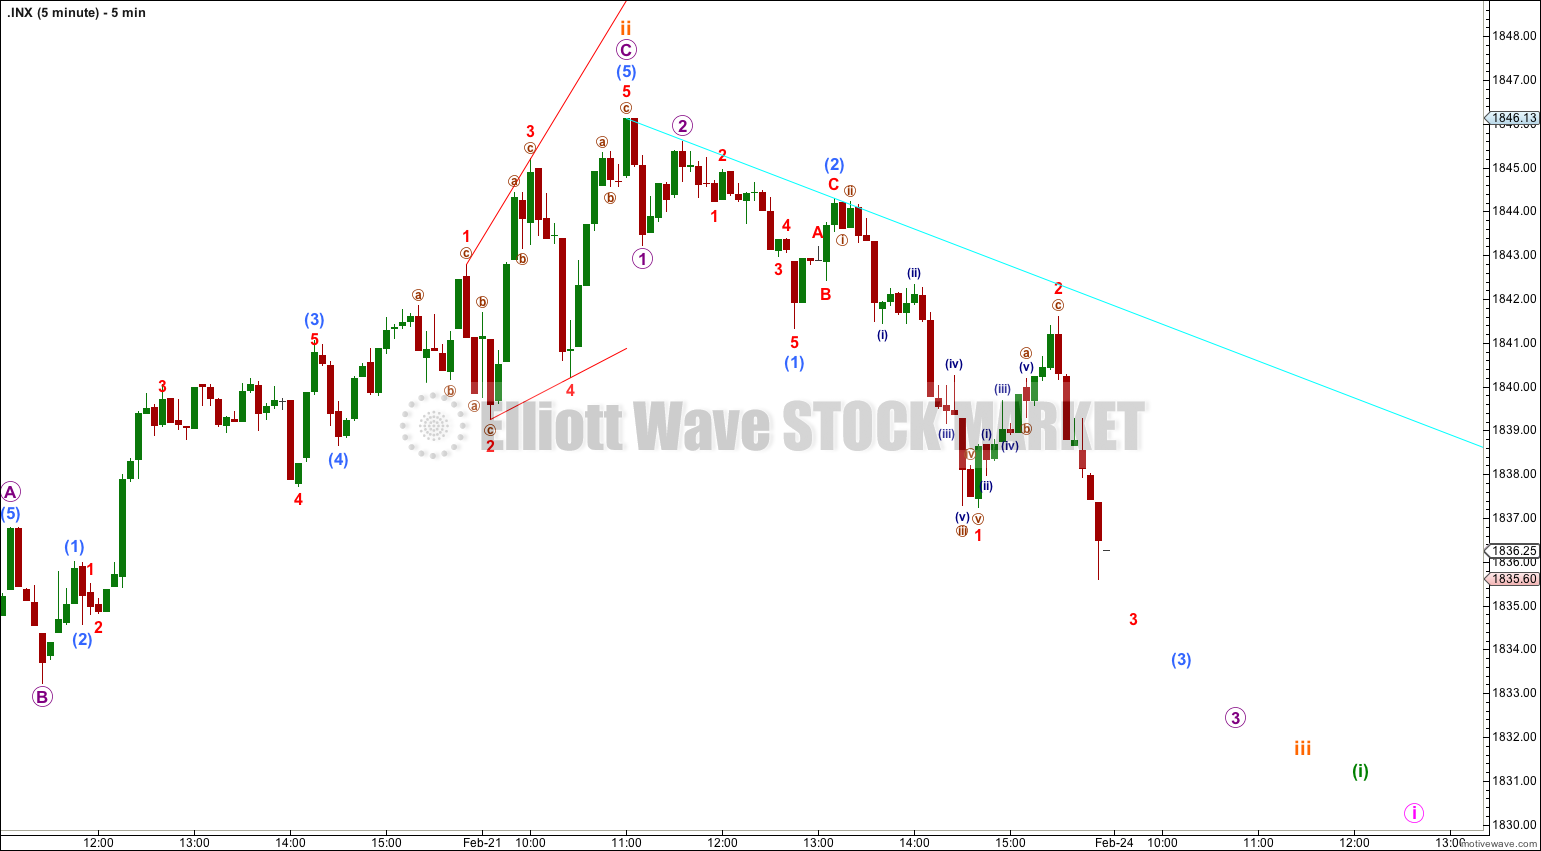
Summary: Minor wave 2 has ended. Minor wave 3 downwards should show an increase in downwards momentum. The target is 1,665 and may be a further 11 or 18 sessions away. The trend is down. I expect upwards corrections may find resistance at the aqua blue trend line on the five minute chart.
Click on the charts below to enlarge.
Main Bearish Wave Count.
This wave count has a higher probability than the bullish alternate. Upwards movement over the last 4 years and 11 months subdivides best as a zigzag. If something is “off” about the supposed recovery then it must be a B wave because there is plenty that is off in this scenario in terms of social mood.
It is possible that cycle wave b is over and that there has been a trend change at cycle degree (bearish wave count) or intermediate wave degree (bullish alternate below). On the monthly chart there is a bearish engulfing candlestick pattern indicating a new bear market has just begun.
There is now a clear five down on the daily chart. This is indication of a trend change, at least at intermediate degree.
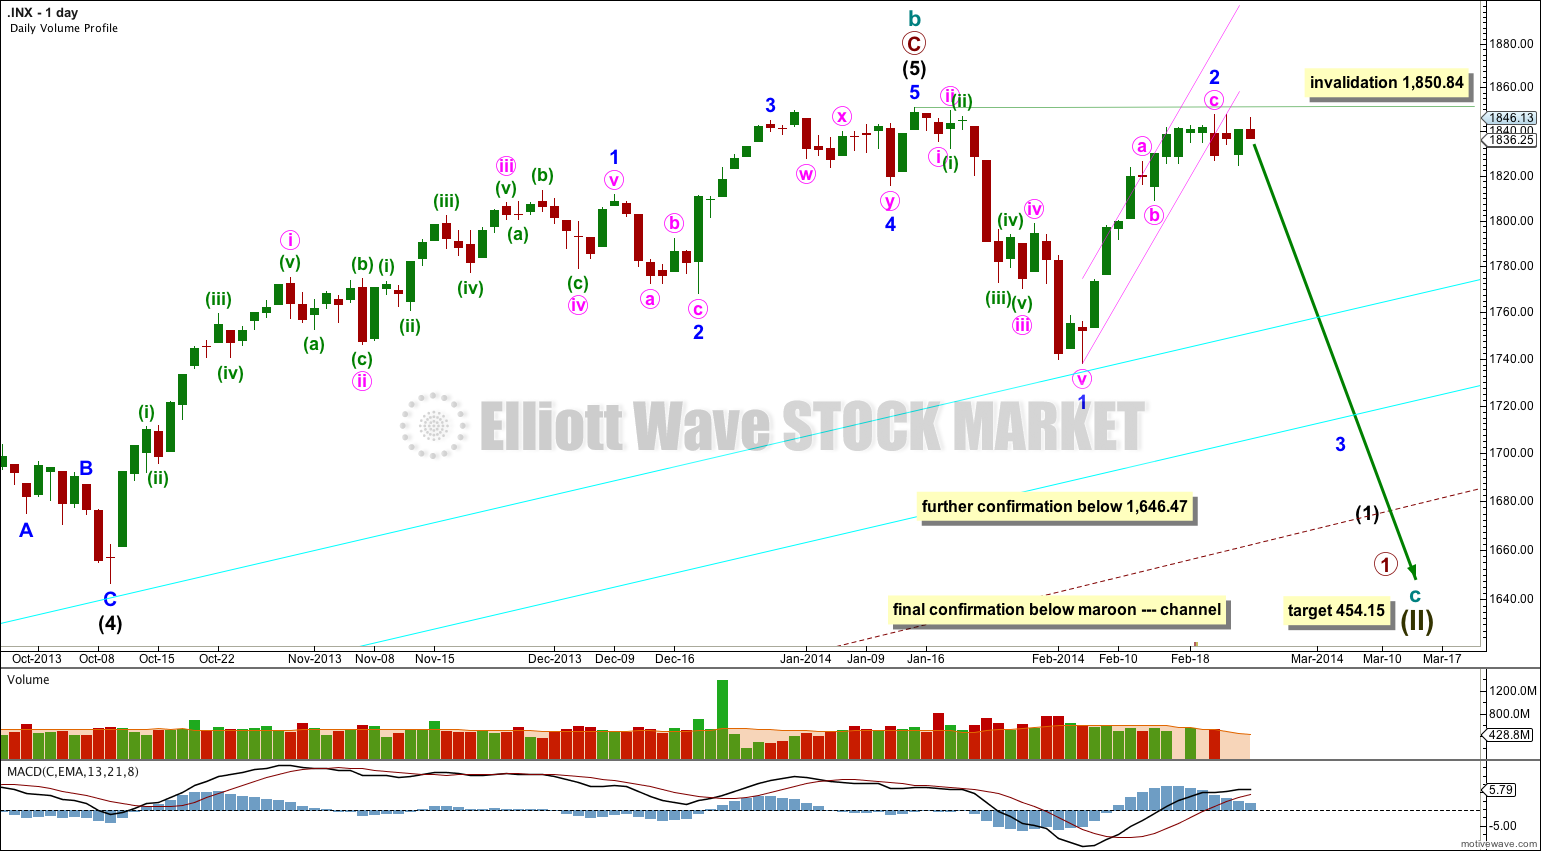
For this main wave count downwards movement must move below 1,530.09 because this super cycle wave (II) must move below the high of super cycle wave (I).
Cycle wave c should last between one to several years and should take price substantially below 666.79.
At 454.15 cycle wave c would reach 1.618 the length of cycle wave a. It should subdivide as a five wave motive structure, most likely a simple impulse, but it may also be an ending diagonal.
Movement below 1,646.47 would provide further confidence in a trend change, at least at intermediate wave degree.
All charts are on a semilogarithmic scale. The lower two aqua blue trend lines are a double trend line from the low of 1,158.66 in November 2011 to 1,266.74 in June 2012 with a parallel copy higher up. On the way down price may find some support here. When the lower of these two aqua trend lines is clearly breached on the daily chart then I would have increased confidence in this wave count. While price remains above the lower aqua blue trend line then I will accept the second alternate is possible.
When the lower edge of the large maroon – – – channel copied over here from the monthly chart is clearly breached by a full daily candlestick below the trend line and not touching it then I would discard the bullish alternate wave counts and this would be my only wave count.
Within cycle wave c no second wave correction may move beyond the start of its first wave. This wave count is invalidated with any movement above 1,850.84.
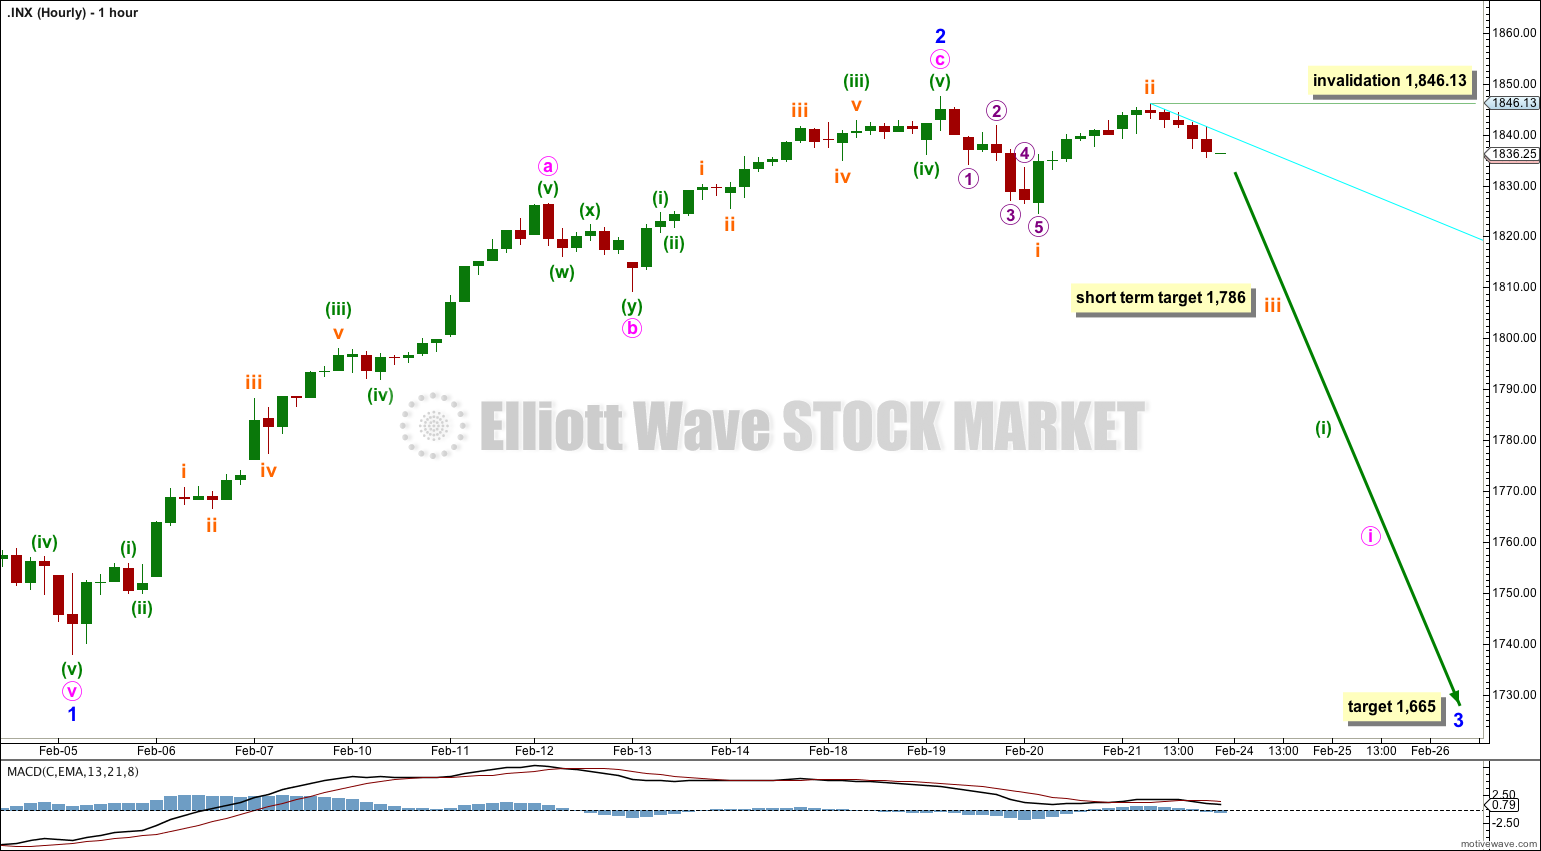
Subminuette wave ii must be over. There is no room left for upwards movement. It is nicely in proportion to subminuette wave i: subminuette wave i lasted seven hours and subminuette wave ii lasted eight.
Downwards movement from the high at 1,846.13 may be beginning to accelerate. I would expect an increase in momentum for Monday.
At 1,786 subminuette wave iii would reach 2.618 the length of subminuette wave i. I am using this Fibonacci ratio to calculate the target because the second wave is exceptionally deep.
The mid term target remains the same. At 1,665 minor wave 3 would reach 1.618 the length of minor wave 1. This target may be about 11 or 18 sessions away, if minor wave 3 exhibits a Fibonacci time relationship and lasts either 13 or 21 days.
Within subminuette wave iii no second wave correction may move beyond the start of its first wave. This wave count is invalidated with movement above 1,846.13.
Bullish Alternate Wave Count.
It is possible that a new cycle degree bull market began at 666.79. So far it is not yet halfway through, and I would expect it to last for a few years (at least five more years and probably longer).
At this stage this alternate bullish wave count does not diverge from the main bearish wave count, and it will not for a few weeks yet.
In the mid term this bullish wave count may have seen an intermediate degree trend change.
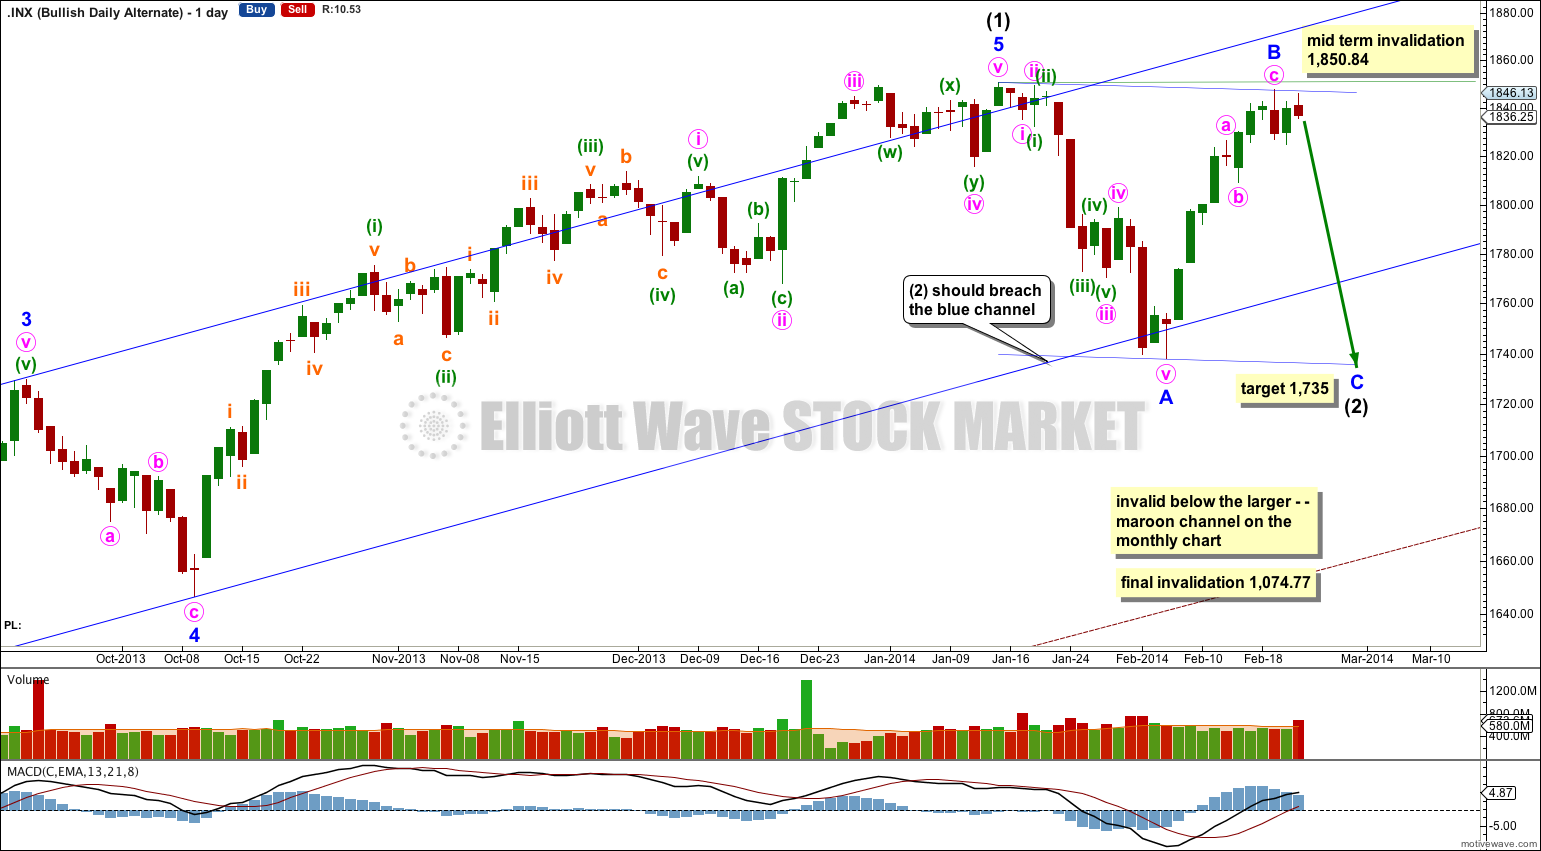
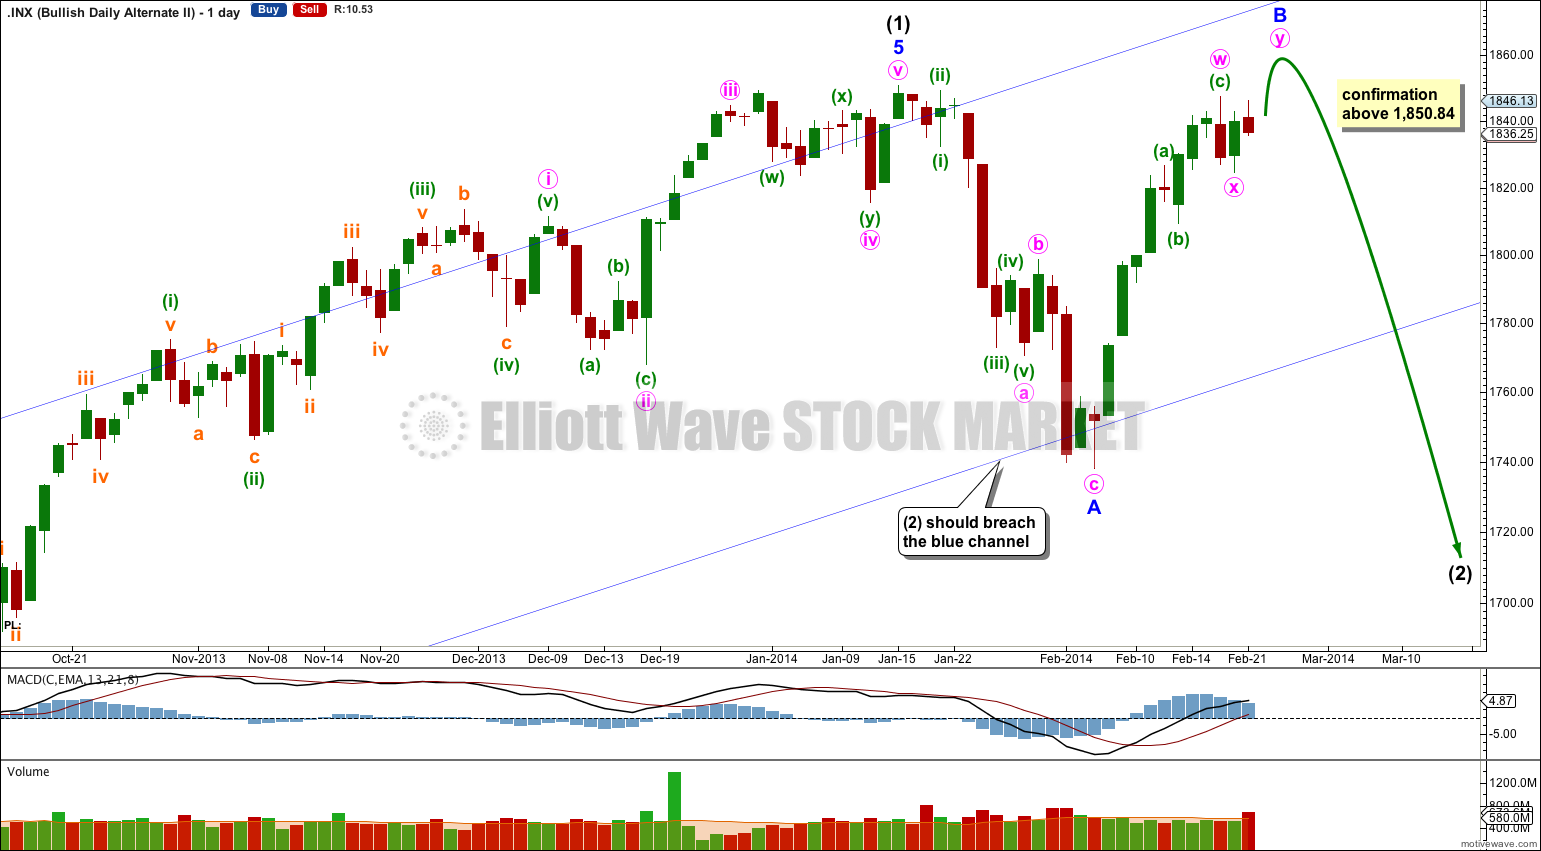
Intermediate wave (2) must subdivide as a three wave corrective structure. If intermediate wave (2) is a zigzag then within it minor wave B may not move beyond the start of minor wave A at 1,850.84.
Within intermediate wave (2) zigzag minor wave C would reach equality in length with minor wave A at 1,735. It may find support and end at the lower edge of the blue parallel channel drawn about intermediate wave (2).
Intermediate wave (2) downwards should breach the lower edge of the wide blue channel here on the daily chart.
Intermediate wave (2) should not breach support at the lower edge of the larger maroon – – – channel which is drawn the same way for both wave counts. For this alternate intermediate wave (2) should not breach the lower edge of the acceleration channel drawn about primary waves 1 and 2, one degree higher.
Second Bullish Alternate Wave Count.
This alternate wave count keeps the labeling within intermediate wave (1) the same as the first bullish alternate, which has the best Fibonacci ratios of all the variations I can see within that movement.
It is still possible that intermediate wave (2) is unfolding as a flat correction if the downwards movement labeled here minor wave A is seen as a zigzag.
By moving the degree of labeling within the upwards zigzag down one degree, this may be the first of a double zigzag for minor wave B. This wave count requires minuette wave (x) to be seen as a three though, which does not fit on the hourly chart. This reduces the probability of this wave count.
Within the flat correction minor wave B may make a new high above 1,850.84. At 1,862.39 minor wave B would reach 105% the length of minor wave A and the structure would be an expanded flat. That would then expect minor wave C downwards to most likely reach 1.618 the length of minor wave A.
Because expanded flats are the most common type of flat this wave count would see a new high as reasonably likely.
If this wave count is confirmed with movement above 1,850.84 then it would be my only wave count which I would publish. With further upwards movement the main bearish wave count reduces in probability so much that it should be relegated to an outside possibility. Above 1,858.03 I would discard it completely.
the second alternate wave count was confirmed with movement above 1,850.84.
This wave count is extremely bullish.
That is correct, yes.
However, that would require the upwards movement from April 2000 to September 2000 to subdivide as a three. Look at it on the daily chart and decide for yourself; is it a three or a five?
If it is a three then your idea fits. If it is a five then the idea does not fit.
If the high of Super Cycle w III is the March 2000 high, then the Cycle wave b could go to 1891.353 and still conform to Elliott 138.2% of Cycle wave a expanded flat guidelines. No?
If the high of Super Cycle w III is the March 2000 high, then the Cycle wave b could go to 1891.353 and still conform to Elliott 138.2% of Cycle wave a guidelines.
No?
Hi Lara
We are currently above 1858, is the bullish alternate the only pattern we need to look at ?
Your question will be answered in the next analysis which I’m working on at the moment.
Now that we are in all time highs and rising fast. Could you post a more bullish wave count? Perhaps one that could take the S&P 500 to the 1,900 level or higher. I mean, we are almost at 1,860, and it seems like we will go much higher from here. It does not look like a B wave, momentum is growing now.
We just crossed the 1850 level. Will the bullish alternative chart take precedence now?
Your question will be answered in the next analysis which I’m working on now.
Mostly the same.
We may see a series of first and second waves which could move price sideways. As long as each successive high is below the previous swing high the wave count will remain the same.
Hi Lara,
For “Second Bullish Alternate Wave Count” to happen, there needs to be increase in upwards momentum.
Do you see that at this point of time in chart?
Thx
I use MACD as a momentum indicator. On the hourly chart momentum is decreasing.
But for the Second Bullish Alternate wave count there does not need to be an increase in momentum. Within a double zigzag the second zigzag does not need to show stronger momentum than the first. It may be about the same, or even a bit less.
Hi Lara,
A question regarding the second bullish alternate (flat correction): is it possible that 1847.50 was just minute a of a zigzag and we are now in minute b (target around 1805), to be followed by minute c/minor B that will take us to a new high? Just wondering if that is something you would see as a possibility. Thanks!
No, because it does not subdivide as a five. A waves of zigzags can only subdivide as fives. This one looks like a three.
Hi Lara,
I am hearing from many technical analysts that the most likely scenario will be for the market to build a high base for a while before making new all time highs.
If the market where to trade sideways for a week, will that invalidate your wave count? What will be the wave count if the market where to start trading sideways for a while, a week or more?
Thanks
Hi Lara,
In your opinion, how significant is the monthly bearish engulfing pattern? Has this pattern shown up before and influenced your analysis or is this particular pattern significant in some other way in your view?
Thanks!
As far as I know a bearish engulfing candlestick pattern is a strong bearish trend change indicator.
Look over monthly charts to see for yourself. It shows up at relatively small and relatively large trend changes. It indicates at least a correction if not a change to a bear market. While price remains within the maroon channel it may indicate a second wave correction at intermediate degree, or a new cycle wave c down for a long term bear market.
There was a strong bearish engulfing candlestick pattern for the months of October / November 2007.
Hi Lara, I didn’t think Jan 2014 technically qualifies as a bearish engulfing candlestick. It did not make a lower low than in Dec. Can you please clarify?
The low does not matter. It is the main body of the candlestick which matters.
A bearish engulfing pattern requires the main body of the second candlestick to completely engulf the main body of the first candlestick.
If we wanted to be completely accurate with this particular example we could correctly state the the January body does not completely engulf the December body because the upper limit of the January body at 1,845.86 is slightly below the close of December at 1,848.36.
The difference is slight. But it’s not enough to create a bullish piercing pattern.
Overall the body of January almost completely engulfs that of December, enough for it to look like a typical bearish engulfing pattern, but the slight difference outlined above may be some small cause for concern. In this instance confirmation by another technical analysis indicator would be a wise thing to wait for.