
This update is in response to the persistent insistence that the S&P 500 will make new highs. I tend to think that because this insistence, after 4 years and 11 months of a bull market, is so strong and so persistent, that it is therefore most likely wrong. At peaks the majority are bullish, right at a huge trend change. At troughs the majority are bearish, again right at a huge trend change.
The stronger people insist it will continue higher, the less likely it is to be so.
However, in order to play devil’s advocate and to keep learning from my past mistakes I will consider this bullish alternate wave count below. I have been wrong before and I most certainly will be wrong again. I am human.
If price breaks above 1,850.84 when markets open for the new trading week then this is the only wave count I would use. I would discard the bearish wave count.
Summary: If price breaks above 1,850.84 next week then the target for upwards movement to end in the mid term is 1,956.
Click on the charts below to enlarge.
Bullish Alternate Wave Count II.
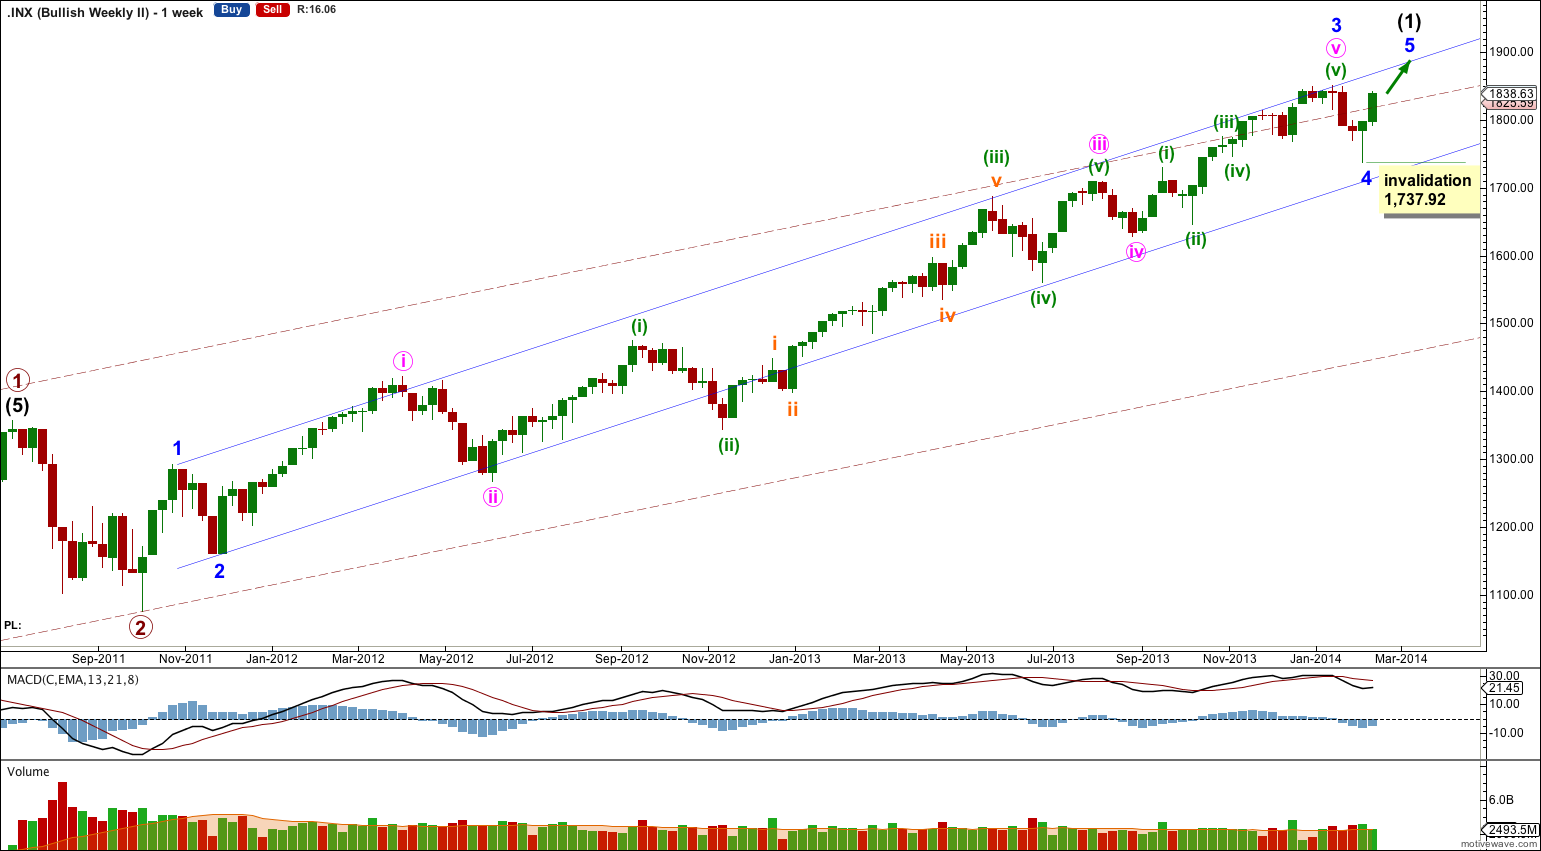
This alternate is identical to the bullish alternate published in the main analysis right up to the low labeled minute wave iv within minor wave 3 within intermediate wave (1). I publish the main bullish weekly chart below to show the difference clearly.
Thereafter, this wave count sees minor wave 3 as only just complete and minor wave 4 over at 1,737.92.
The subdivisions mostly fit within the upwards wave, with one notable exception which will be discussed on the daily chart below.
The strongest upwards momentum is within minuette wave (iii) of minute wave iii of minor wave 3.
Minor wave 3 has no Fibonacci ratio to minor wave 1.
Ratios within minor wave 3 are: minute wave iii is 16.23 longer than 1.618 the length of minute wave i, and minute wave v has no Fibonacci ratio to either of minute waves i or iii.
Ratios within minute wave iii of minor wave 3 are: minuette wave (iii) is just 7.66 points longer than 1.618 the length of minuette wave (i), and minuette wave (v) has no Fibonacci ratio to either of minuette waves (i) or (iii).
Ratios within minute wave v of minor wave 3 are: minuette wave (iii) has no Fibonacci ratio to minuette wave (i), and minuette wave (v) is 2.67 points short of equality with minuette wave (i).
Overall these ratios are good.
If price moves above 1,850.84 then minor wave 4 would be very likely to be over as a single zigzag.
The downwards movement of minor wave 4 must be seen as a zigzag. It corresponds with MACD strongly crossing the zero line, which is a little unusual for fourth waves.
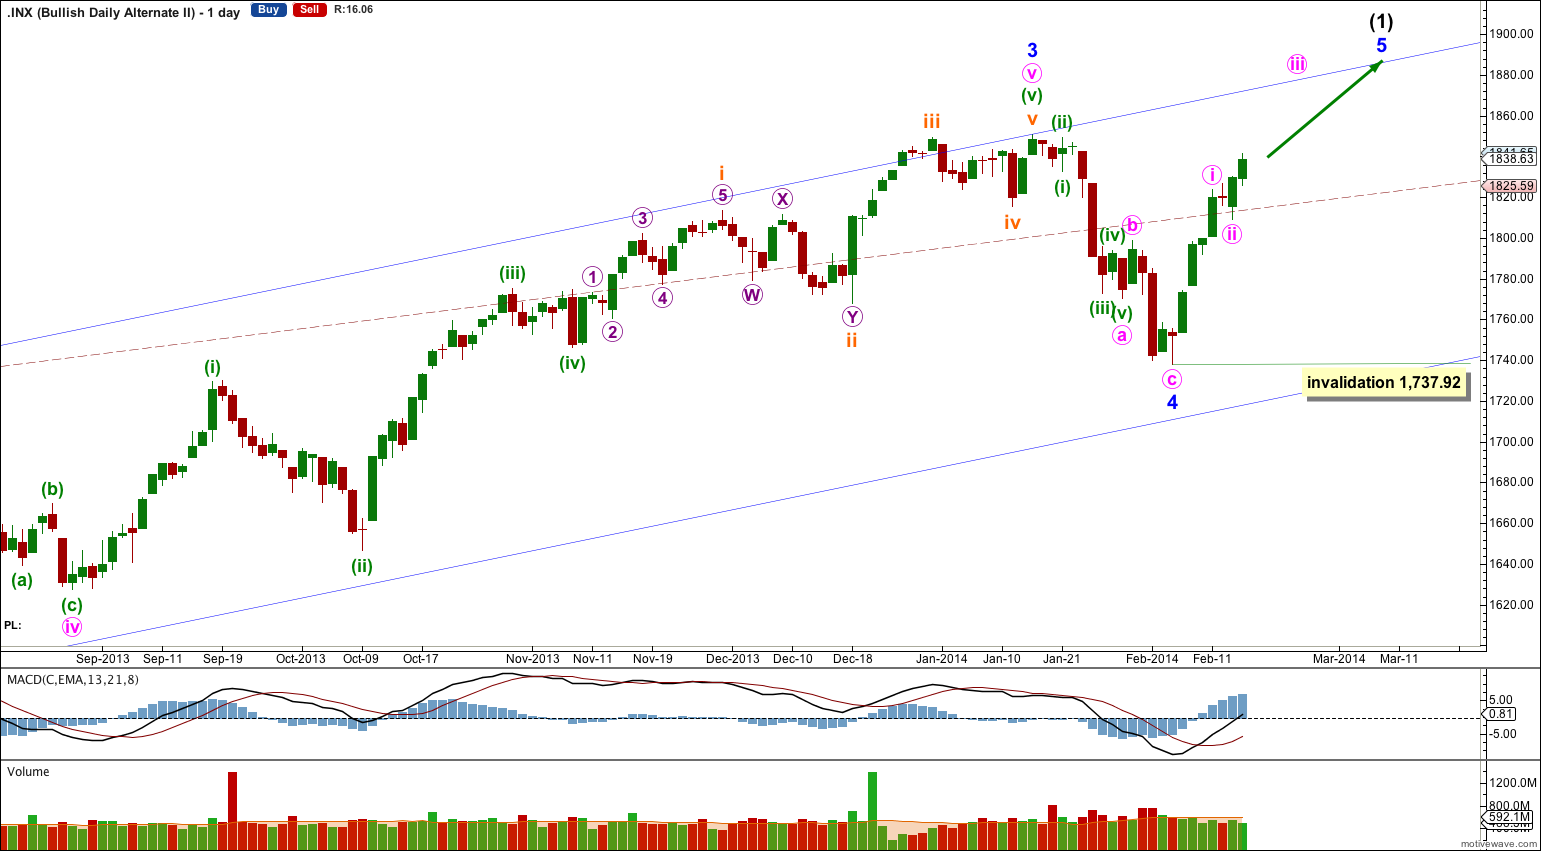
The biggest problem I have with this wave count is the subdivisions of subminuette wave ii within minor wave 3. On the main wave count the impulse ends at the high labeled micro wave X as a truncated fifth wave. On the five minute chart that upwards piece subdivides as a five. On this wave count it must be seen as a three. This piece of movement seems forced. It is entirely possible my analysis of the five minute chart there is wrong and this movement was all part of a double zigzag correction.
I also would be concerned for this wave count that the start of a possible third wave up for minute wave iii in the last two days trading is showing a slowing of momentum and volume on the hourly chart. It could redeem itself next week if momentum increases and we see a volume spike.
Bullish Alternate Wave Count.
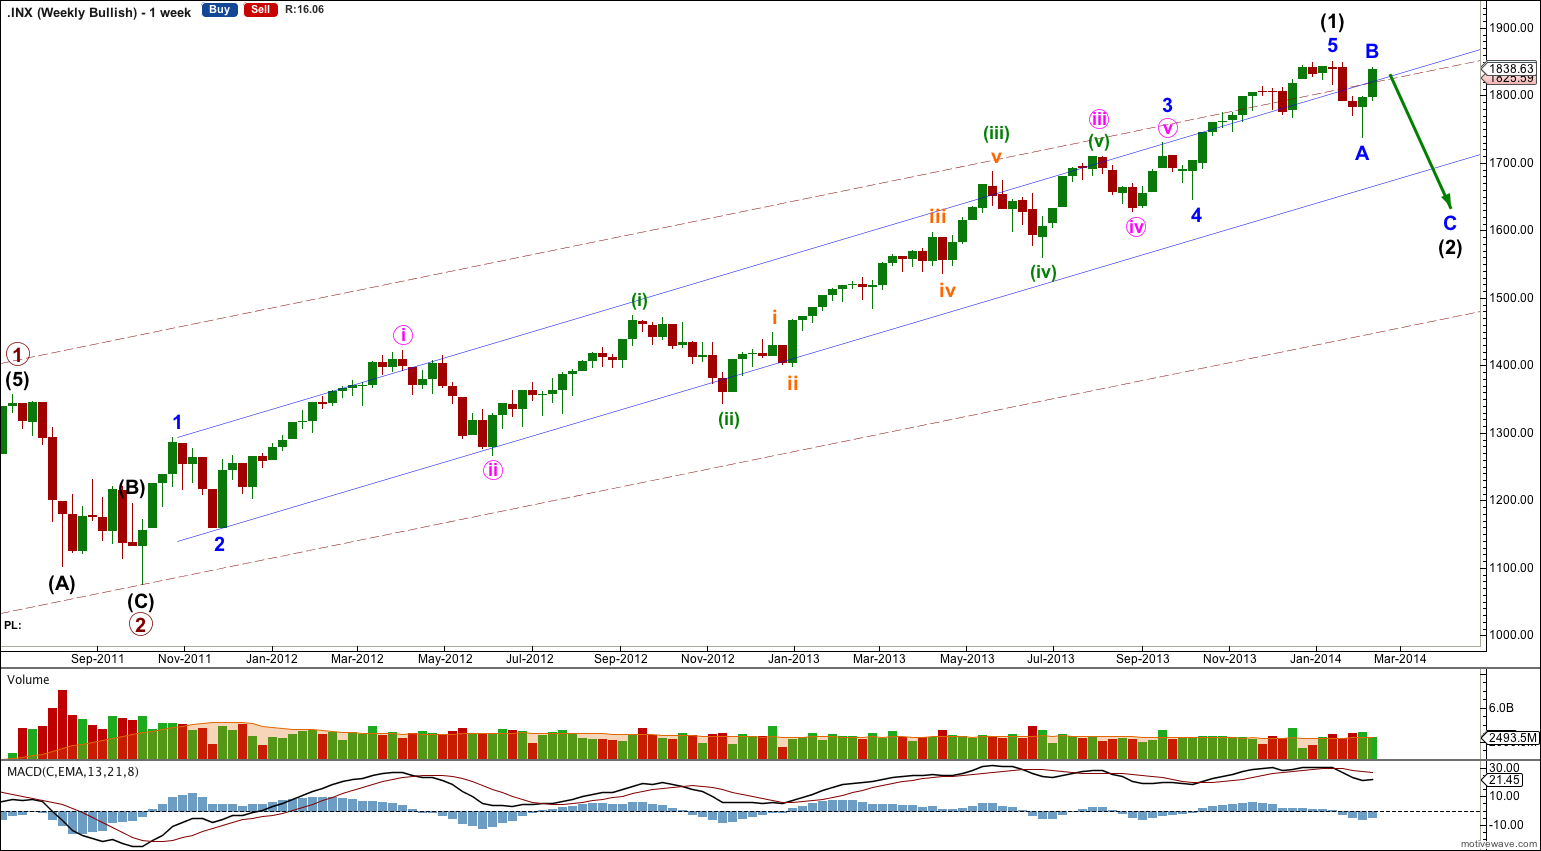
In order to see the difference between the new alternate above and the bullish alternate I have been using for a long time now, I publish the main bullish alternate at the weekly chart level.
Ratios within intermediate wave (1) are: minor wave 3 is just 0.76 longer than 2.618 the length of minor wave 1, and minor wave 5 is 13.52 longer than equality with minor wave 1.
Ratios within minor wave 3 are: minute wave iii is 16.23 longer than 1.618 the length of minute wave i, and minute wave v is just 1.65 points longer than 0.382 the length of minute wave i.
Ratios within minute wave iii are: minuette wave (iii) is 7.66 points longer than 1.618 the length of minuette wave (i), and minuette wave (v) has no Fibonacci ratio to minuette waves (iii) or (i).
Overall these ratios are better than the new alternate.
Strongest upwards momentum is still within the middle of the third wave; it is within minuette wave (iii) of minute wave iii of mionr wave 3.
Oh yes, that’s most certainly possible.
This idea will be a much better bullish alternate than what I have come up with so far.
Thank you for the idea Steve!
Futures are going higher, ahhh. Is there any chance this is an expanded flat on the S&P 500? With wave A already in place and wave B finishing up?
Lara, does this mean we have now abandoned any bearish count?
Absolutely not.
This is an alternate only.