
Upwards movement continued as expected towards the target which has not yet been met. The target remains the same.
The wave count remains the same.
Summary: Minor wave 2 may end in just one more day about 1,843.When the parallel channel on the hourly chart is clearly beached then I would expect minor wave 3 may have begun.
Click on the charts below to enlarge.
Main Bearish Wave Count.
This wave count has a higher probability than the bullish alternate. Upwards movement over the last 4 years and 11 months subdivides best as a zigzag. If something is “off” about the supposed recovery then it must be a B wave because there is plenty that is off in this scenario in terms of social mood.
It is possible that cycle wave b is over and that there has been a trend change at cycle degree (bearish wave count) or intermediate wave degree (bullish alternate below). On the monthly chart there is a bearish engulfing candlestick pattern indicating a new bear market has just begun.
There is now a clear five down on the daily chart. This is indication of a trend change, at least at intermediate degree.
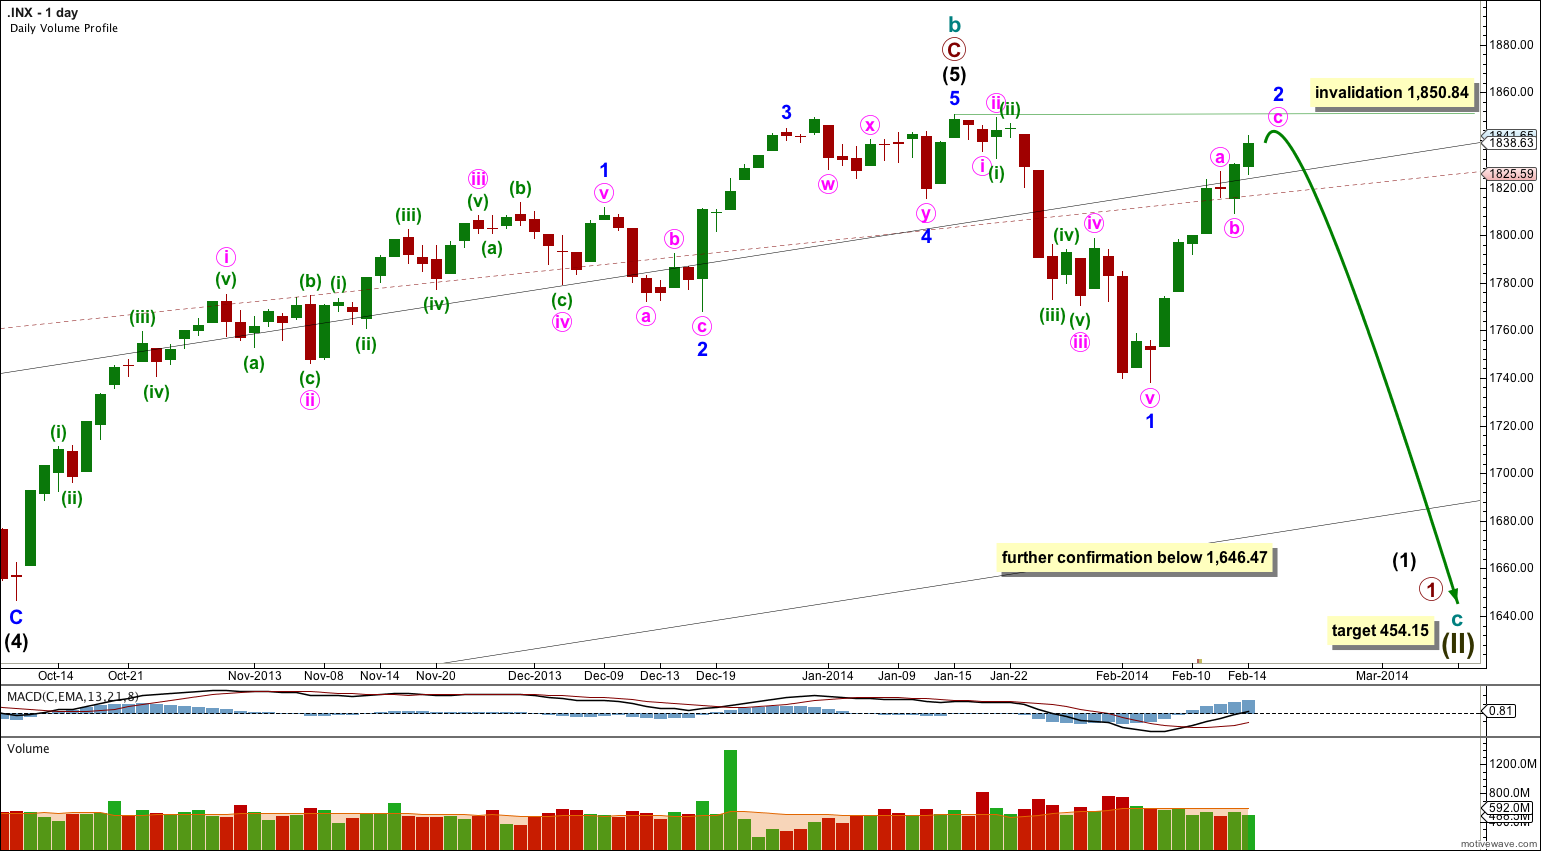
For this main wave count downwards movement must move below 1,530.09 because this super cycle wave (II) must move below the high of super cycle wave (I).
Cycle wave c should last between one to several years and should take price substantially below 666.79.
At 454.15 cycle wave c would reach 1.618 the length of cycle wave a. It should subdivide as a five wave motive structure, most likely a simple impulse, but it may also be an ending diagonal.
Movement below 1,646.47 would provide further confidence in a trend change, at least at intermediate wave degree.
If downwards movement breaches the maroon – – – channel on the monthly chart then I would discard the bullish alternate and this would be my only wave count.
Within cycle wave c no second wave correction may move beyond the start of its first wave. This wave count is invalidated with any movement above 1,850.84.
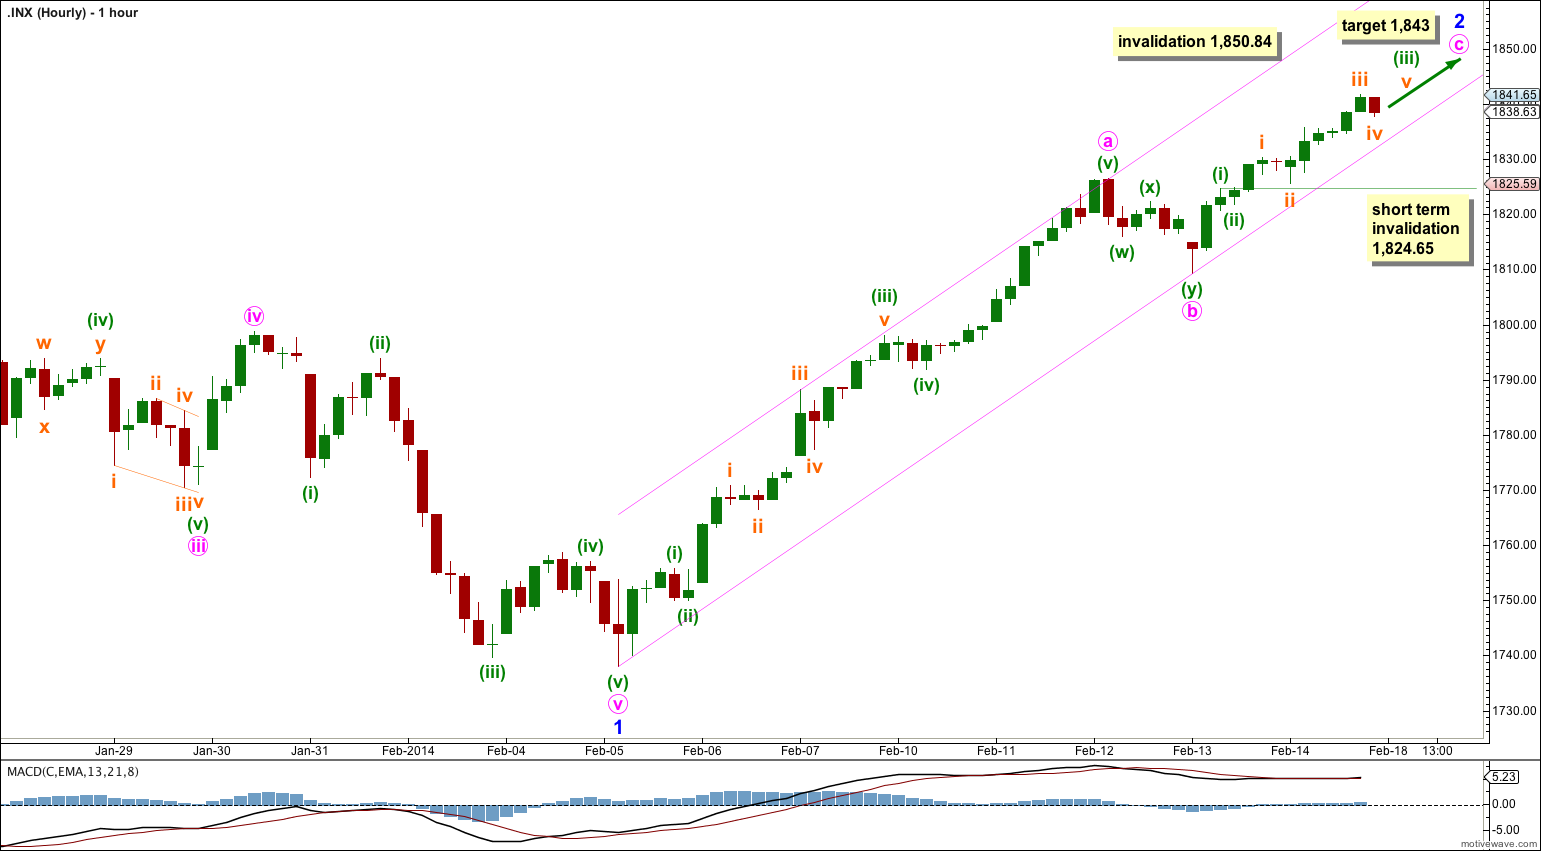
Minor wave 2 is an almost complete zigzag. So far it has lasted seven days. If it continues for another one day it may total a Fibonacci eight days. This expectation looks to be correct now.
At 1,843 minute wave c would reach 0.382 the length of minute wave a.
Second waves can and often do correct to very deep degrees, and when they do this they convince us there has been no trend change right before a strong third wave takes off in the opposite direction.
I have drawn a small channel about minor wave 2 using Elliott’s technique. Draw the first trend line from the start of minute wave a to the end of minute wave b. Place a parallel copy upon the end of minute wave a. I would expect minute wave c to be most likely to end about the mid line of this channel.
When this channel is very clearly breached by at least one full hourly candlestick below it and not touching the lower trend line then I would consider that is confirmation that minor wave 2 is over and minor wave 3 is underway.
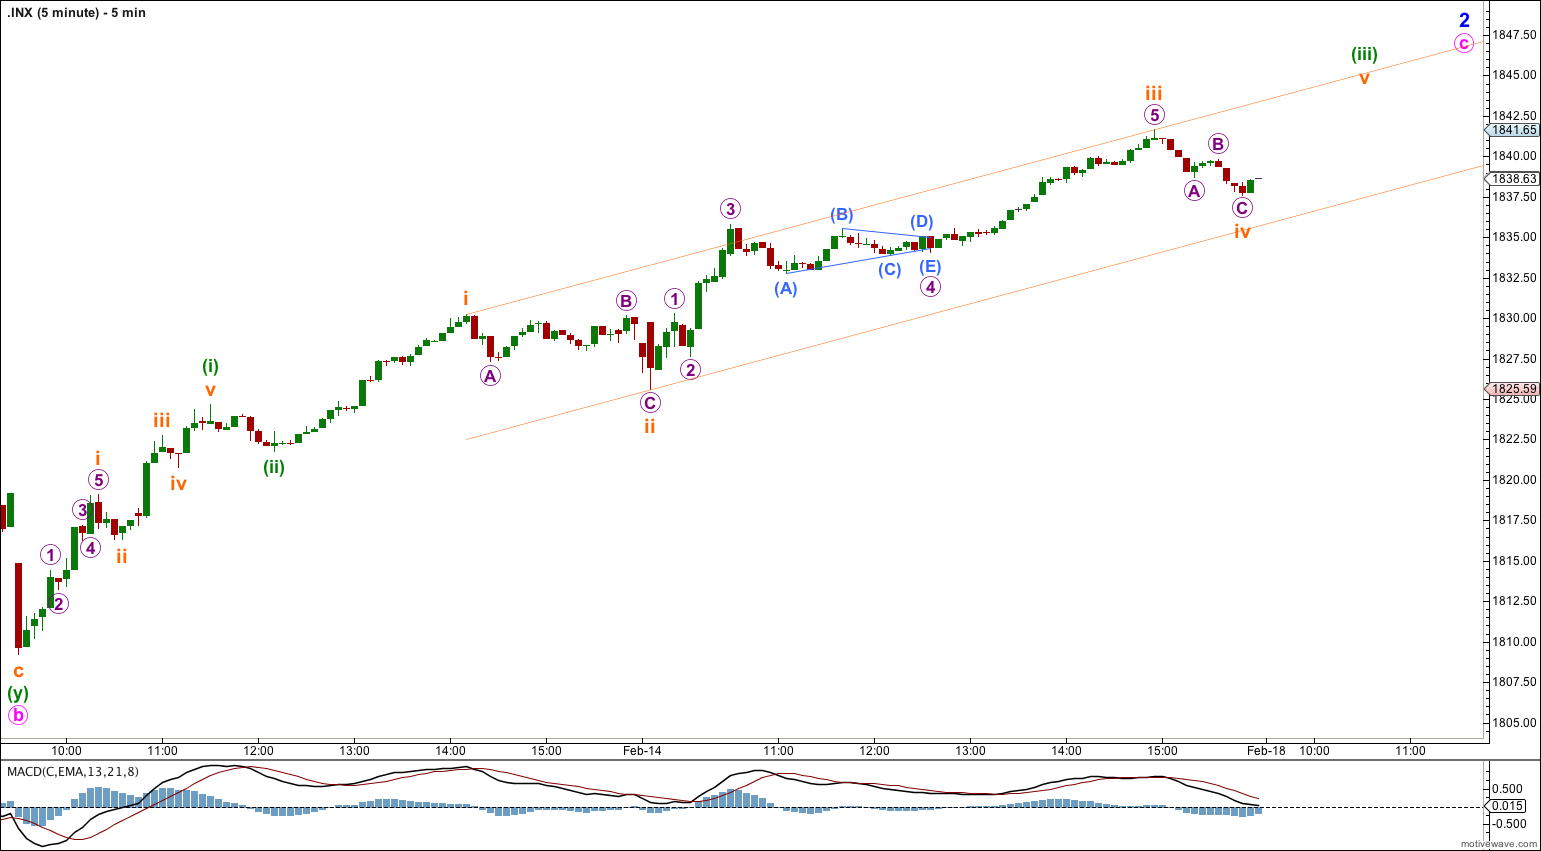
Minute wave c is showing a leveling off and a very slight decrease in momentum. This upwards movement from 1,809.22 does not look like a third wave at all.
Within minute wave c minuette wave (iv) may not move into minuette wave (i) price territory. This wave count is invalidated in the very short term with movement below 1,824.65.
When minute wave c is a complete structure then the invalidation point no longer applies. Whether or not the target is reached on Monday, if the channel about minor wave 2 is breached at that stage I would expect that minor wave 3 has most likely begun.
Minor wave 2 may not move beyond the start of minor wave 1. This wave count is invalidated with movement above 1,850.84.
Bullish Alternate Wave Count.
It is possible that a new cycle degree bull market began at 666.79. So far it is not yet halfway through, and I would expect it to last for a few years (at least five more years and probably longer).
At this stage this alternate bullish wave count does not diverge from the main bearish wave count, and it will not for a few to several weeks yet.
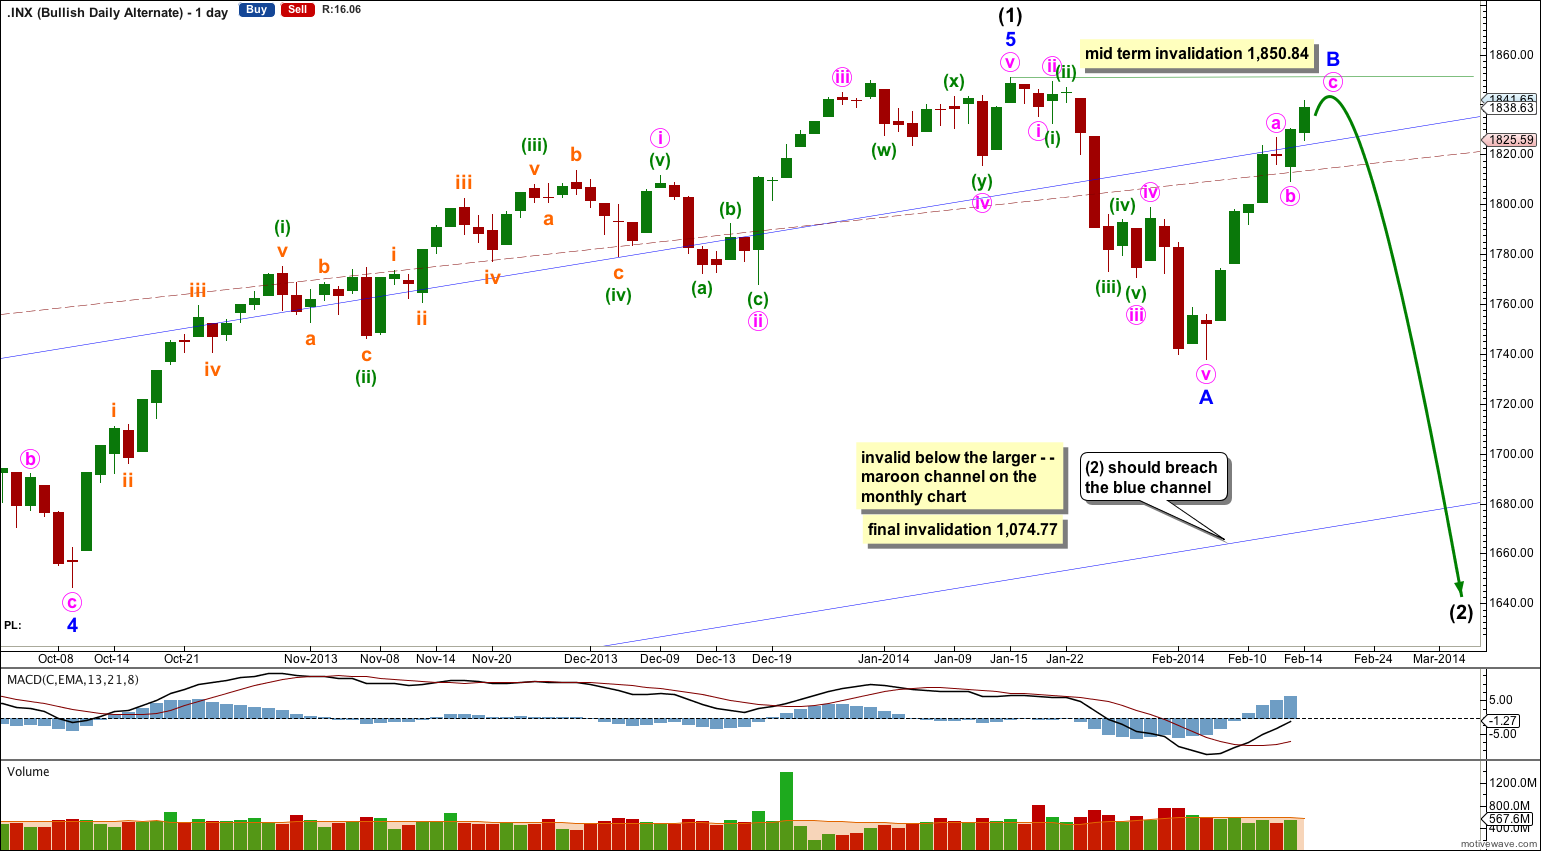
In the mid term this bullish wave count may have seen an intermediate degree trend change.
Intermediate wave (2) must subdivide as a three wave corrective structure. The first downwards movement within it must subdivide as a five and within it no second wave correction may move beyond the start of its first wave. This trend change is invalidated with any movement above 1,850.84.
Intermediate wave (2) downwards should last several weeks to a couple of months or so, and should breach the lower edge of the wide blue channel here on the daily chart.
Intermediate wave (2) should not breach support at the lower edge of the larger maroon – – – channel which is drawn the same way for both wave counts. For this alternate intermediate wave (2) should not breach the lower edge of the acceleration channel drawn about primary waves 1 and 2, one degree higher.
Hi Lara,
While most of the trader community and other EW analysts see this as impulsive move upwards crossing 1850 + , your analysis points to downward C wave from 1843 levels.
What are the odds that 1850+ impulsive wave is off the picture?
Thx
When the majority of the community expect a bull market, and we’re at the end of an almost five year climb, then I would suggest that lots of those predictions are wrong.
Yes. I’m also with the opinion of correction . But thx for clarification.
Hi Lara, on your written analysis could you please put the time of day that you are carrying it out in terms of New York (Eastern) time. This would be most useful – I know that you do it for the videos.