
The S&P has produced a red candlestick which was expected for Wednesday’s session, although I had expected it to show up earlier.
The wave count remains the same.
Summary: I expect tomorrow’s session to begin with a little more downwards movement towards 1,809. Thereafter, price should continue higher. The trend remains up at minor degree. I may be able to calculate a target for this upwards trend to end for you tomorrow.
Click on the charts below to enlarge.
Main Bearish Wave Count.
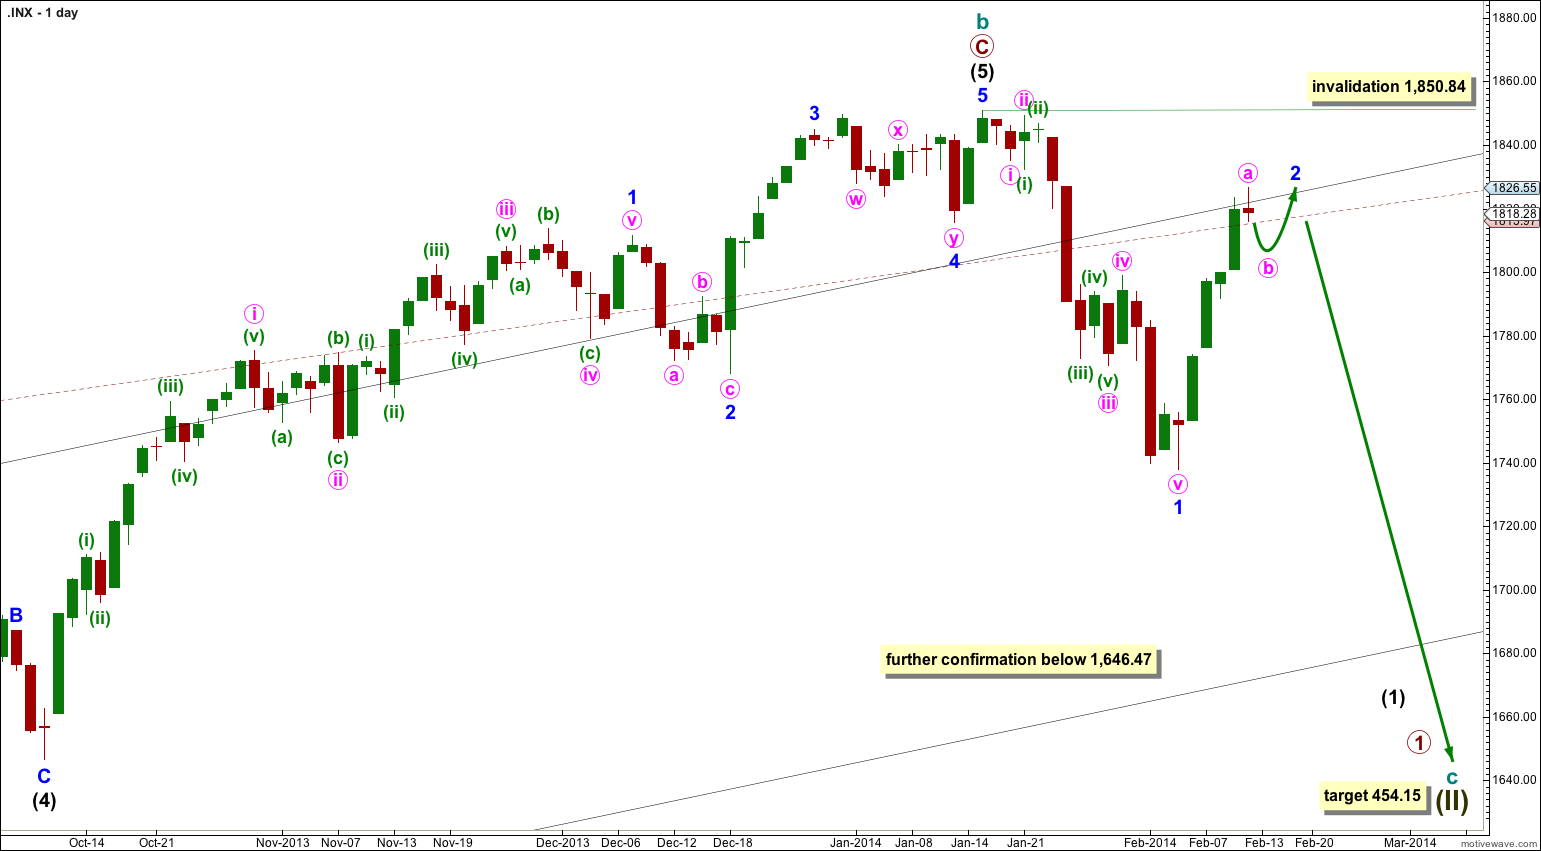
This wave count has a higher probability than the bullish alternate. Upwards movement over the last 4 years and 11 months subdivides best as a zigzag. If something is “off” about the supposed recovery then it must be a B wave because there is plenty that is off in this scenario in terms of social mood.
It is possible that cycle wave b is over and that there has been a trend change at cycle degree (bearish wave count) or intermediate wave degree (bullish alternate below). On the monthly chart there is a bearish engulfing candlestick pattern indicating a new bear market has just begun.
There is now a clear five down on the daily chart. This is indication of a trend change, at least at intermediate degree.
For this main wave count downwards movement must move below 1,530.09 because this super cycle wave (II) must move below the high of super cycle wave (I).
Cycle wave c should last between one to several years and should take price substantially below 666.79.
At 454.15 cycle wave c would reach 1.618 the length of cycle wave a. It should subdivide as a five wave motive structure, most likely a simple impulse, but it may also be an ending diagonal.
Movement below 1,646.47 would provide further confidence in a trend change, at least at intermediate wave degree.
If downwards movement breaches the maroon – – – channel on the monthly chart then I would discard the bullish alternate and this would be my only wave count.
Within cycle wave c no second wave correction may move beyond the start of its first wave. This wave count is invalidated with any movement above 1,850.84.
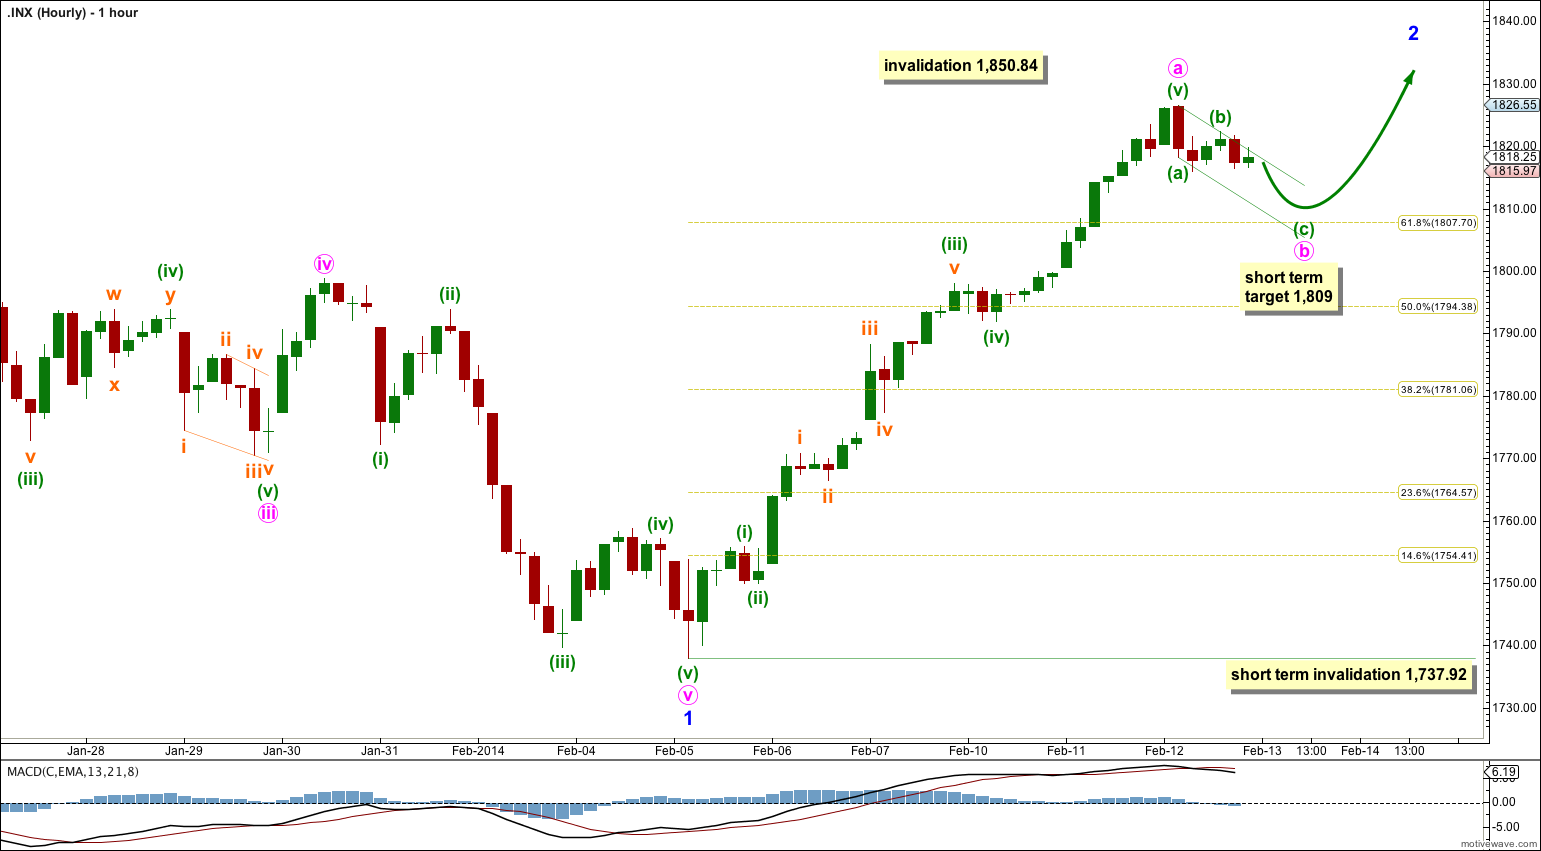
Minor wave 2 looks most likely to be unfolding as a simple zigzag. Within the zigzag minute wave a is now complete. Minute wave b is incomplete.
Within minute wave b minuette wave (c) would reach 1.618 the length of minuette wave (a) at 1,809. Minuette wave (c) may find support at the lower edge of the small green channel I have drawn about minute wave b.
Use this small channel to indicate when minute wave b is most likely over. When this channel is very clearly breached by upwards movement then I would expect that minute wave b is complete and minute wave c may be underway. I would expect minute wave c to be a lot shorter than minute wave a in both price and time. It may be 0.382 the length of minute wave a if it is 33.86 points in length.
Minor wave 1 lasted 14 days, just one more than a Fibonacci 13. Minor wave 2 so far has lasted five days and it is incomplete. If it lasts another three days it may end in a Fibonacci eight days.
When minute wave b within this zigzag is complete then I will draw a parallel channel about the whole of minor wave 2. That channel will show where it may end and will provide confirmation of when it is over.
Minor wave 2 may not move beyond the start of minor wave 1. This wave count is invalidated with movement above 1,850.84.
Bullish Alternate Wave Count.
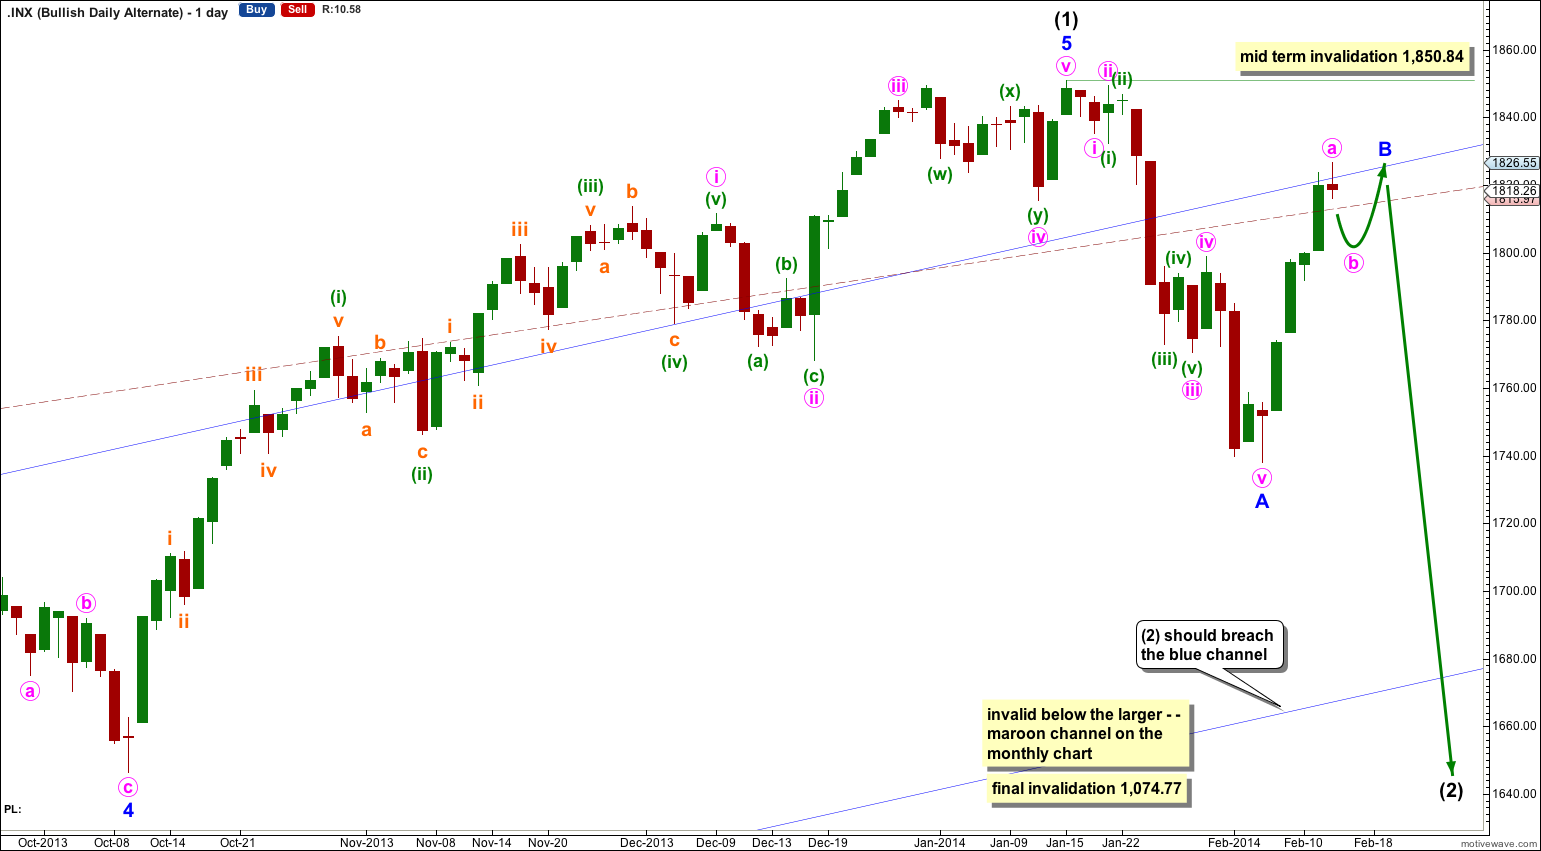
It is possible that a new cycle degree bull market began at 666.79. So far it is not yet halfway through, and I would expect it to last for a few years (at least five more years and probably longer).
At this stage this alternate bullish wave count does not diverge from the main bearish wave count, and it will not for a few to several weeks yet.
In the mid term this bullish wave count may have seen an intermediate degree trend change.
Intermediate wave (2) must subdivide as a three wave corrective structure. The first downwards movement within it must subdivide as a five and within it no second wave correction may move beyond the start of its first wave. This trend change is invalidated with any movement above 1,850.84.
Intermediate wave (2) downwards should last several weeks to a couple of months or so, and should breach the lower edge of the wide blue channel here on the daily chart.
Intermediate wave (2) should not breach support at the lower edge of the larger maroon – – – channel which is drawn the same way for both wave counts. For this alternate intermediate wave (2) should not breach the lower edge of the acceleration channel drawn about primary waves 1 and 2, one degree higher.
I hope so.
I am trying to see what I could have wrong here. If the bullish wave count is correct, we’re in a long term bull market, and my analysis of the downwards movement I have labeled there minor wave B is not a five but a three, then yes we may see a new high.
At this stage that is the only scenario I can see where the wave count would fit to see a continuation of the upwards trend.
Hi Lara-
Sorry if I’m asking a lot of questions, but how common is a ZZ where c=.382*a. I’ve seen a lot of c=.618*a like I mentioned over on your gold site. It seems awfully shallow for a b wave.
No worries.
But… what is a ZZ? Do you mean a triple combination; W-X-Y-X-Z?
Triples are exceeding rare. And they are also the most commonly mislabeled structure. Any “Elliott Wave” analysis which has a triple labeled, and within it a multiple (within either of W, Y or Z) is invalid and not Elliott wave.
B waves are hugely variable. Of all the waves to analyse they are the most difficult. They can be very choppy and overlapping, or sometimes they can fool us and look suspiciously like impulses (the key there is to look at momentum). B waves can be shallow or deep.
I have seem many zigzags where C = 0.382 or 0.618 or even 0.146 of A. Again, this is hugely variable. I have also seen a huge number of zigzags where C has no Fibonacci ratio to A. I maintain that the ratio between 1. 3 and 5 within impulses is more reliable than the ratio between A and C of zigzags, particularly for the S&P.
Tomorrow I will have to consider the alternate where we can move the degree of labeling within minute b down one degree; it may be that only minuette wave (a) (or w) has completed and this minute wave b is only just under halfway through.
Decline from the top – 1850 was double zigzag, and nowadays rally is impulsive. Tomorrow morning finishing second wave and ahead is third wave with new highs.
The current rally would not be confirmed as impulsive until it is clearly an impulse… and prior to that we would want to see a clear third wave up to have an indication that an impulse is unfolding.
If the next wave up shows a clear increase in upwards momentum and has a volume spike then yes, it may be an impulse.
To call it an impulse prior to that is premature.
Yeah but then will be to late for long positions 🙂
for me decline from 1850 has broken a lot of rules, very complicated, looks better like zigzag.
will see in next days 🙂
Also that might be wave 4 from 2011 wave 2 decline.
This wave 4 might be also underway, irregular, new high and after 5 waves down.
In daily chart maybe it is impulsive but in minute chart (5min. to 30 min.) a lot of guidelines broken.
Regards 🙂
What rules are broken in the decline from 1,850? Are you referring to my wave count which sees it as an impulse? Please be specific. A general criticism that states the decline “breaks rules” is too vague and so is meaningless.
If 1,850.84 is breached then I would expect that we have a lot more upwards movement to go so it would not be too late for long positions.
And to finish off, on February 4th I predicted upwards movement for this second wave correction. So the opportunity has been there for long positions to be taken several days ago.
Lara has been nearly spot on and her bearish count looks very accurate to me. Those criticizing don’t provide any specifics, just conjecture. She will be proven correct soon enough.