
The downwards movement which was expected did not happen. Price has moved higher again. This correction is still incomplete.
The wave count remains the same.
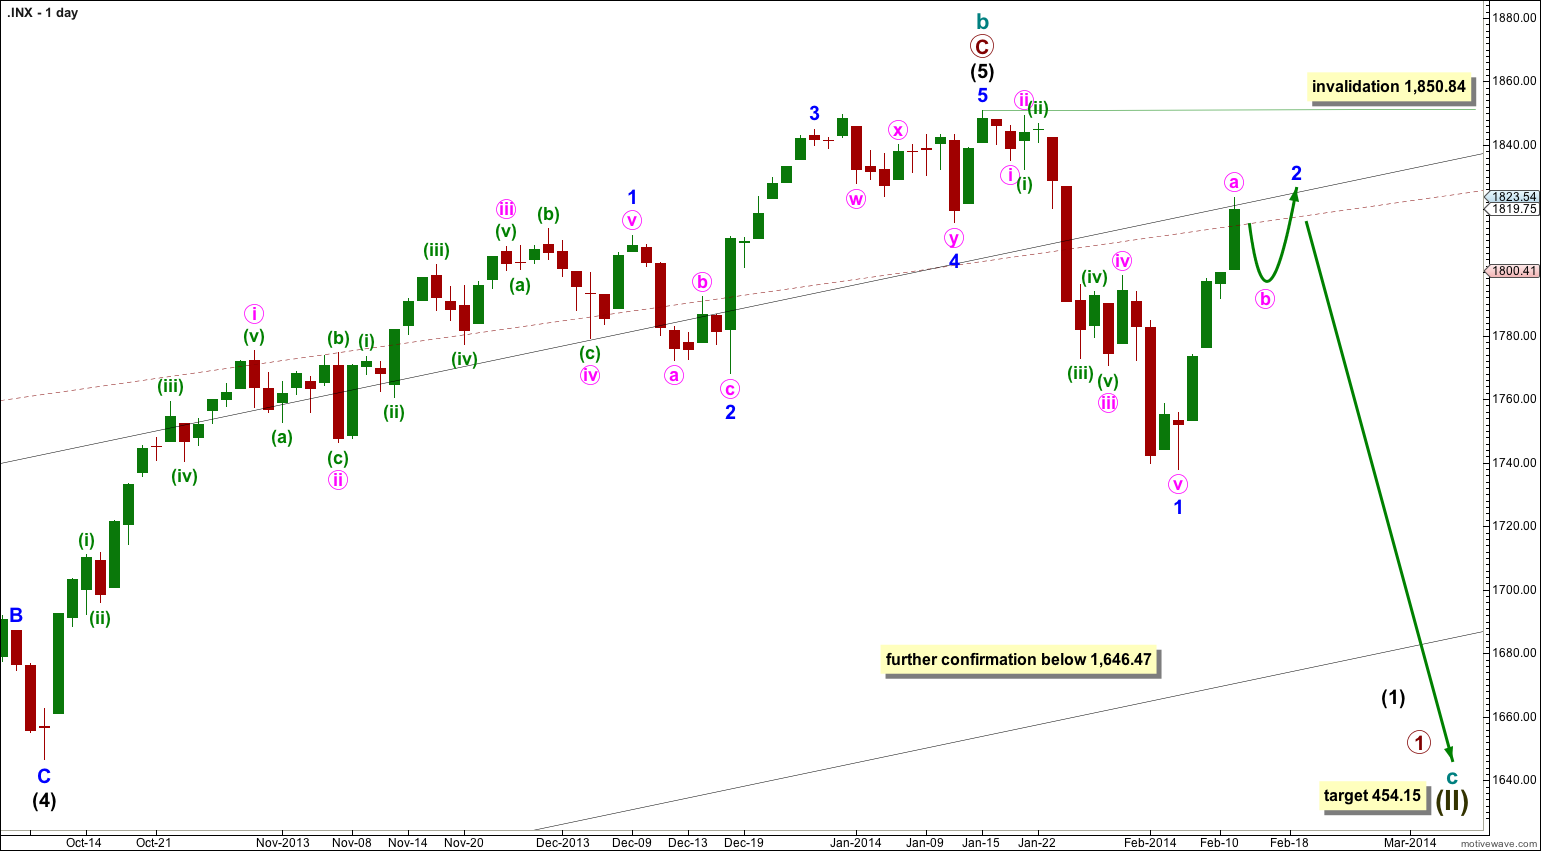
Summary: Minor wave 2 may be completing as a deep zigzag. The structure is incomplete, and it still needs minute wave b down and finally minute wave c upwards. Overall I expect choppy overlapping movement to complete this correction, with new highs above 1,823.54 to end it but not above 1,850.84.
Click on the charts below to enlarge.
Main Bearish Wave Count.
This wave count has a higher probability than the bullish alternate. Upwards movement over the last 4 years and 11 months subdivides best as a zigzag. If something is “off” about the supposed recovery then it must be a B wave because there is plenty that is off in this scenario in terms of social mood.
It is possible that cycle wave b is over and that there has been a trend change at cycle degree (bearish wave count) or intermediate wave degree (bullish alternate below). On the monthly chart there is a bearish engulfing candlestick pattern indicating a new bear market has just begun.
There is now a clear five down on the daily chart. This is indication of a trend change, at least at intermediate degree.
For this main wave count downwards movement must move below 1,530.09 because this super cycle wave (II) must move below the high of super cycle wave (I).
Cycle wave c should last between one to several years and should take price substantially below 666.79.
At 454.15 cycle wave c would reach 1.618 the length of cycle wave a. It should subdivide as a five wave motive structure, most likely a simple impulse, but it may also be an ending diagonal.
Movement below 1,646.47 would provide further confidence in a trend change, at least at intermediate wave degree.
If downwards movement breaches the maroon – – – channel on the monthly chart then I would discard the bullish alternate and this would be my only wave count.
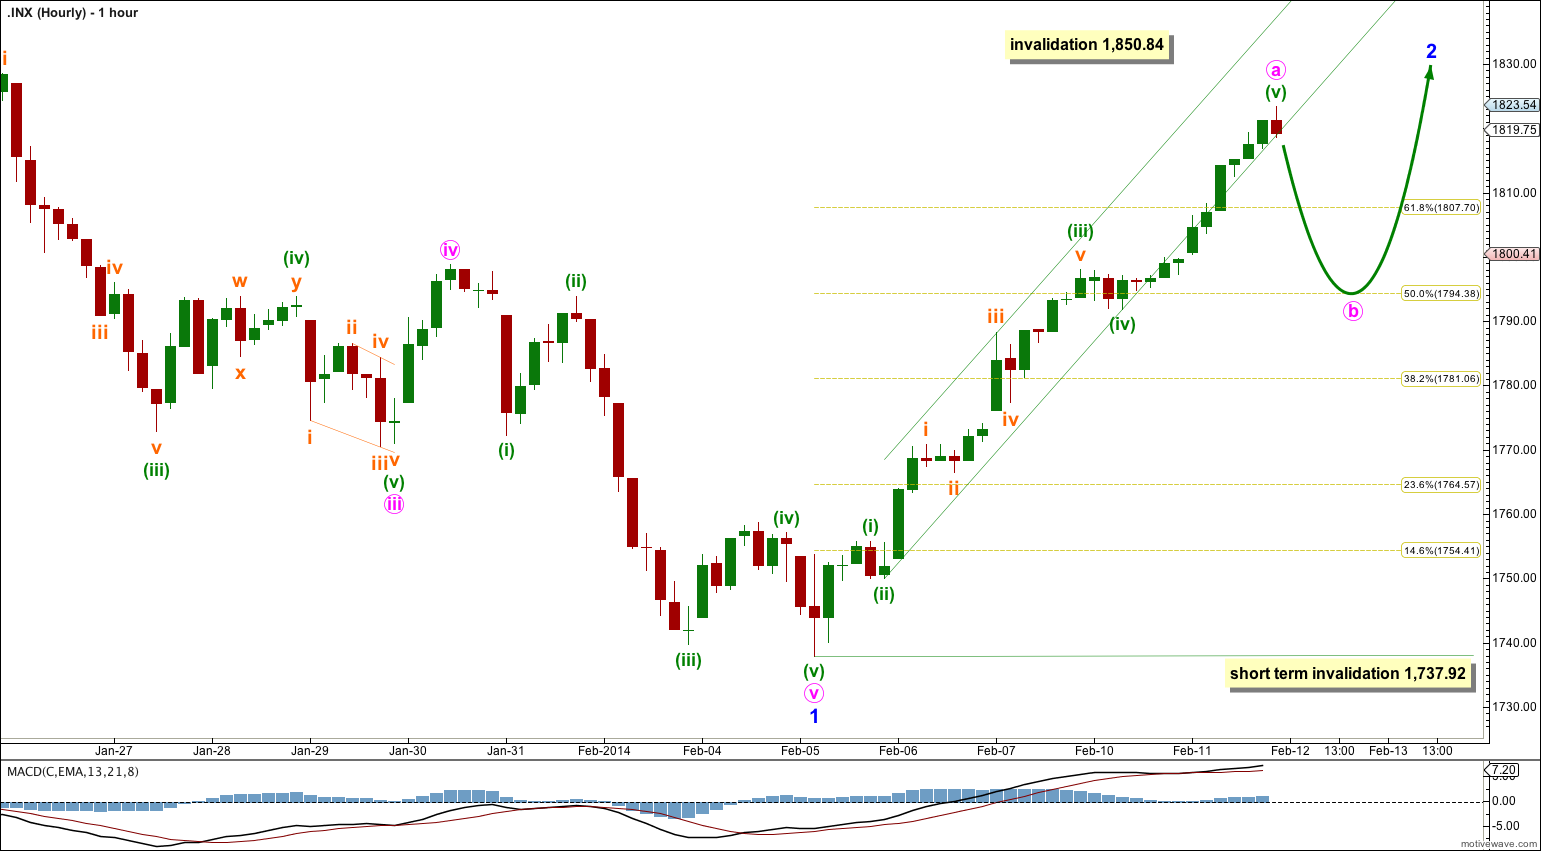
Within cycle wave c no second wave correction may move beyond the start of its first wave. This wave count is invalidated with any movement above 1,850.84.
Second waves can and often do correct to very deep degrees. When they do this they convince us there has been no trend change, and they do that right before a strong third wave takes off in the opposite direction.
There are several structural possibilities for a correction and so while price is within a correction the wave count may change, and flexibility is essential.
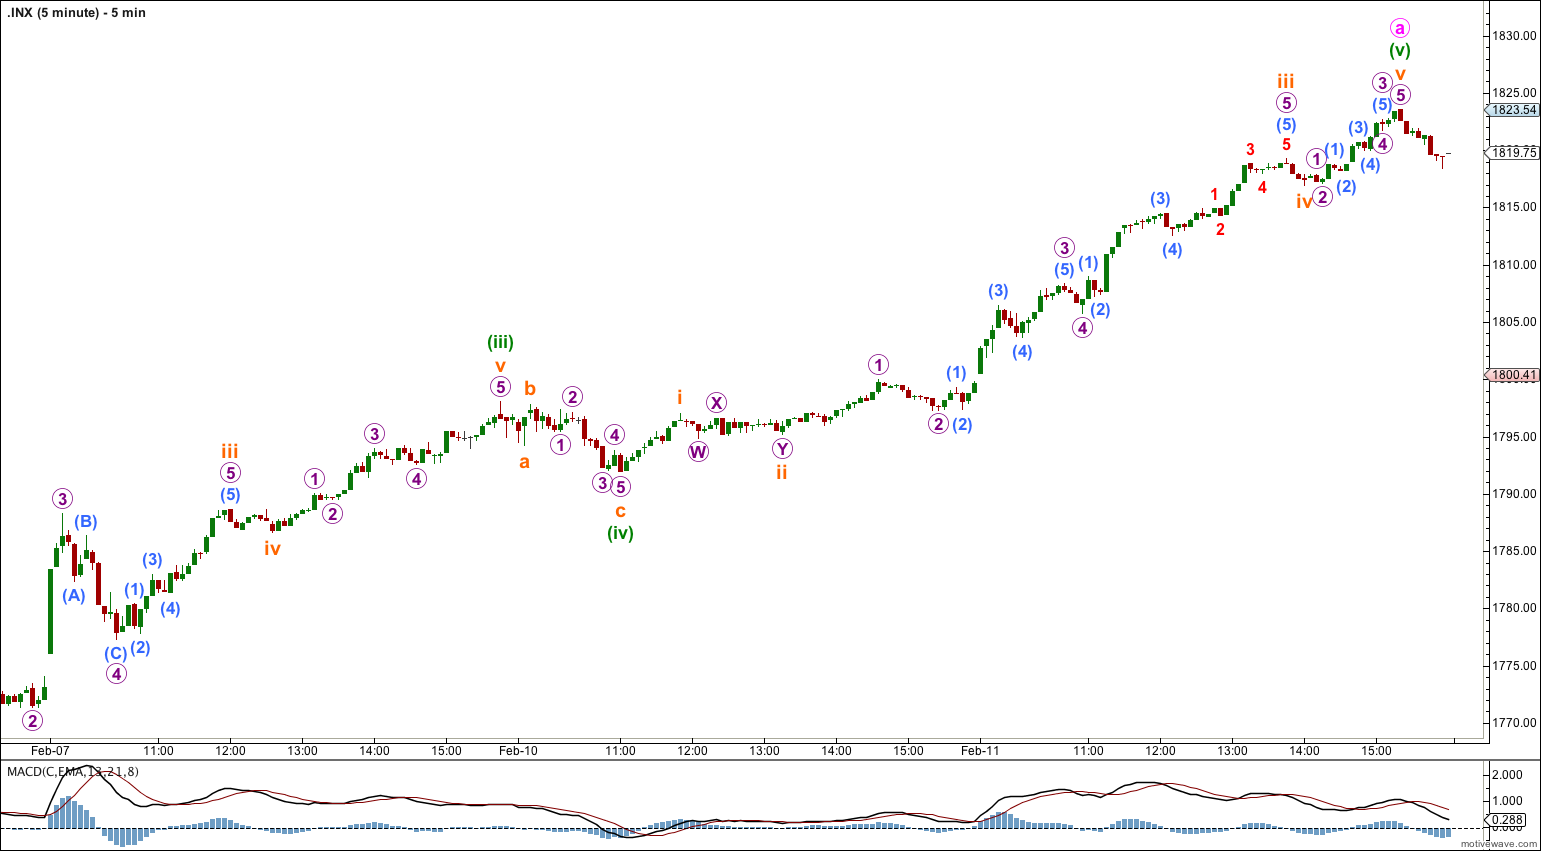
I have reanalysed the wave count, particularly the end of minor wave 1. The best fit at this stage sees minor wave 1 complete at the price low and minor wave 2 beginning from there. So far within minor wave 2 there is a five wave impulse upwards and so it cannot be over there, that can only be minute wave a.
Within minor wave 2 at some stage some downwards movement for minute wave b is required. It may take price back down to the 0.618 or 0.5 ratio. Minute wave b may not move beyond the start of minute wave a below 1,737.92.
I would expect minute wave b to show up on the daily chart as a red candlestick or red doji. Overall when minor wave 2 is complete then it should look like a clear three wave structure on the daily chart.
Minor wave 2 may not move beyond the start of minor wave 1. This wave count is invalidated with movement above 1,850.84.
Bullish Alternate Wave Count.
It is possible that a new cycle degree bull market began at 666.79. So far it is not yet halfway through, and I would expect it to last for a few years (at least five more years and probably longer).
At this stage this alternate bullish wave count does not diverge from the main bearish wave count, and it will not for a few to several weeks yet.
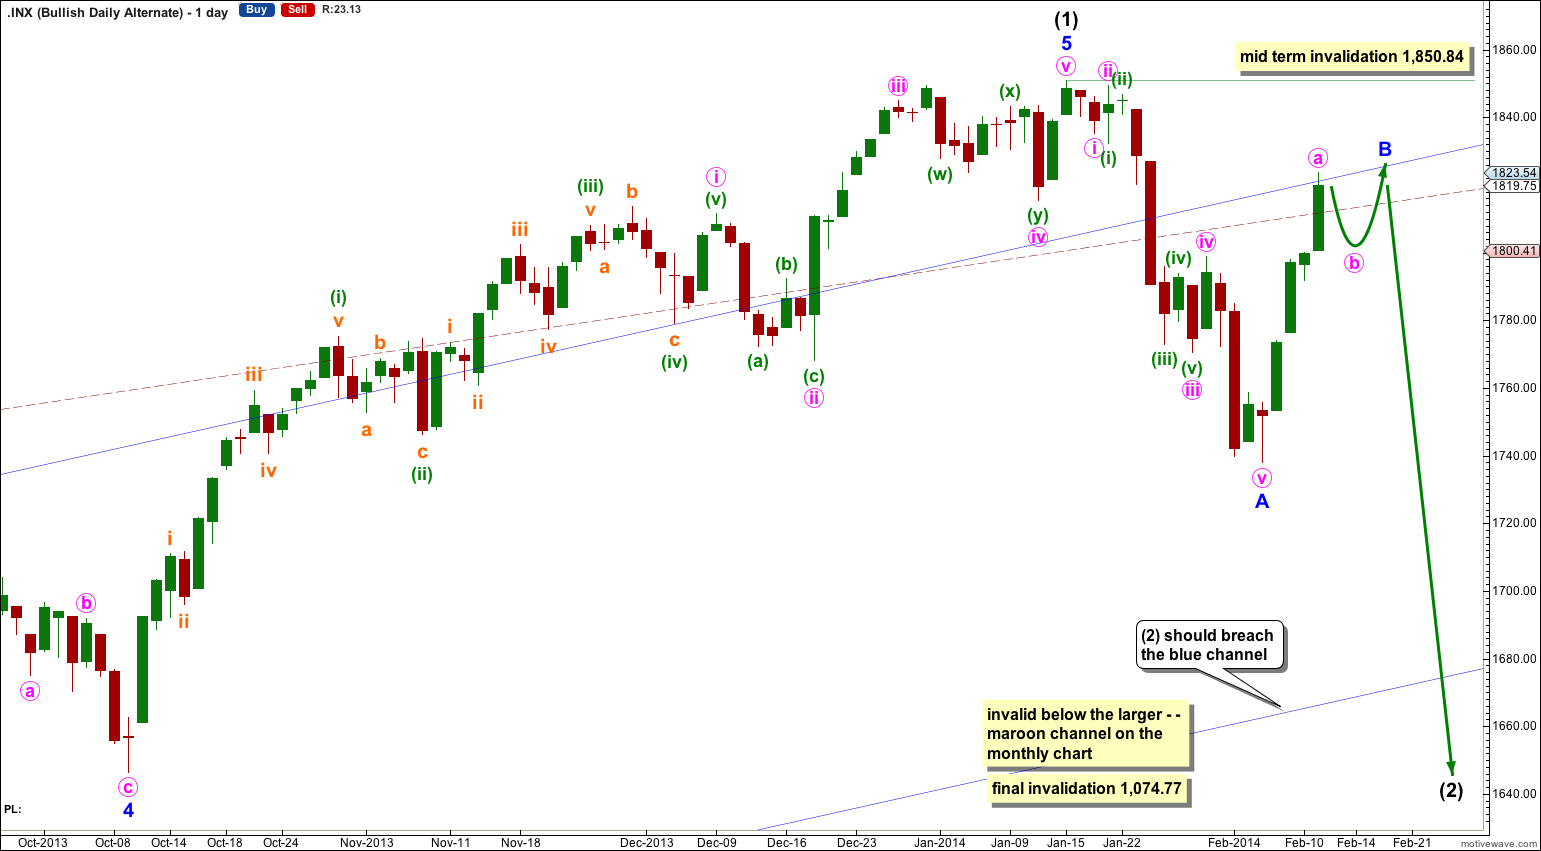
In the mid term this bullish wave count may have seen an intermediate degree trend change.
Intermediate wave (2) must subdivide as a three wave corrective structure. The first downwards movement within it must subdivide as a five and within it no second wave correction may move beyond the start of its first wave. This trend change is invalidated with any movement above 1,850.84.
Intermediate wave (2) downwards should last several weeks to a couple of months or so, and should breach the lower edge of the wide blue channel here on the daily chart.
Intermediate wave (2) should not breach support at the lower edge of the larger maroon – – – channel which is drawn the same way for both wave counts. For this alternate intermediate wave (2) should not breach the lower edge of the acceleration channel drawn about primary waves 1 and 2, one degree higher.
The Fibonacci retracement on the hourly chart is for minor wave 1, not for minute wave a within minor wave 2. This is because at this stage and until the structure is complete the trend is upwards.
The Fibonacci retracement on the hourly chart is for minor wave 1 not for minute wave a within minor wave 2. At this stage the trend is up, at minor degree.
Even if we get a pullback to the 1800-1790 level this week, and I hope we do. I certainly not expect wave c to stop at 1830, most likely well see 1845 or 1850, if not all time highs. Well see what happens.
If “a” started at 1737.92 and ended today at 1823.54, wouldn’t a 0.5 ratio bring “b” back to 1780.73 and not 1794.38 (as indicated on your hourly chart)?