
I expected overall upwards movement for a green candlestick for Thursday’s session which is what has happened.
The wave count remains the same.
Summary: If there has been no trend change at either intermediate or cycle degree then price should continue upwards above 1,839.89. If there has been a trend change then upwards movement may end tomorrow at 1,805. At any time a new low below 1,770.45 would indicate a trend change has occurred.
Click on the charts below to enlarge.
Main Bearish Wave Count.
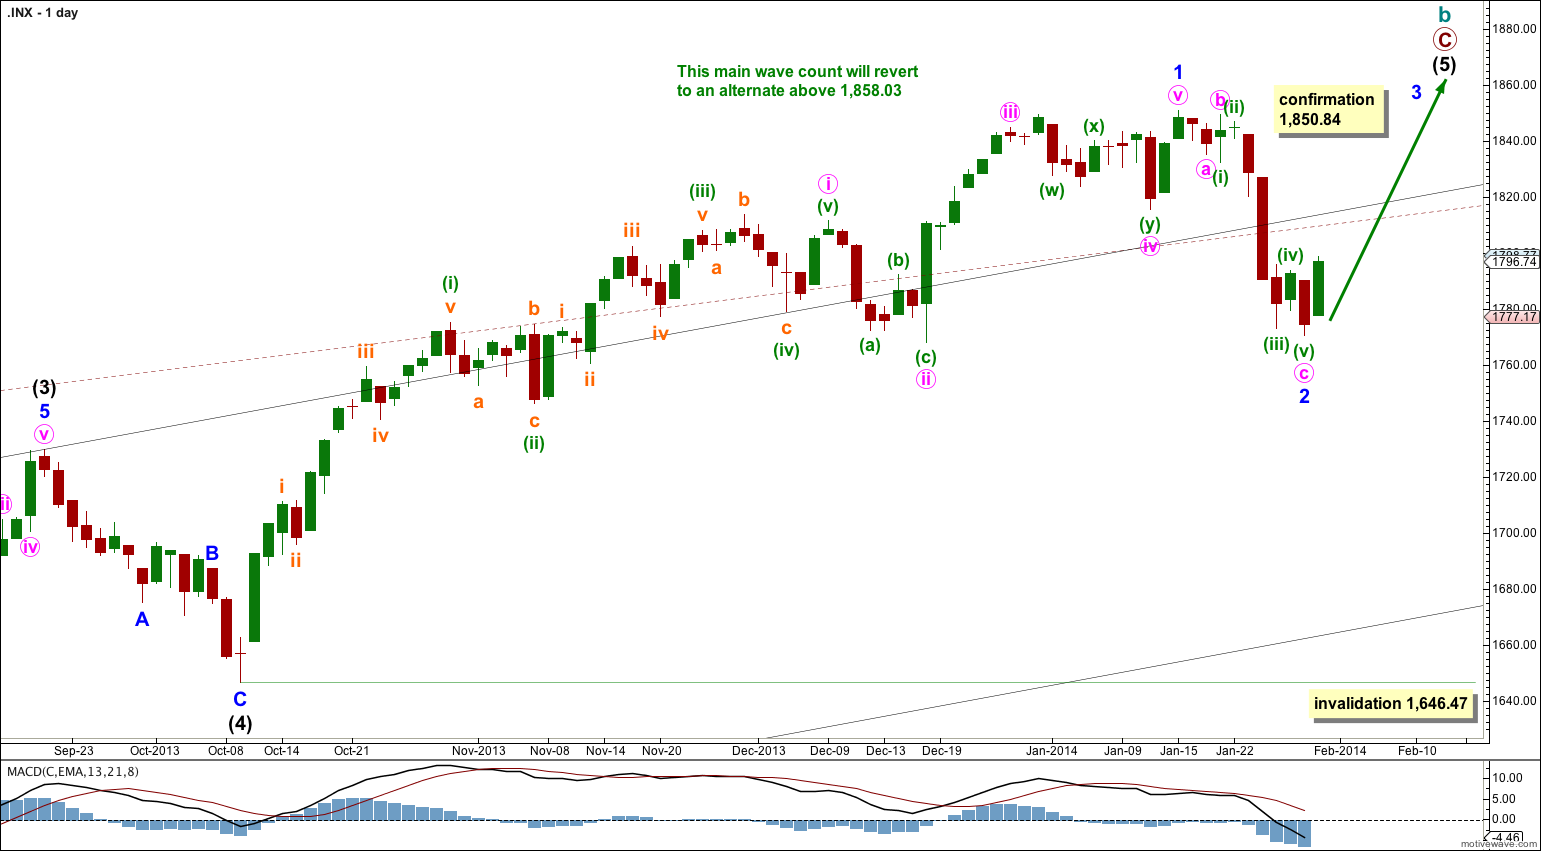
This wave count has a higher probability than the bullish alternate. Upwards movement over the last 4 years and 10 months subdivides best as a zigzag. If something is “off” about the supposed recovery then it must be a B wave because there is plenty that is off in this scenario in terms of social mood.
We should always assume that the trend remains the same until proven otherwise. While price remains above 1,646.47 we should assume the upwards trend is still in place.
Minor wave 2 may not move beyond the start of minor wave 1. This wave count is invalidated with movement below 1,646.47.
At super cycle degree the structure is an expanded flat correction. Within the flat the maximum common length of cycle wave b is 138% the length of cycle wave a, and this is achieved at 1,858.03. When cycle wave b is longer than the common length of cycle wave a then the probability that an expanded flat is unfolding would reduce and it would be more likely that a long term bull market is underway. Above 1,858.03 I will swap this main wave count over with the bullish alternate.
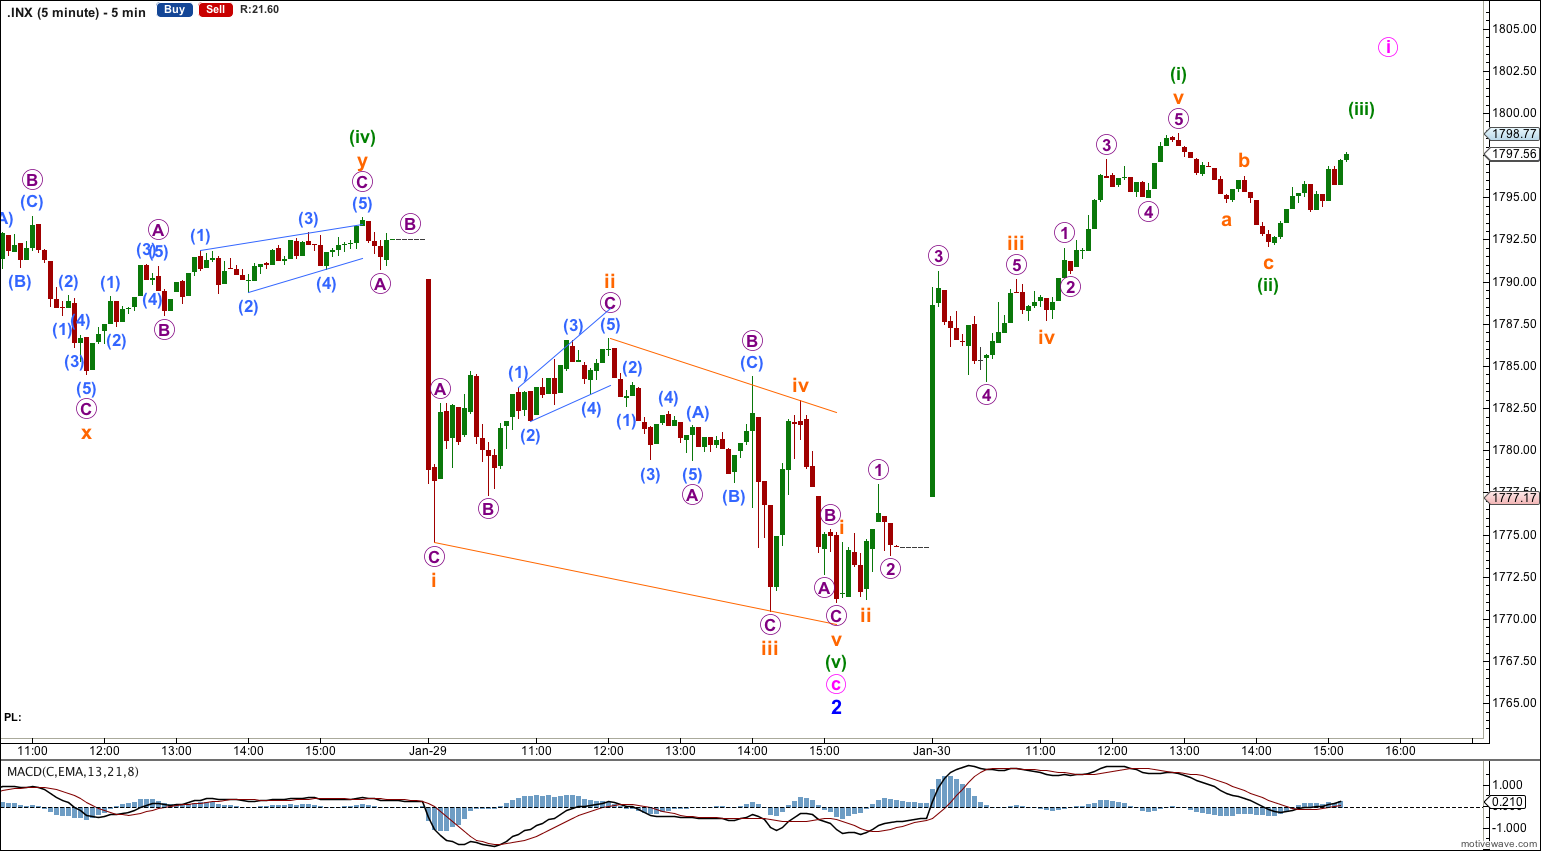
Minor wave 2 is now a completed zigzag. The final fifth wave is an ending contracting diagonal and may have a slightly truncated fifth wave within it.
Movement above 1,839.89 at this stage would invalidate the bearish alternate below and so confirm this wave count.
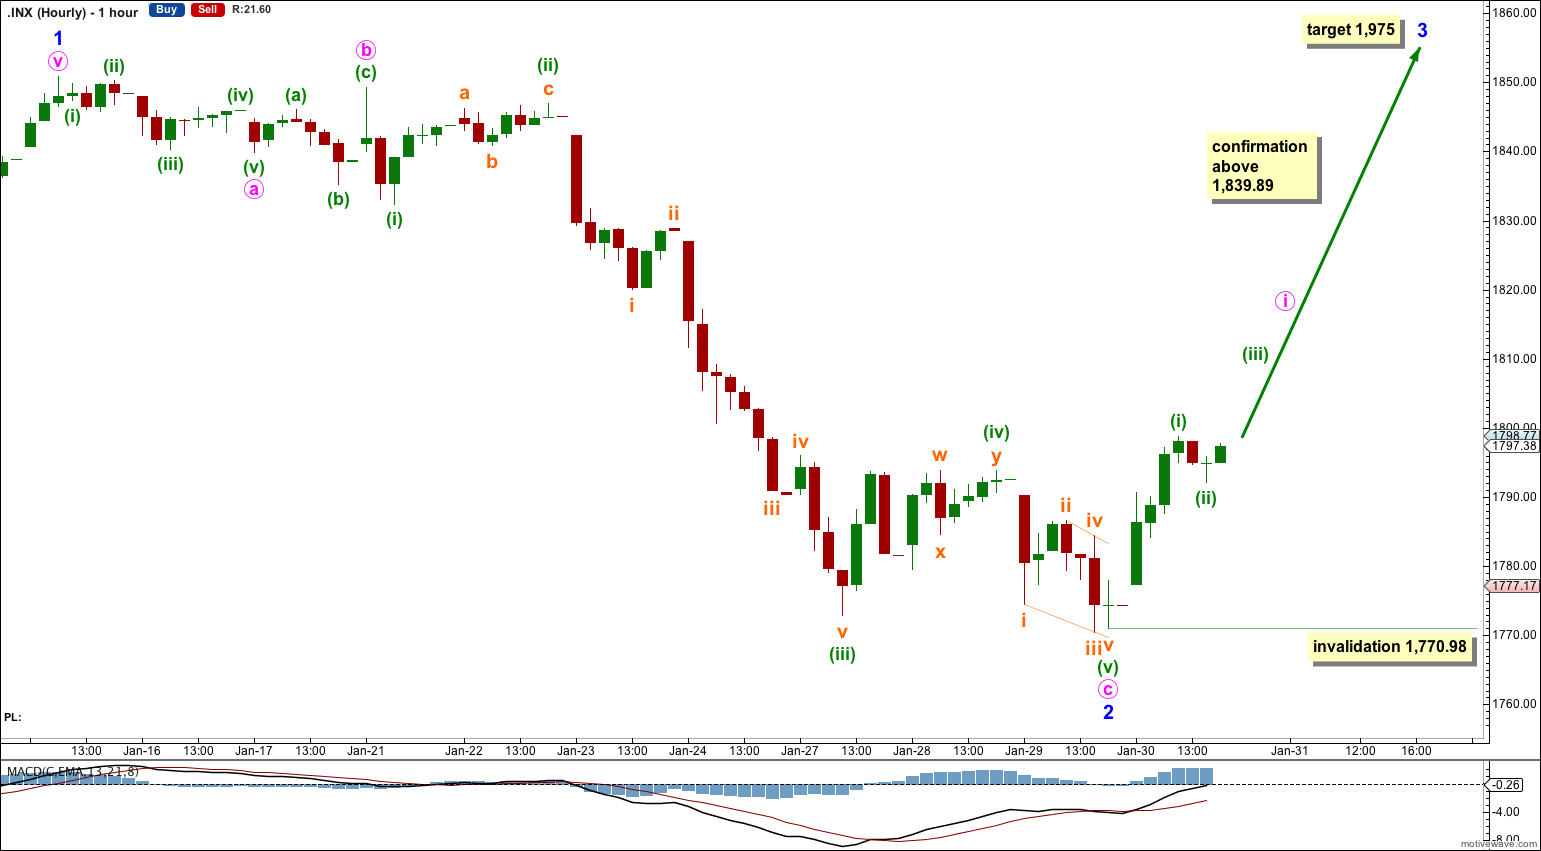
Minor wave 3 must move beyond the end of minor wave 1 above 1,850.84. At 1,975 minor wave 3 would reach equality in length with minor wave 1. I am using this ratio to calculate the target because minor wave 2 is a shallow 39% correction of minor wave 1.
Within minor wave 3 minuette wave (ii) may not move beyond the start of minuette wave (i). This wave count is invalidated with movement below 1,770.98.
Bearish Alternate Wave Count.
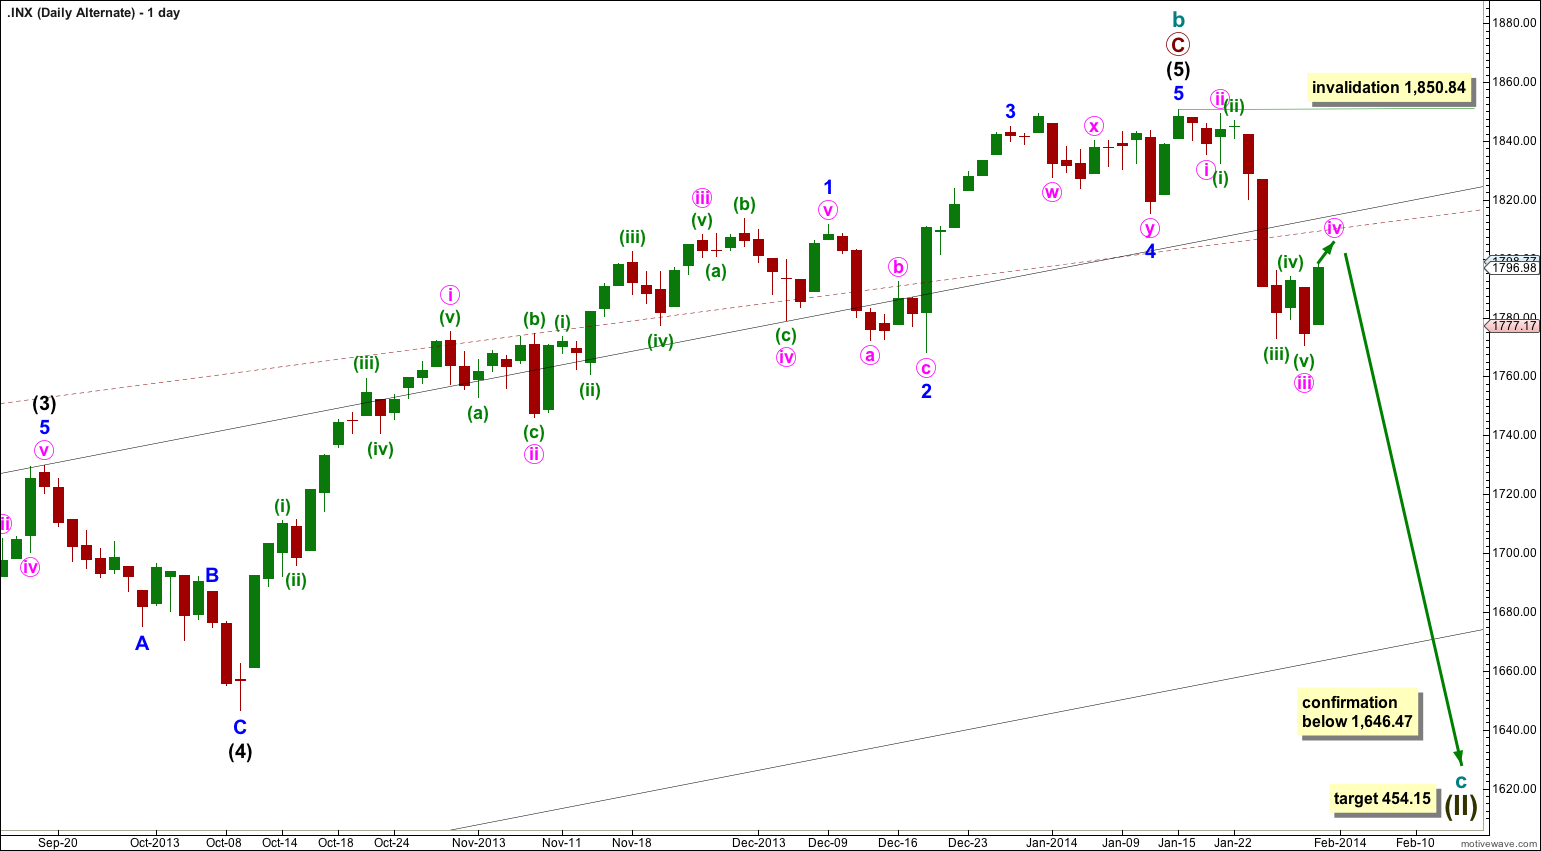
It is again possible that cycle wave b is over and that there has been a trend change at cycle degree (bearish wave count) or intermediate wave degree (bullish alternate below).
So far there is not a clear five down on the daily chart. Minute waves iv and v must complete for this to be clear. If a clear five down on the daily chart develops then this will be my main wave count.
Downwards movement must move below 1,530.09 because this super cycle wave (II) must move below the high of super cycle wave (I).
Cycle wave c should last between one to several years and should take price substantially below 666.79.
At 454.15 cycle wave c would reach 1.618 the length of cycle wave a. It should subdivide as a motive structure, most likely a simple impulse.
It is always wise to assume that the trend remains the same until proven otherwise. While price remains above 1,646.47 and / or there is no clear five down on the daily chart, then we should assume the trend remains up and this will be an alternate wave count.
There is now a clear breach of the upper edge of the black and maroon – – – channels. This increases the probability of an intermediate or cycle degree trend change.
Movement below 1,646.47 would confirm a trend change, at least at intermediate wave degree.
Within cycle wave c no second wave correction may move beyond the start of its first wave. This wave count is invalidated with any movement above 1,850.84.
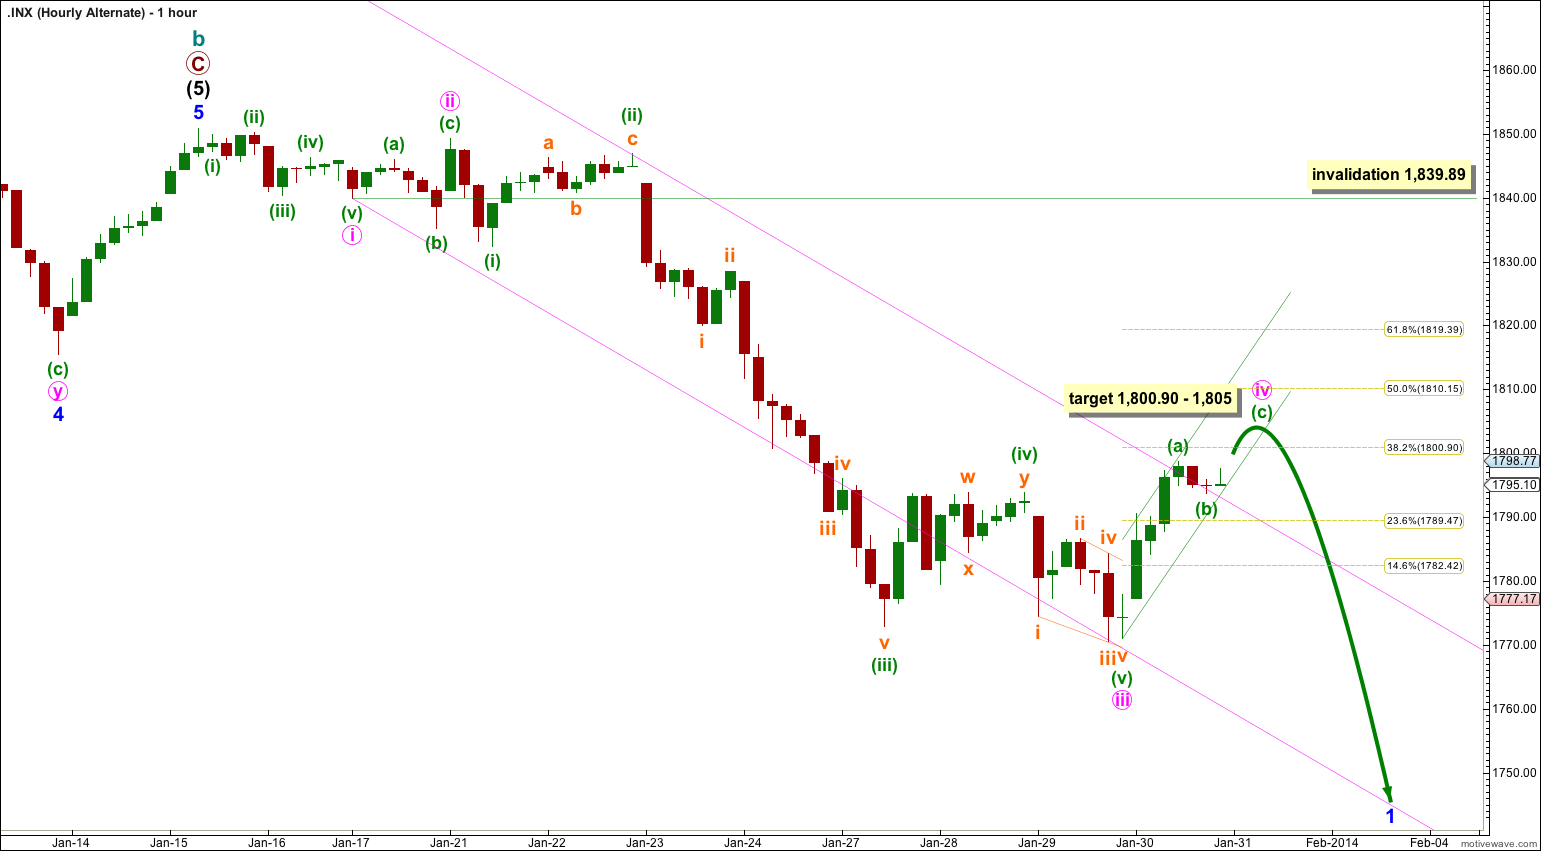
Minute wave iv would be likely to show structural alternation with minute wave ii which was a flat correction. Minute wave iv may be unfolding as a zigzag.
Minute wave iv would be likely to show alternation in depth of correction with minute wave ii which was a deep 86%. Minute wave iv may be likely to end about the 0.382 Fibonacci ratio at 1,800.90.
Within minute wave iv if minuette wave (b) is over and does not move any lower then at 1,805 minuette wave (c) would reach 0.382 the length of minuette wave (a).
I have drawn a small best fit channel about this small zigzag. I would expect minuette wave (c) to end within this channel. After some more upwards movement if the channel is breached by subsequent downwards movement that may be an indication that the correction of minute wave iv is over and minute wave v downwards has begun.
Minute wave ii lasted seven hours and shows on the daily chart as a green candlestick. So far minute wave iv has lasted seven hours also and shows on the daily chart as a green candlestick. I would expect it should most likely be over soon, within another one to very few hours, in order to be nicely in proportion to minute wave ii.
Minute wave iv may not move into minute wave i price territory. This wave count is invalidated with movement above 1,839.89.
Bullish Alternate Wave Count.
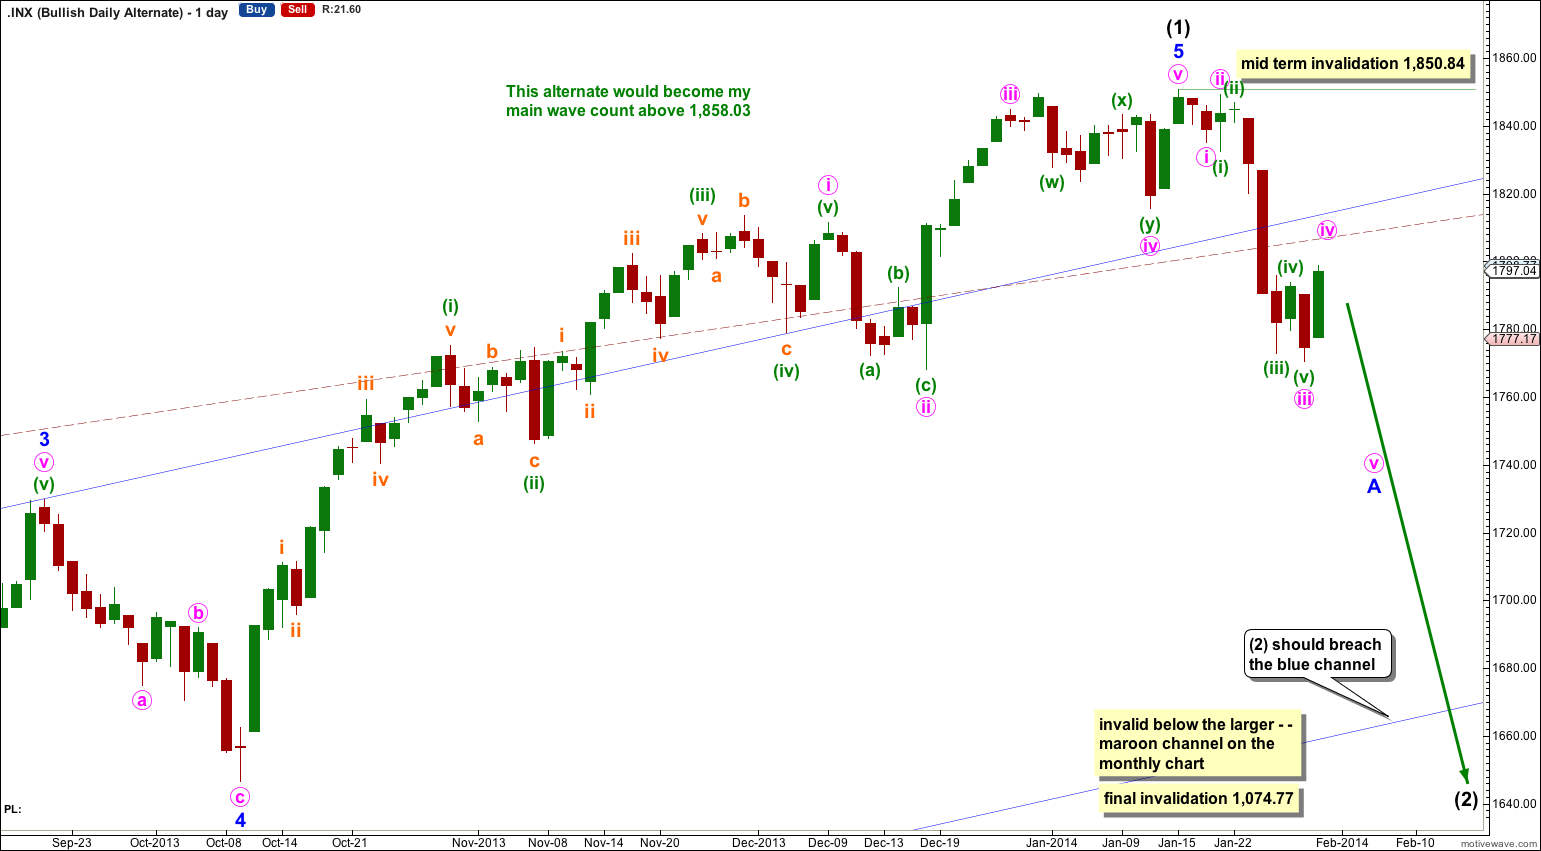
It is possible that a new cycle degree bull market began at 666.79. So far it is not yet halfway through, and I would expect it to last for a few years (at least five more years and probably longer).
In the mid term this bullish wave count may have seen an intermediate degree trend change. Intermediate wave (2) has most likely begun because price is now back in the wider blue and maroon – – – channels.
Intermediate wave (2) must subdivide as a three wave corrective structure. The first downwards movement within it must subdivide as a five and within it no second wave correction may move beyond the start of its first wave. This trend change is invalidated with any movement above 1,850.84.
Intermediate wave (2) downwards should last several weeks to a couple of months or so, and should breach the lower edge of the wide blue channel here on the daily chart.
Intermediate wave (2) should not breach support at the lower edge of the larger maroon – – – channel which is drawn the same way for both wave counts. For this alternate intermediate wave (2) should not breach the lower edge of the acceleration channel drawn about primary waves 1 and 2, one degree higher.
Market is not bulish anymore.
What do you think? Futures on new lows.
I think we have had a trend change.
But I also think this trend change is unconfirmed. It is wise to assume the trend remains the same, until proven otherwise. Several times over the last 4 years I have expected we have seen a big trend change and a new bear market. Each time I was wrong.
It is still possible there has been no trend change, that a bull market still prevails.