
Yesterday’s analysis expected choppy overlapping sideways movement for another day before the downwards trend resumed. This is not what happened, and the short term target for downwards movement at 1,803 was blitzed by strong downwards movement. The bearish alternate is looking more possible today.
The wave count remains the same.
Summary: Downwards movement should continue because this structure is incomplete.
Click on the charts below to enlarge.
Main Bearish Wave Count.
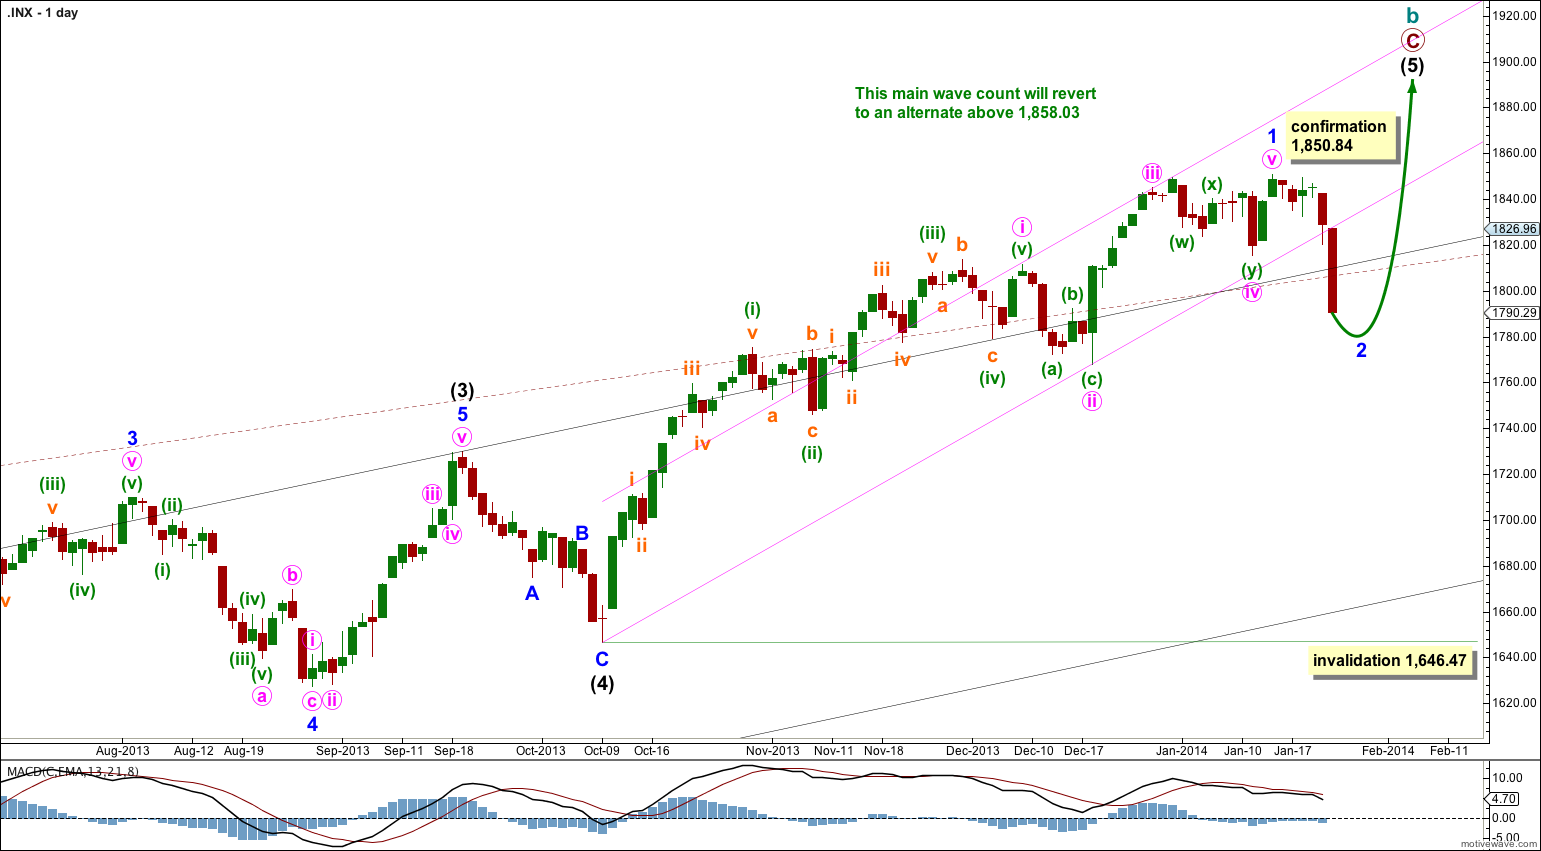
This wave count has a higher probability than the bullish alternate. Upwards movement over the last 4 years and 10 months subdivides best as a zigzag. If something is “off” about the supposed recovery then it must be a B wave because there is plenty that is off in this scenario in terms of social mood.
We should always assume that the trend remains the same until proven otherwise. While price remains above 1,646.47 we should assume the upwards trend is still in place.
The pink channel is drawn about minor wave 1 using Elliott’s first technique: draw the first trend line from the highs of minute waves i to iii, then place a parallel copy upon the low of minute wave ii. I would expect minor wave 2 to breach this channel. Minor wave 2 may find support about the upper edges of the black and maroon – – – channels which are copied over from the monthly chart.
Minor wave 2 may not move beyond the start of minor wave 1. This wave count is invalidated with movement below 1,646.47.
At super cycle degree the structure is an expanded flat correction. Within the flat the maximum common length of cycle wave b is 138% the length of cycle wave a, and this is achieved at 1,858.03. When cycle wave b is longer than the common length of cycle wave a then the probability that an expanded flat is unfolding would reduce and it would be more likely that a long term bull market is underway. Above 1,858.03 I will swap this main wave count over with the bullish alternate.
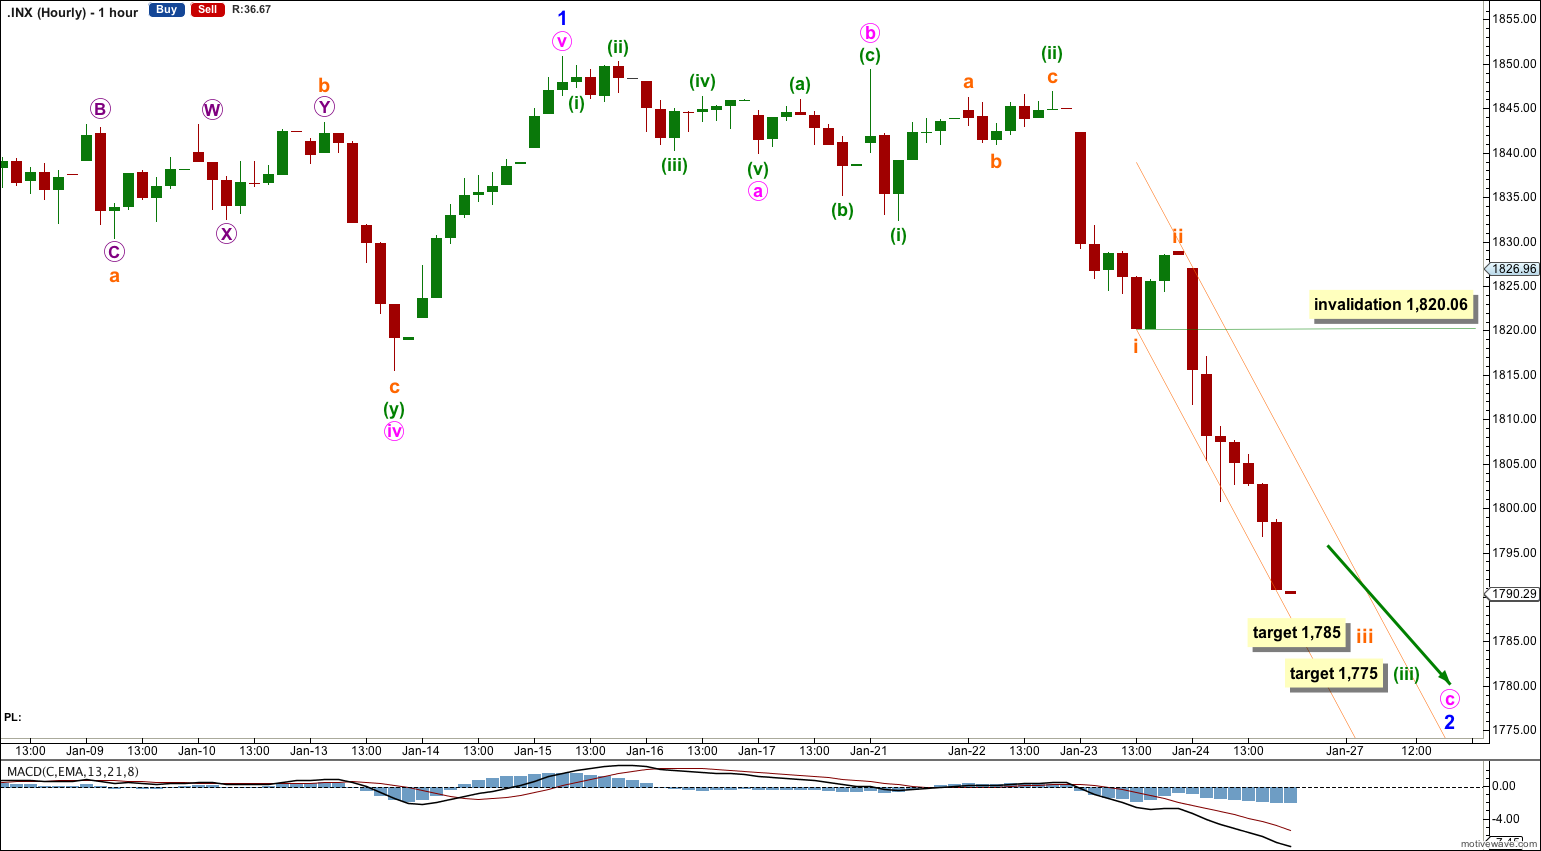
This strong downwards movement shows an increase in momentum and so the third wave was not over. I have adjusted the labeling within minor wave 2: minute waves a and b may be over and minute wave c may be extending.
Minute wave c has passed 1.618, 2.618 and now also 4.236 the length of minute wave a. It may not exhibit a Fibonacci ratio to minute wave a.
Within minute wave c minuette wave (iii) has passed 1.618 and 2.618 the length of minuette wave (i). At 1,775 minuette wave (iii) would reach 4.236 the length of minuette wave (i).
Within minuette wave (iii) subminuette wave iii would reach 1.618 the length of subminuette wave i at 1,785.
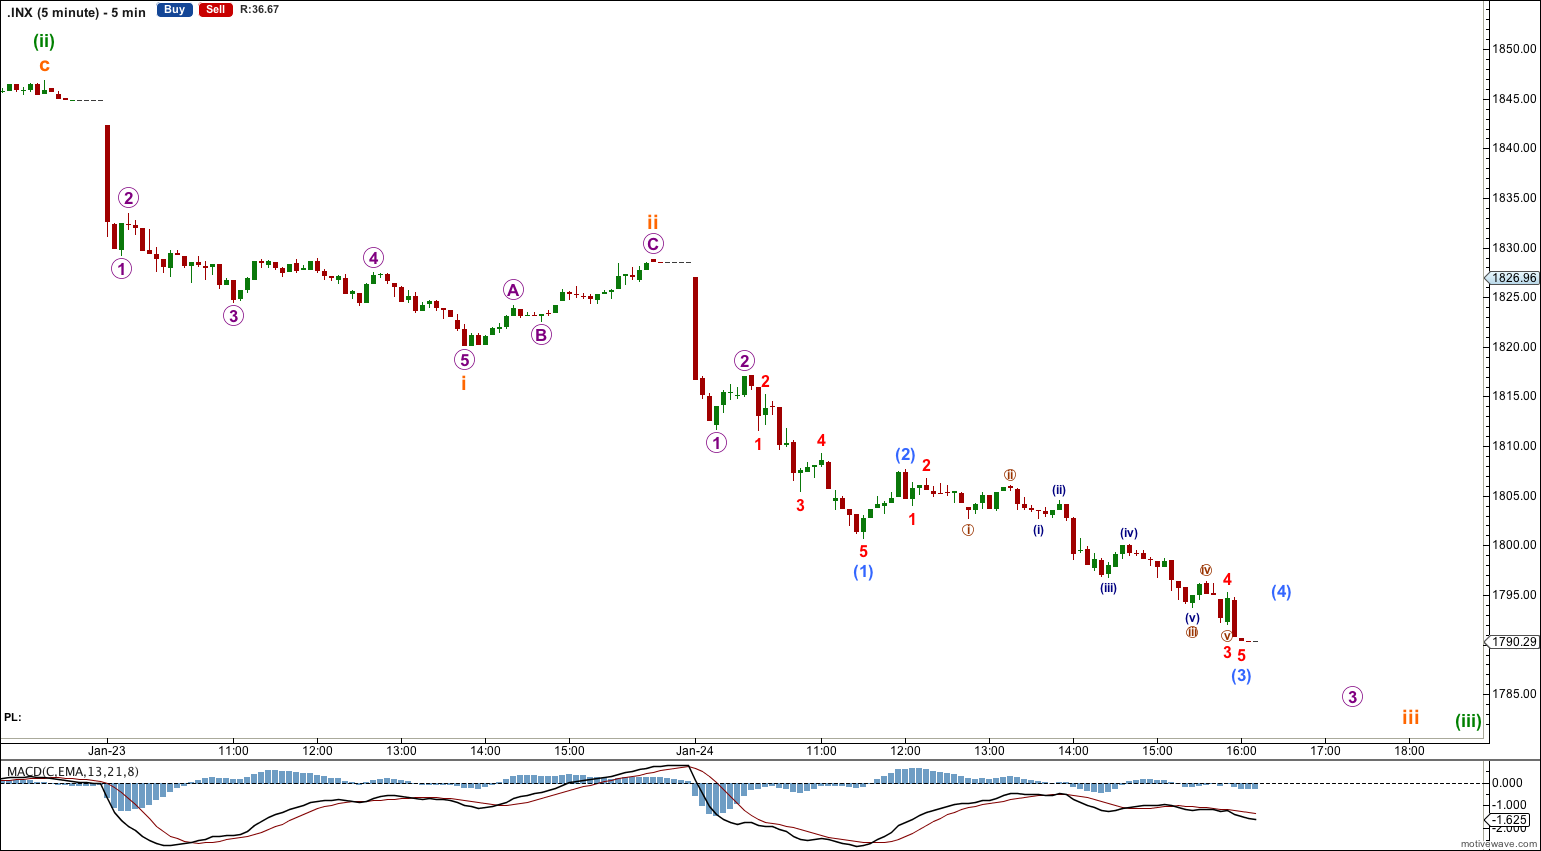
When subminuette wave iii is completed then I would expect subminuette wave iv to be over well within one session, within a very few hours. Subminuette wave iv may not move into the price territory of subminuette wave i. This wave count is invalidated with movement above 1,820.06.
I have drawn a channel about this third wave, and it will need to be redrawn as price continues lower. Draw the first trend line from the low labeled subminuette wave i to where ever subminuette wave iii ends, then place a parallel copy upon the high of subminuette wave ii. I would expect the small correction for subminuette wave iv to be likely to remain within this channel, and the following downwards wave of subminuette wave v may end at the lower edge. When minuette wave (iii) is complete then minuette wave (iv) should breach this channel.
Bearish Alternate Wave Count.
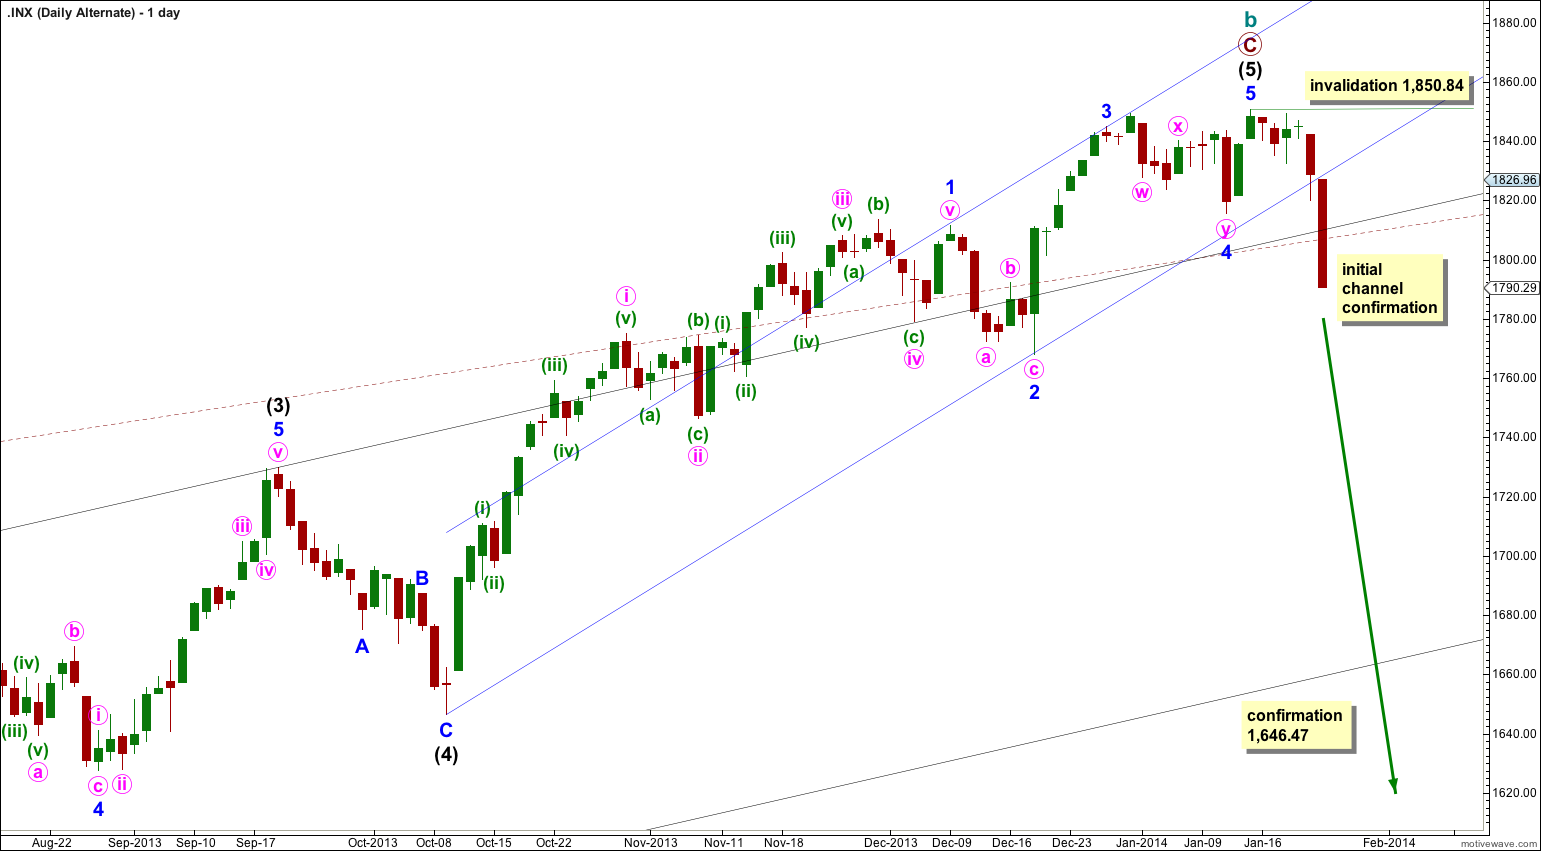
It is again possible that cycle wave b is over (and the same idea applies for the bullish wave count below as it is possible that intermediate wave (1) is over). Friday’s strong downwards candlestick would certainly fit nicely with this wave count.
It is possible that we have just seen a big trend change. For this bearish wave count the new downwards trend is at cycle degree. It should last between one to several years and should take price substantially below 666.79. It should subdivide as a motive structure, most likely a simple impulse.
It is always wise to assume that the trend remains the same until proven otherwise. While price remains above 1,646.47 we should assume the trend remains up and this will be an alternate wave count.
If downwards movement breaches support at the black and maroon – – – channels then this wave count would increase in probability. If we see a clear five wave structure downwards on the daily chart this would become my main wave count. Movement below 1,646.47 would confirm a trend change, at least at intermediate wave degree.
Within cycle wave c no second wave correction may move beyond the start of its first wave. This wave count is invalidated with any movement above 1,850.84.
Bullish Alternate Wave Count.
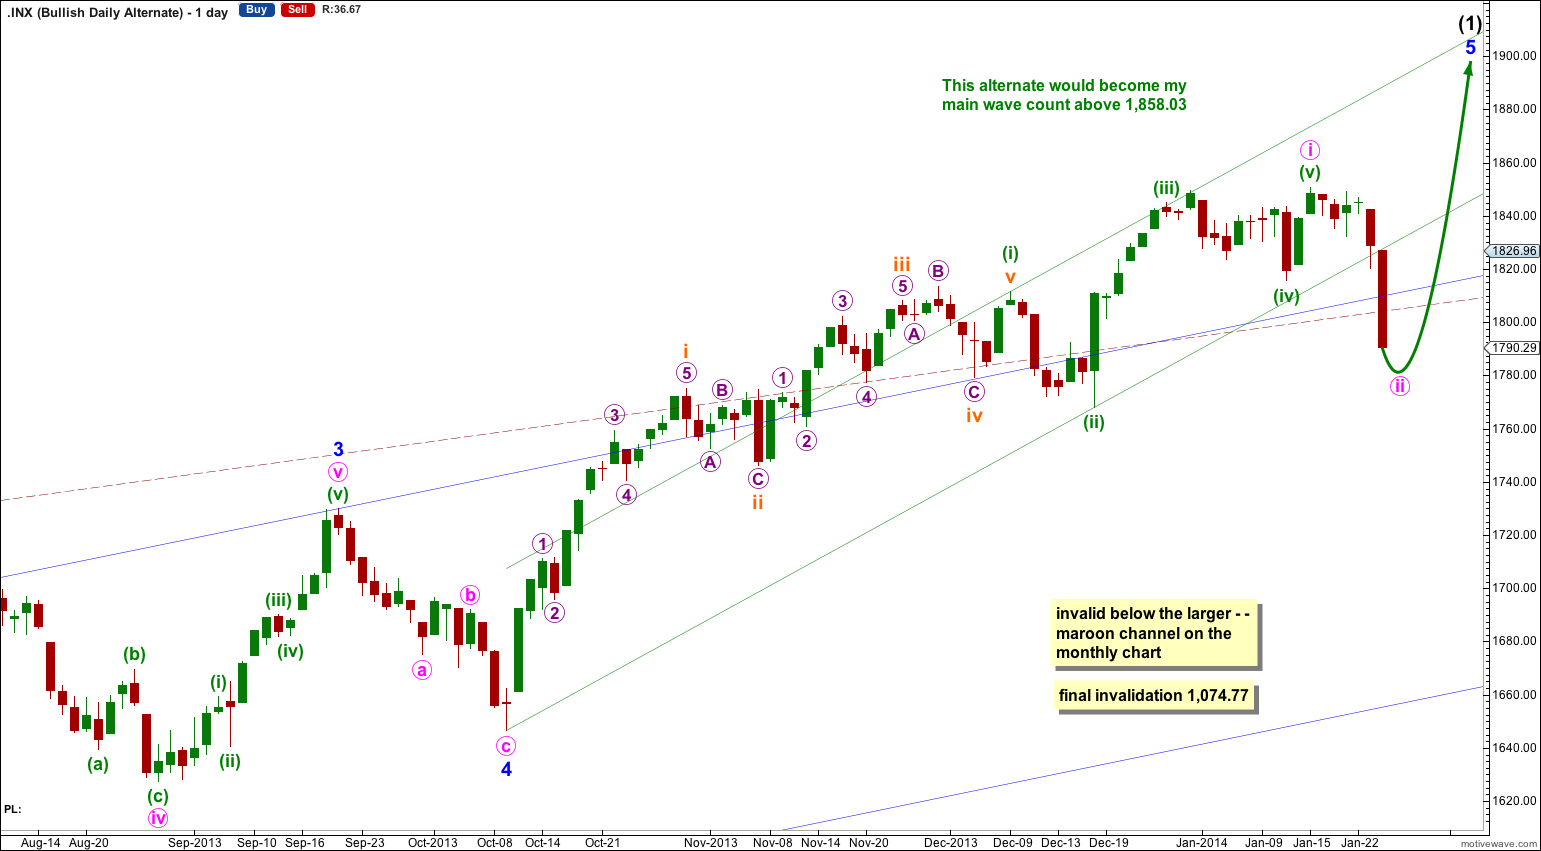
It is possible that a new cycle degree bull market began at 666.79. So far it is not yet halfway through, and I would expect it to last for a few years (at least five more years and probably longer).
The current upwards impulse, labeled intermediate wave (5) for the main wave count and minor wave 5 for this alternate may be incomplete. The structure within the final fifth wave is the same, and the structure on the hourly chart is the same. Targets would be the same for this bullish wave count. This wave count does not diverge with the main wave count, and it will not for several weeks or a couple of months or so yet.
When intermediate wave (1) is completed then this alternate also expects a trend change. Intermediate wave (2) downwards should last several weeks to a couple of months or so, and should breach the lower edge of the wide blue channel here on the daily chart. It must subdivide as a corrective structure, most likely a zigzag.
Intermediate wave (2) should not breach support at the lower edge of the larger maroon – – – channel which is drawn the same way for both wave counts. For this alternate intermediate wave (2) should not breach the lower edge of the acceleration channel drawn about primary waves 1 and 2, one degree higher.
Ok.
Thanks for that.
Bullish as usual.
within a combination (or multiple) there can only be a maximum of three simple corrective structures
within a multiple subwaves W, Y and Z (if there is one) can themselves only ever subdivide into simple A-B-C corrections, they cannot subdivide into W-X-Y
I think that this is the most common EW mistake that I see online
Again i’m asking if you could post main wave count from 2011 decline. 🙂