
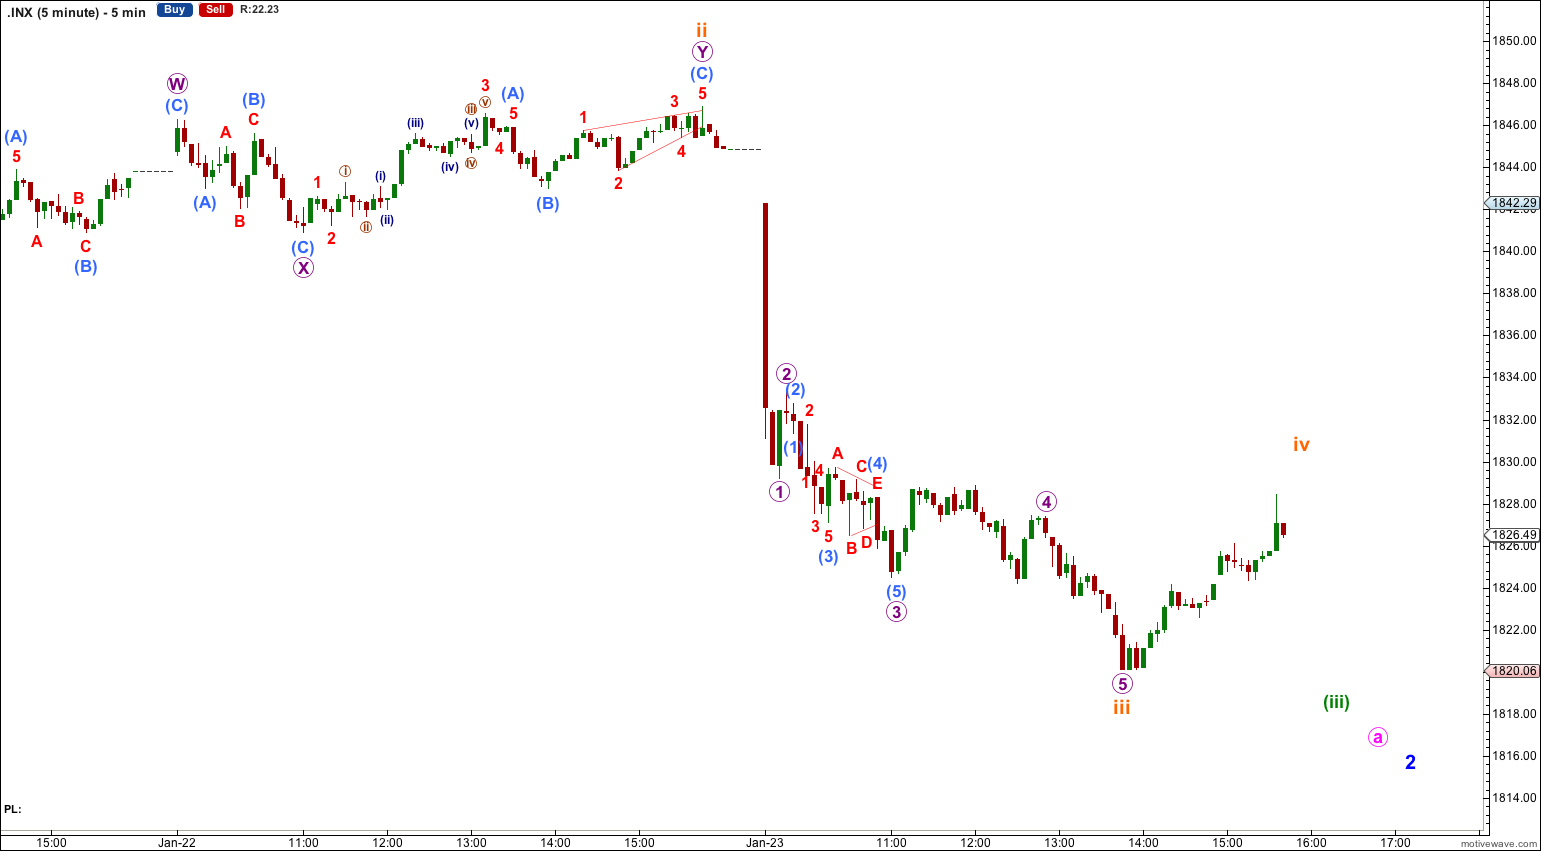
I had expected Thursday’s session to see downwards movement towards a short term target at 1,821, with an increase in downwards momentum. This is what happened as price has reached 1,820.06.
The wave count remains the same.
Summary: The middle of a third wave has just passed. The fourth wave should last about 11 hours, be choppy and overlapping, and not move above 1,832.38. Use the channel on the hourly chart as a guide to where it may end.
Click on the charts below to enlarge.
Main Bearish Wave Count.
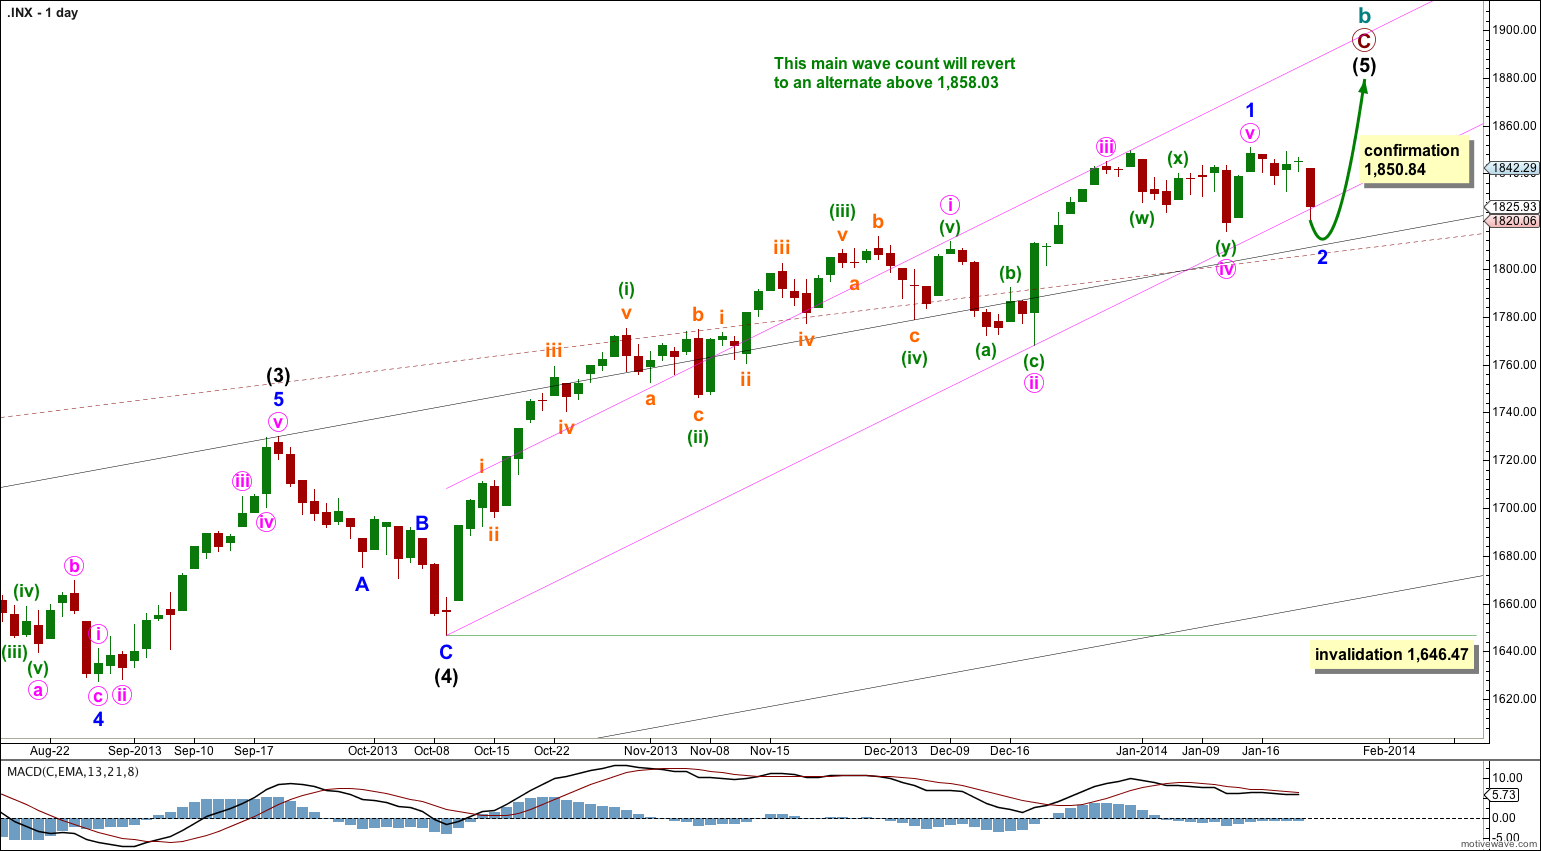
This wave count has a higher probability than the bullish alternate. Upwards movement over the last 4 years and 10 months subdivides best as a zigzag. If something is “off” about the supposed recovery then it must be a B wave because there is plenty that is off in this scenario in terms of social mood.
We should always assume that the trend remains the same until proven otherwise. While price remains above 1,646.47 we should assume the upwards trend is still in place.
The pink channel is drawn about minor wave 1 using Elliott’s first technique: draw the first trend line from the highs of minute waves i to iii, then place a parallel copy upon the low of minute wave ii. I would expect minor wave 2 to breach this channel. Minor wave 2 may find support about the upper edges of the black and maroon – – – channels which are copied over from the monthly chart.
Minor wave 2 may not move beyond the start of minor wave 1. This wave count is invalidated with movement below 1,646.47.
At super cycle degree the structure is an expanded flat correction. Within the flat the maximum common length of cycle wave b is 138% the length of cycle wave a, and this is achieved at 1,858.03. When cycle wave b is longer than the common length of cycle wave a then the probability that an expanded flat is unfolding would reduce and it would be more likely that a long term bull market is underway. Above 1,858.03 I will swap this main wave count over with the bullish alternate.
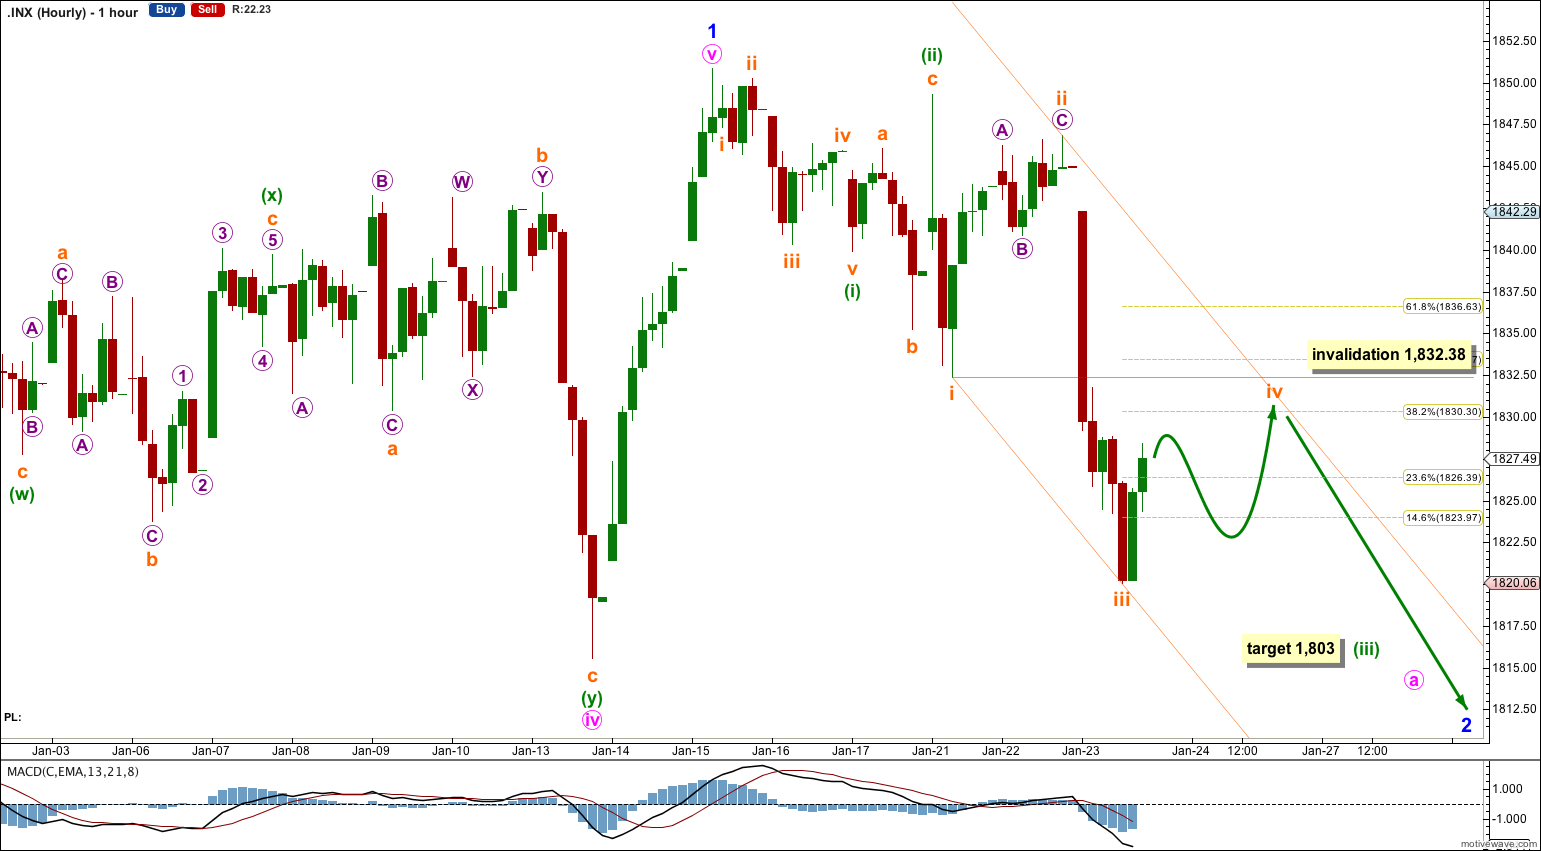
Subminuette wave ii finally ended at the end of Wednesday’s session and subminuette wave iii downwards shows a clear increase in downwards momentum. Subminuette wave iii is 0.58 longer than 1.618 the length of subminuette wave i.
Subminuette wave ii was a deep zigzag lasting 11 hours. I would expect subminuette wave iv to be a shallow sideways moving correction and to last about 11 hours. Subminuette wave iv may not move into subminuette wave i price territory. This wave count is invalidated with movement above 1,832.38.
I have drawn a channel about this third wave using Elliott’s first technique. Draw the first trend line from the lows labeled subminuette waves i to iii, then place a parallel copy upon the high labeled subminuette wave ii. I would expect subminuette wave iv to find resistance at the upper edge of this channel, and the following downwards wave of subminuette wave v to end either midway within the channel or to find support at the lower edge.
Subminuette wave iv may reach the 0.382 Fibonacci ratio of subminuette wave iii at 1,830.30.
Minuette wave (iii) has now passed 1.618 and 2.618 the length of minuette wave (i). The next Fibonacci ratio in the sequence is 4.236 which would be reached at 1,803.
Bearish Alternate Wave Count.
It is again possible that cycle wave b is over (and the same idea applies for the bullish wave count below as it is possible that intermediate wave (1) is over).
It is possible that we have just seen a big trend change. For this bearish wave count the new downwards trend is at cycle degree. It should last between one to several years and should take price substantially below 666.79. It should subdivide as a motive structure, most likely a simple impulse.
It is always wise to assume that the trend remains the same until proven otherwise. While price remains above 1,646.47 we should assume the trend remains up and this will be an alternate wave count.
If downwards movement breaches support at the black and maroon – – – channels then this wave count would increase in probability. If we see a clear five wave structure downwards on the daily chart this would become my main wave count. Movement below 1,646.47 would confirm a trend change, at least at intermediate wave degree.
Within cycle wave c no second wave correction may move beyond the start of its first wave. This wave count is invalidated with any movement above 1,850.84.
Bullish Alternate Wave Count.
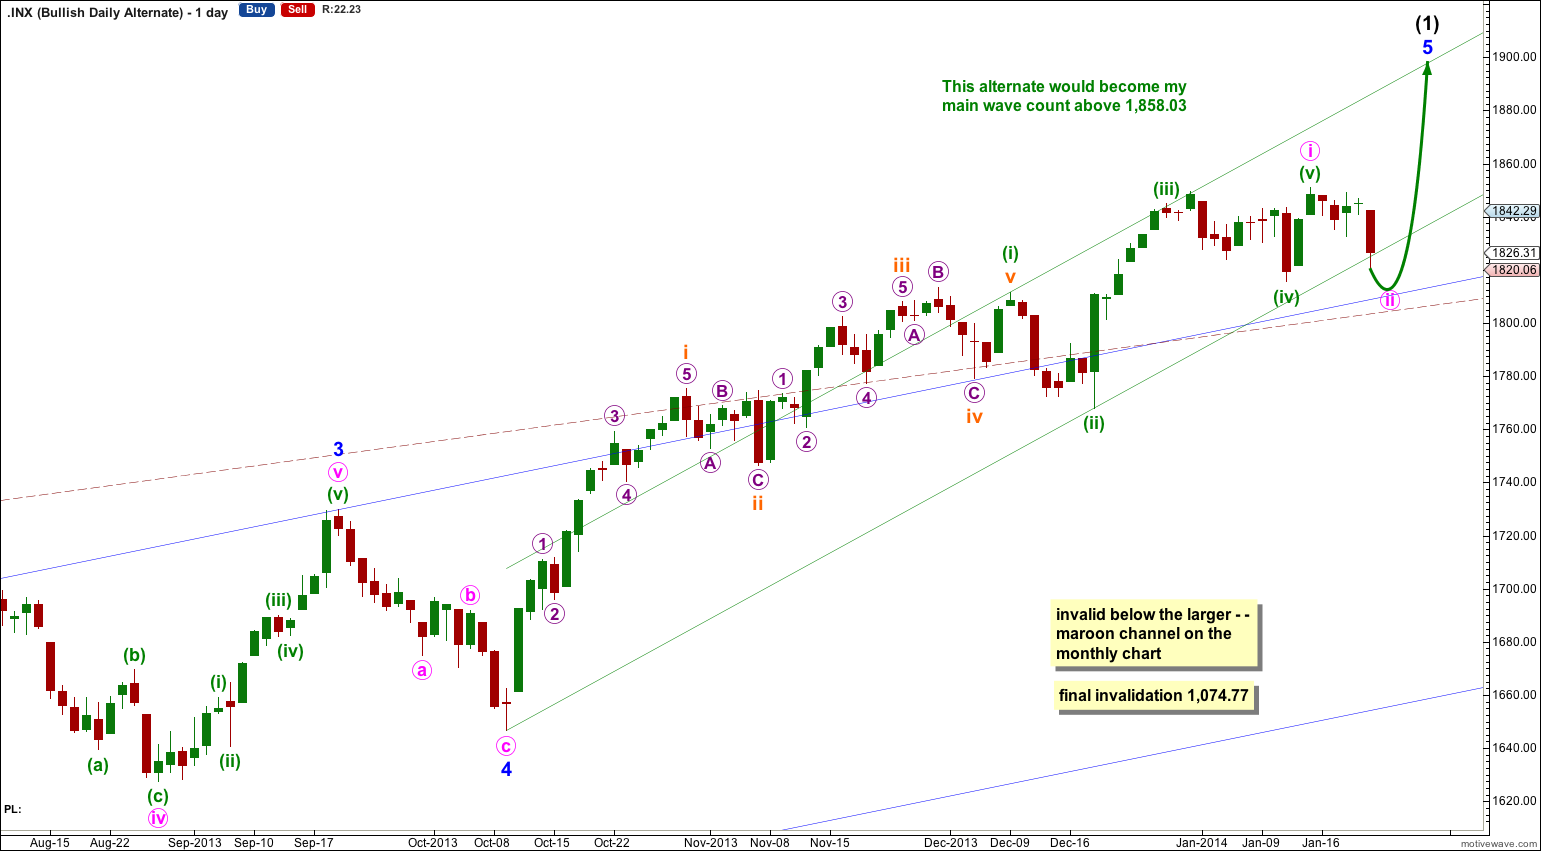
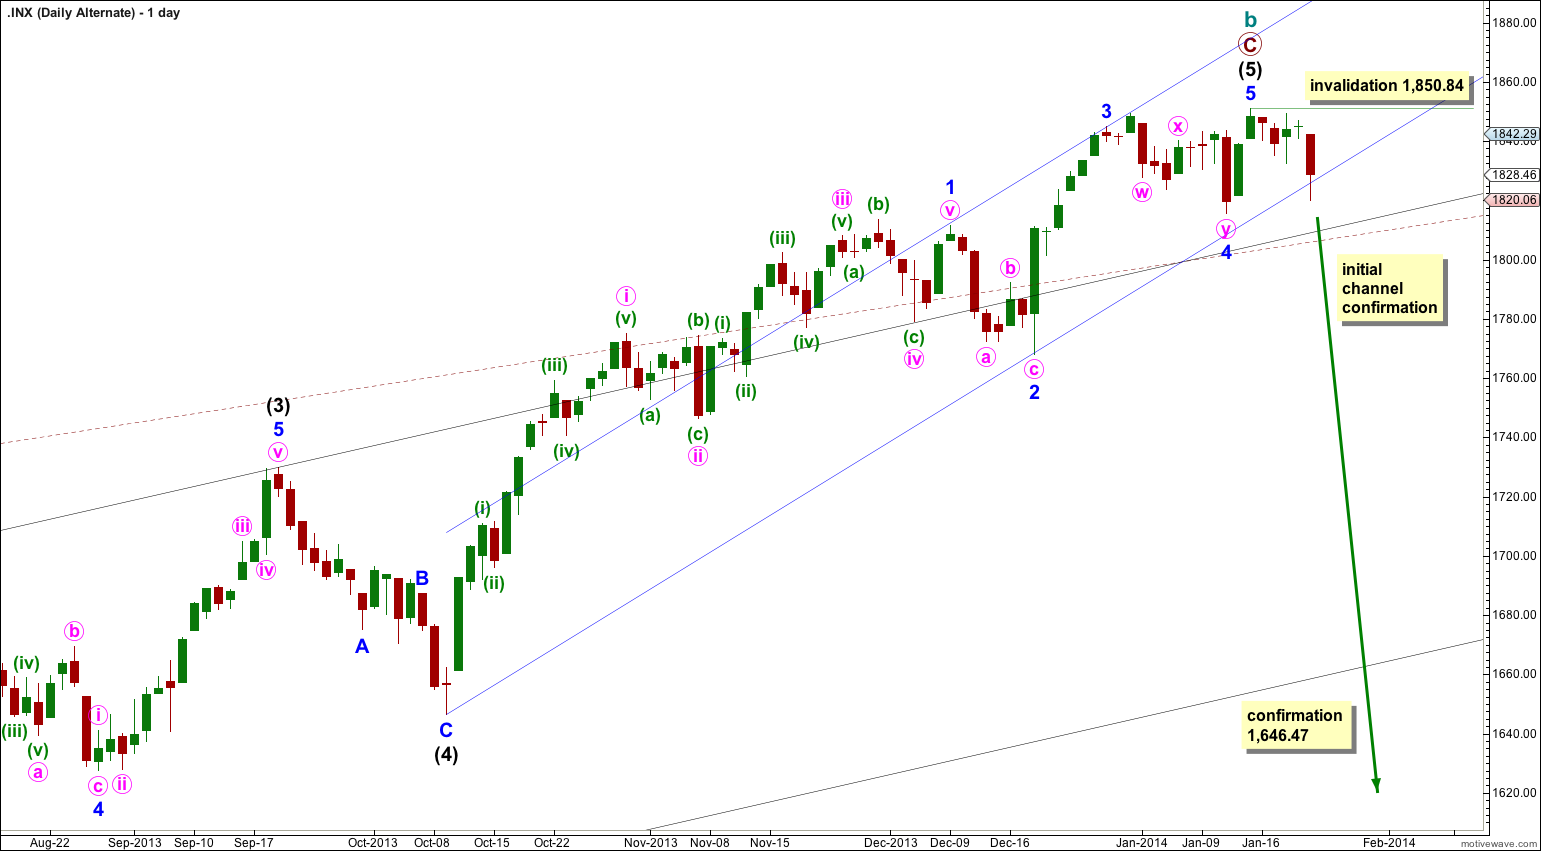
It is possible that a new cycle degree bull market began at 666.79. So far it is not yet halfway through, and I would expect it to last for a few years (at least five more years and probably longer).
The current upwards impulse, labeled intermediate wave (5) for the main wave count and minor wave 5 for this alternate may be incomplete. The structure within the final fifth wave is the same, and the structure on the hourly chart is the same. Targets would be the same for this bullish wave count. This wave count does not diverge with the main wave count, and it will not for several weeks or a couple of months or so yet.
When intermediate wave (1) is completed then this alternate also expects a trend change. Intermediate wave (2) downwards should last several weeks to a couple of months or so, and should breach the lower edge of the wide blue channel here on the daily chart. It must subdivide as a corrective structure, most likely a zigzag.
Intermediate wave (2) should not breach support at the lower edge of the larger maroon – – – channel which is drawn the same way for both wave counts. For this alternate intermediate wave (2) should not breach the lower edge of the acceleration channel drawn about primary waves 1 and 2, one degree higher.
H&S … neckline 1767.99?? // TARGET 1687.18
Lara could you post your full count from 2009 or 2011? Im very interested the count from 2011 decline.
it’s in the historical analysis section
http://elliottwavestockmarket.com/category/indicies/spx500-historical-analysis/
the link was in your welcome email, along with some other useful info and answers to common questions of new members.
Yep, i know. I just ask you if it is possible too see only count from october 2011. Im intrested in inside count what was exactly for you 4th wave etc. As for example Nate is doing.
1.bp.blogspot.com/-opqDMhT9Q_s/UuBzE9i83oI/AAAAAAAAIVA/NiLTKRjr4jI/s1600/20140122c.png
Could you post the same image of the market?
Something like here
elliottwavestockmarket.com/2013/10/08/sp-500-elliott-wave-technical-analysis-7th-october-2013/
But updated.
Or maybe i dont know how to find it.
If you have time ofcourse. 🙂
okay, here are weekly charts for the main bearish wave count and the alternate bullish wave count
Thank you 🙂