
Yesterday I expected Friday to move price lower and a red candlestick to complete for Friday’s session. This is what has happened, and the structure on the hourly chart is completing as it was labeled yesterday.
Click on the charts below to enlarge.
Main Bearish Wave Count.
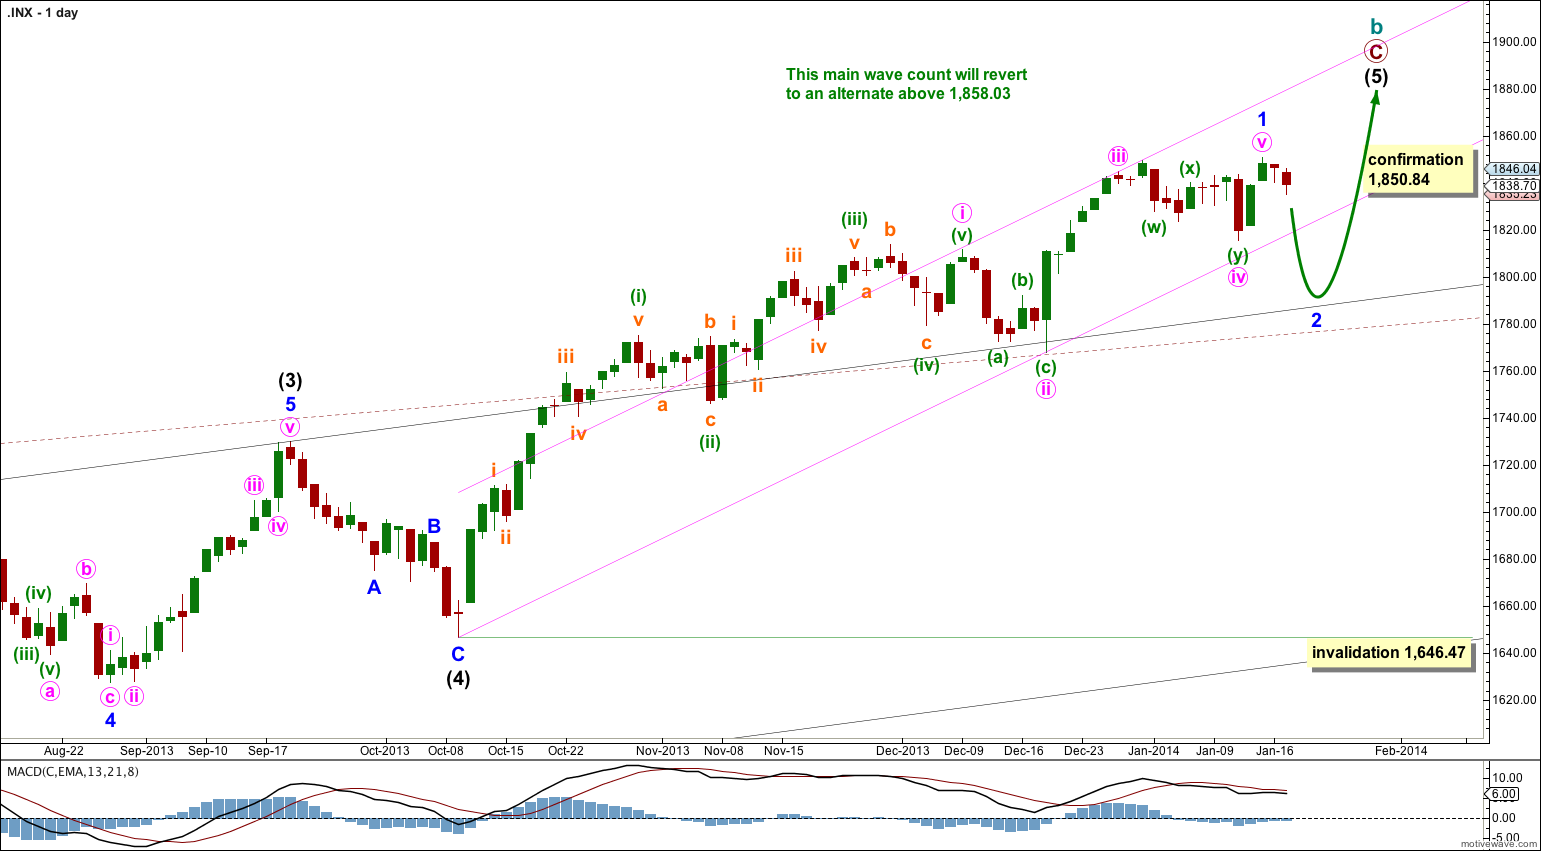
This wave count has a higher probability than the bullish alternate. Upwards movement over the last 4 years and 10 months subdivides best as a zigzag. If something is “off” about the supposed recovery then it must be a B wave because there is plenty that is off in this scenario in terms of social mood.
We should always assume that the trend remains the same until proven otherwise. While price remains above 1,646.47 we should assume the upwards trend is still in place.
The pink channel is drawn about minor wave 1 using Elliott’s first technique: draw the first trend line from the highs of minute waves i to iii, then place a parallel copy upon the low of minute wave ii. I would expect minor wave 2 to breach this channel. Minor wave 2 may find support about the upper edges of the black and maroon – – – channel.
Minor wave 2 may not move beyond the start of minor wave 1. This wave count is invalidated with movement below 1,646.47.
At super cycle degree the structure is an expanded flat correction. Within the flat the maximum common length of cycle wave b is 138% the length of cycle wave a, and this is achieved at 1,858.03. When cycle wave b is longer than the common length of cycle wave a then the probability that an expanded flat is unfolding would reduce and it would be more likely that a long term bull market is underway. Above 1,858.03 I will swap this main wave count over with the bullish alternate.
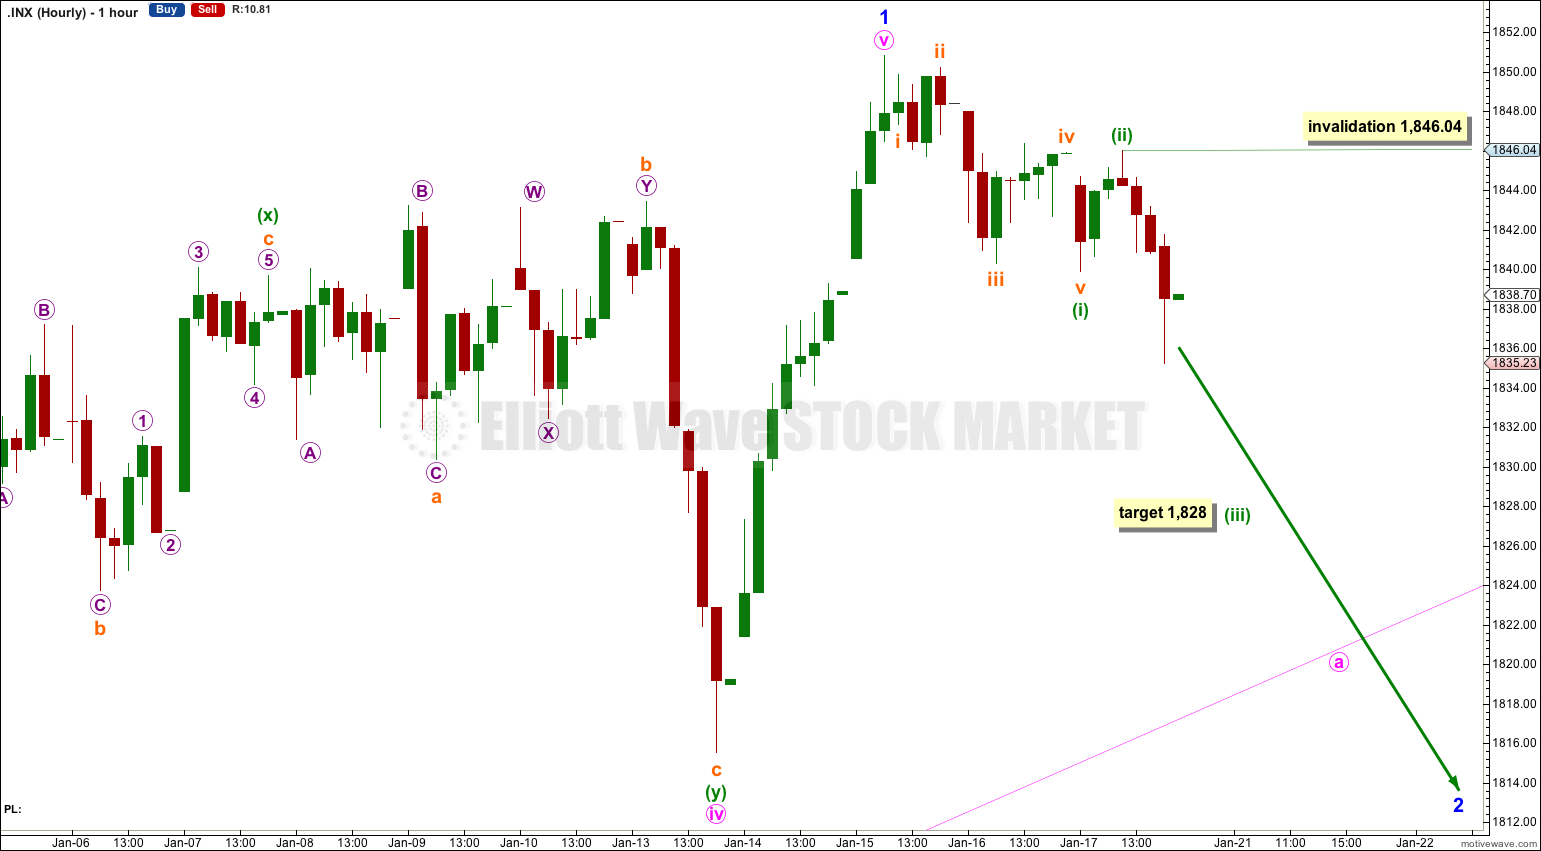
There is now a clear five wave structure downwards on the hourly chart. I have moved the degree of labeling within this downwards movement down one degree today, as I expect minor wave 2 is not almost halfway done and it should last at least 10 days.
Within minor wave 2 minute wave a looks like it is unfolding as an impulse, which indicates minor wave 2 may unfold as a zigzag.
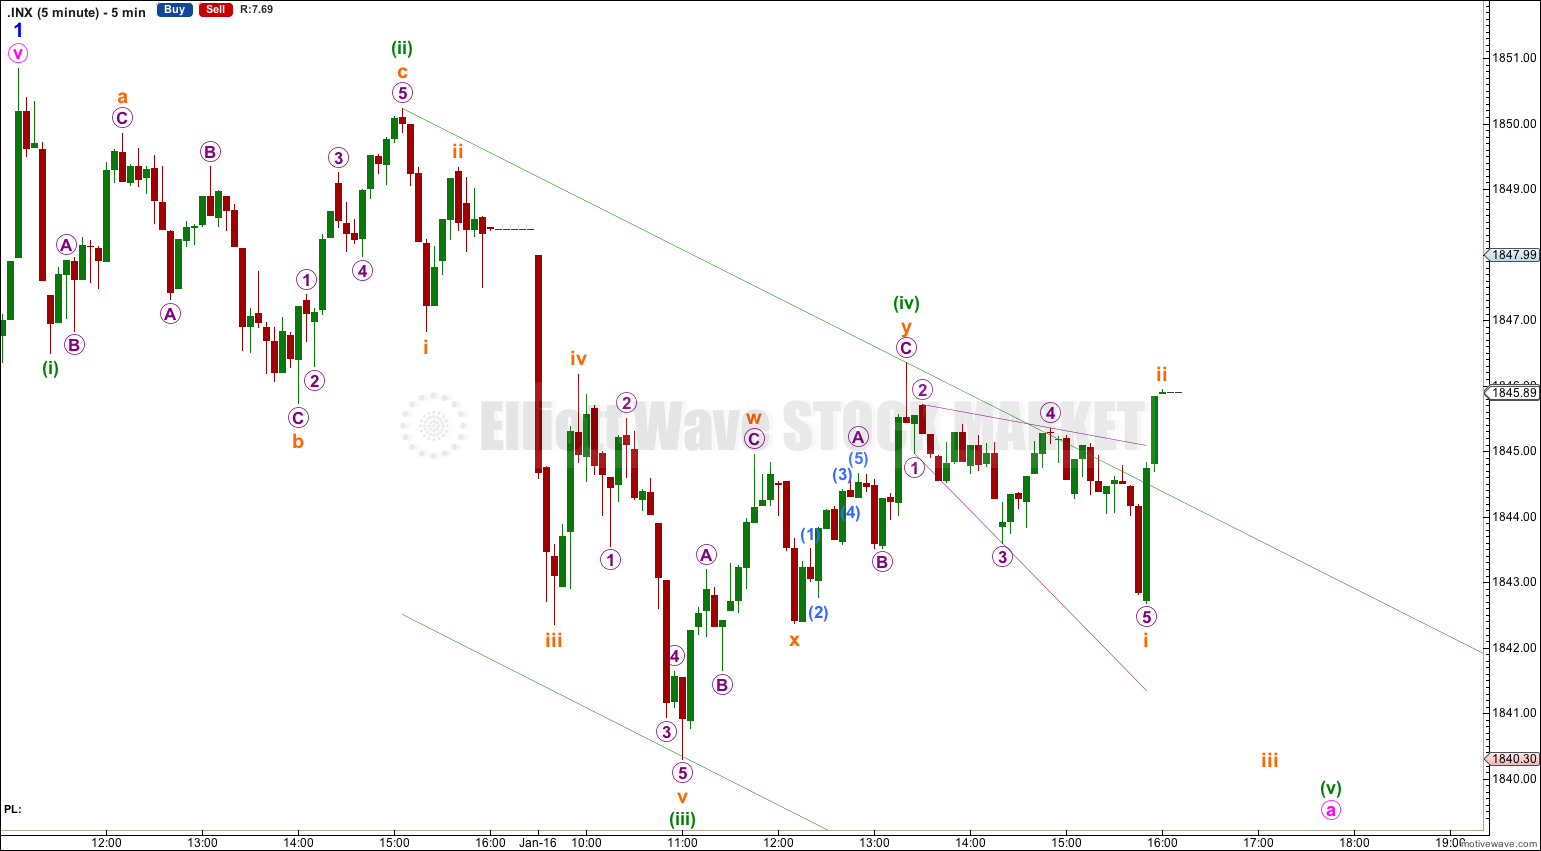
Ratios within minuette wave (i) are: subminuette wave iii has no Fibonacci ratio to subminuette wave i, and subminuette wave v is just 0.09 short of 0.618 the length of subminuette wave iii.
Minuette wave (ii) subdivides as a zigzag on the five minute chart, and the final downwards wave of Friday so far is a three, but looks very much like an incomplete impulse with the middle of the third wave just passed.
I would expect Monday to continue the downwards trend until minute wave a is a completed five wave impulse. Within minuette wave (iii) no second wave correction may move beyond the start of its first wave. This wave count is invalidated in the short term with movement above 1,846.04.
When minuette wave (iii) is completed (probably during Monday) then the invalidation point may move down to the end of minuette wave (i) at 1,839.89. The following correction for minuette wave (iv) may not move back into minuette wave (i) price territory.
I would expect minor wave 2 to be longer duration than any of the corrections at minute wave degree within minor wave 1. The longest was minute wave iv which lasted 10 days. Minor wave 2 should last longer than 10 days.
Bearish Alternate Wave Count.
It is again possible that cycle wave b is over (and the same idea applies for the bullish wave count below as it is possible that intermediate wave (1) is over).
It is possible that we have just seen a big trend change. For this bearish wave count the new downwards trend is at cycle degree. It should last between one to several years and should take price substantially below 666.79. It should subdivide as a motive structure, most likely a simple impulse.
It is always wise to assume that the trend remains the same until proven otherwise. While price remains above 1,646.47 we should assume the trend remains up and this will be an alternate wave count.
If downwards movement breaches support at the black and maroon – – – channels then this wave count would increase in probability. If we see a clear five wave structure downwards on the daily chart this would become my main wave count. Movement below 1,646.47 would confirm a trend change, at least at intermediate wave degree.
Within cycle wave c no second wave correction may move beyond the start of its first wave. This wave count is invalidated with any movement above 1,850.84.
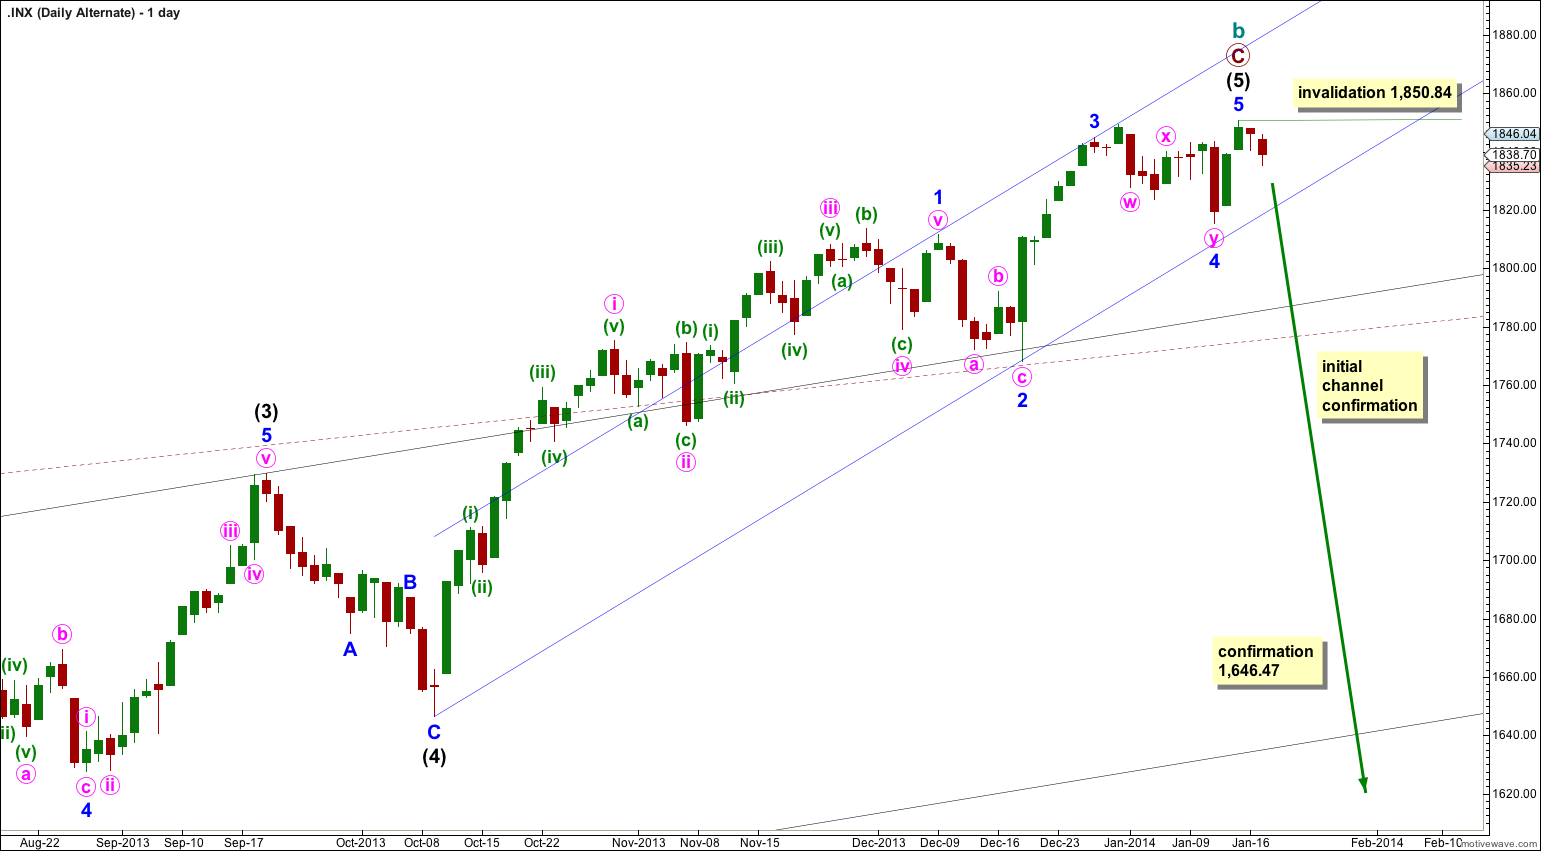
Bullish Alternate Wave Count.
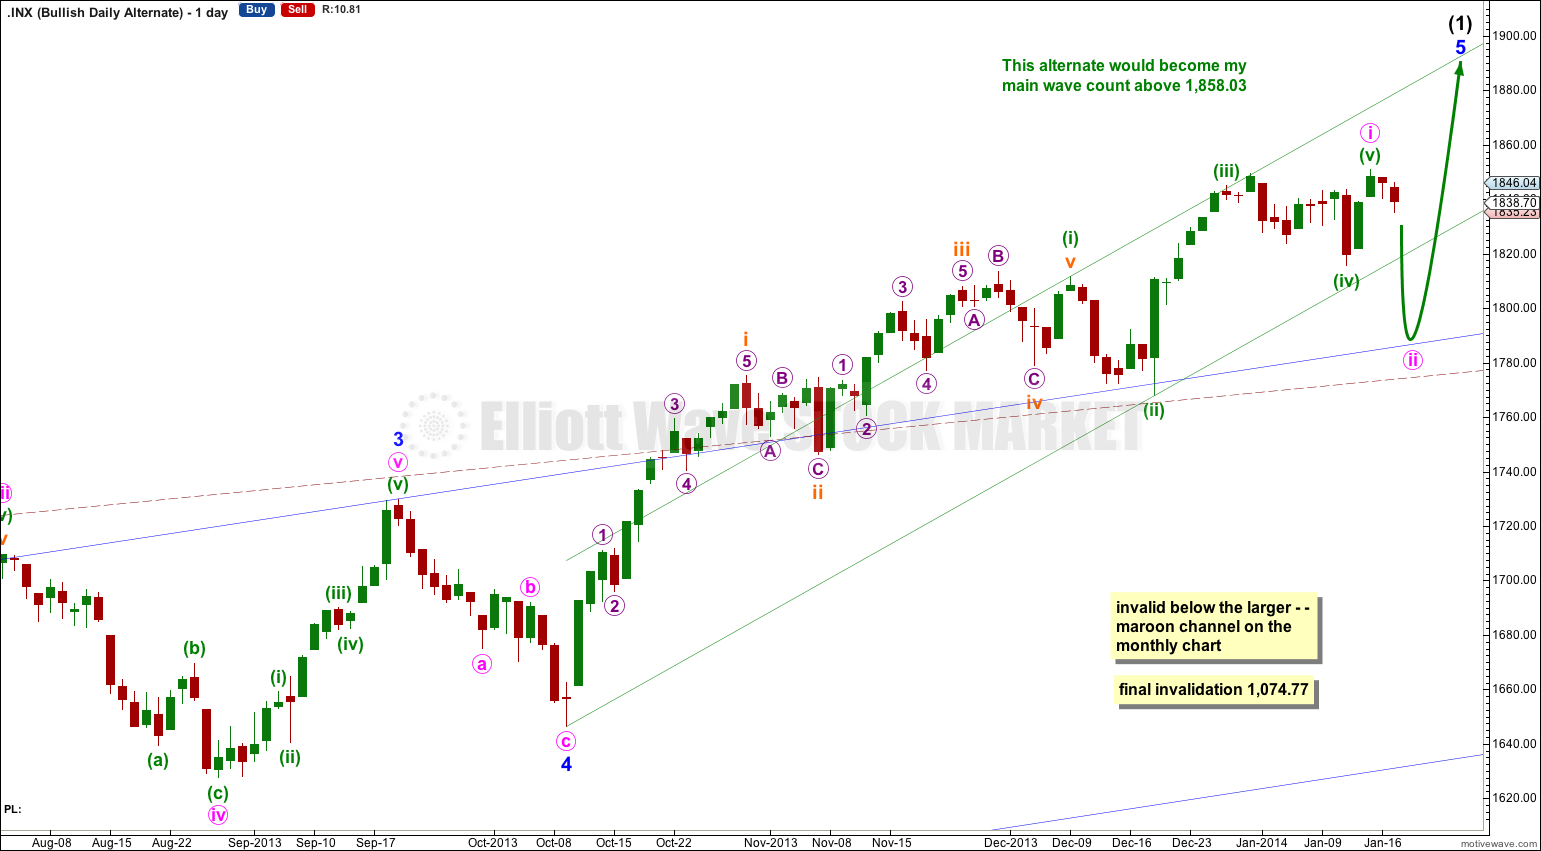
It is possible that a new cycle degree bull market began at 666.79. So far it is not yet halfway through, and I would expect it to last for a few years (at least five more years and probably longer).
The current upwards impulse, labeled intermediate wave (5) for the main wave count and minor wave 5 for this alternate is incomplete. The structure within the final fifth wave is the same, and the structure on the hourly chart is the same. Targets would be the same for this bullish wave count. This wave count does not diverge with the main wave count, and it will not for several weeks or a couple of months or so yet.
When intermediate wave (1) is completed then this alternate also expects a trend change. Intermediate wave (2) downwards should last several weeks to a couple of months or so, and should breach the lower edge of the wide blue channel here on the daily chart. It must subdivide as a corrective structure, most likely a zigzag.
Intermediate wave (2) should not breach support at the lower edge of the larger maroon – – – channel which is drawn the same way for both wave counts. For this alternate intermediate wave (2) should not breach the lower edge of the acceleration channel drawn about primary waves 1 and 2, one degree higher.
Thanks very much!
I’ve been a member for only a short time (couple of weeks), but I must say that from what I’ve seen you are doing a great job. Very impressive!