Only updated charts for you today.
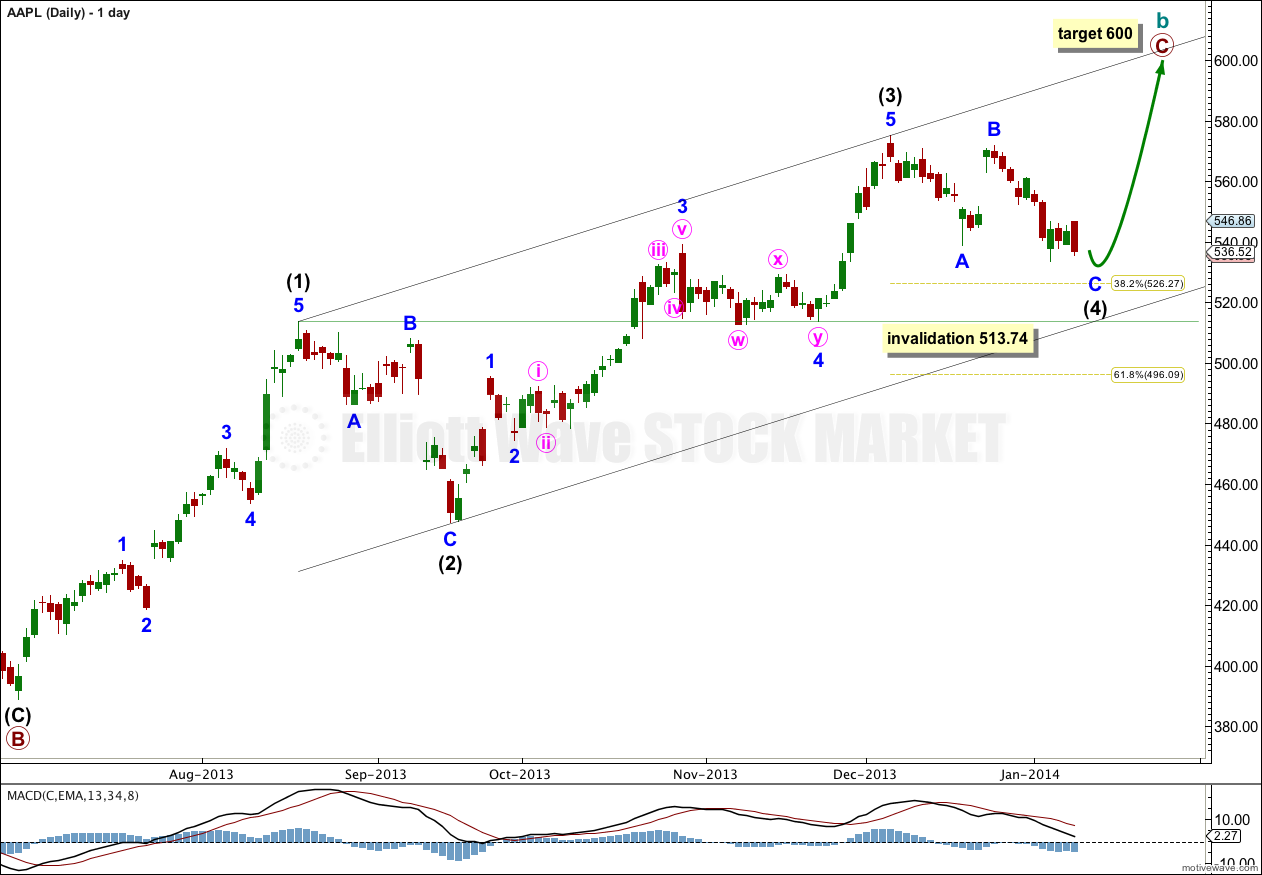
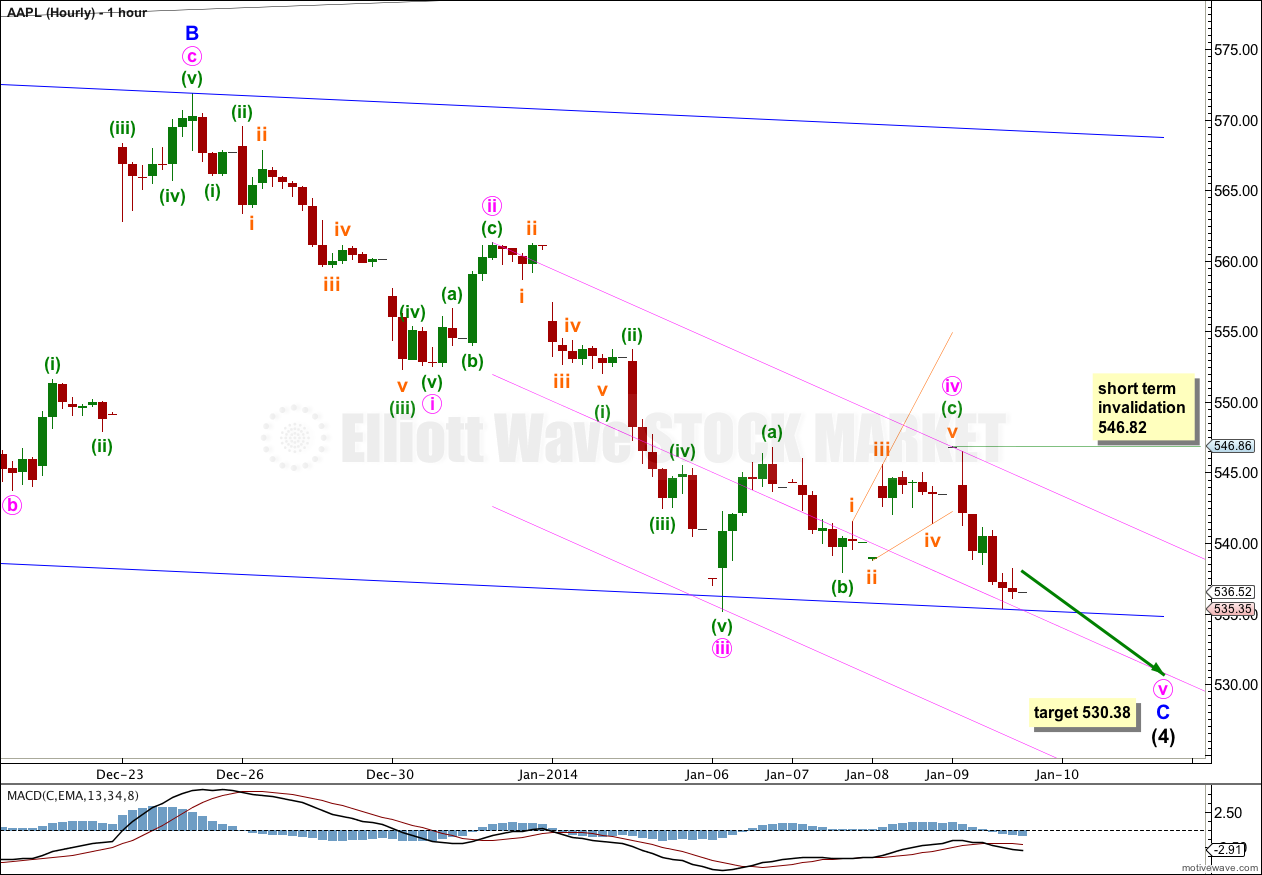
It looks like minute wave iv is over and the final fifth wave down may be incomplete.
If price moves lower then subsequent movement above 546.82 would provide confirmation that intermediate wave 4 is over and intermediate wave 5 upwards to 600 is underway. A clear breach of the pink channel on the hourly chart would also provide some confidence in this trend change.
Click on the charts below to enlarge.


there you go apple at 500$ just like i predicted it will get to 300$ very very soon
I don’t know what data source you’re using, but my Google / Yahhoo data feed has the low for APPL at 545.75 for 27th January, 2014.
You can check the after hours for AAPL at marketwatch.com, it is at $506 at this very moment
Nope he’s right it got crushed after hours
I think the top of wave 2 (Nov 29th 2012) is labeled at 580.02(adjusted for dividends). Without adjusting for dividends, the high was 594.15.
If Appl goes above that level, does it negate it going to a new low or would it be not significant going about that high?
Here are Several More reasons why apple has OFFICIALLY TOpPED!!!!!!!
#1 If you look at my chart its a perfect 61% retracement
#2 Look at that weekly MACD ohhh yess it did turned negative for the 1st time in 8 – 9 months.
#3 and THE LASTTTTT Reason please do look at that weekly candle… What`s it look like? You guessed it right HAMMER DOWN!!!!!!!! I mean those 3 gorgeous reasons and i`d say hugeeee indicators show that APPLE IS DONE!!!!!!!!!
I`m not sure if Apple will go to 600$ which i Highly doubt it as my chart shows an ABC correction with target of low 300$ 308$ maybe that also fits perfectly with bottom of trend line and 61% Fib retracement so goo duck everyone
Your channel and analysis assumes that within that A-B-C correction the B wave is over. Does it subdivide as a complete three?
I`m not sure what you mean but yea B wave will be completed at low 300$ and then the start of a fresh 5th wave up which God knows where it could take apple to but so far MACD and RSI both looking pretty weak and B wave must fallow Besides judging from way overbought SPX on monthly and weekly chart it suggest we in for some stormy market this year.
it would help if your chart had labels, you mention “my chart shows an ABC correction” but there are no ABC labels
384 is A 574 is B 308 is C and i don’t do labels as you you`re amazing at labeling and Elliot waves however, i`m more into indicators elliot waves are always good but if you take elliot wave plus indicators that would be great. Above i posted my weekly chart with 3 reasons why APPLE will start to fall starting next week and although i highly disagree with you on apple going above 600$ I still think you great at elliot wave counts I enjoy your analysis i mostly look at your Gold analysis.
Hi Lara,
What would invalidate your count? Going below the previous low I assume?
What would be the approximate level you are looking for wave three to reach assuming this is wave two?
Thanks so much.
Movement below 529.88 would invalidate the wave count.
At this sate I’m not sure wave 2 has ended. I’d use a channel about it to confirm when it’s over. Only then could a target be calculated for the third wave, at this stage we don’t know where it begins. I’d expect the third wave to be either 49.04 or 79.35 in length.
Hi Lara,
New to this site. Like your work. Thanks.
A quick question: AAPL just touched 546.73 today which is slightly below the invalidation price of $546.82 that you mentioned. Is this sufficient to confirm that “intermediate wave 4 is over and intermediate wave 5 upwards to 600 is underway”?
Thanks again.
Jack
Yes, intermediate wave (4) is over, and the target which was at 530.38 was almost met. Price turned around at 529.88, just 0.5 below the target.
I will not update my AAPL analysis because it does not need it. It’s doing exactly as I expected.
Even after today’s slaughter? Hopefully a deep minor 2?
Most likely. Second waves are often very deep.
From 530.38 on the hourly chart the first upwards wave subdivides as a five. The following deep downwards movement so far looks like a three.
While price remains above 530.38 this wave count is correct and valid and I’ll expect overall more upwards movement. I see no need to update this wave count at this stage.
Yes, I believe this is a wave 2 correction in the wave 5 overall upwards trend. The 3 days of upward movement was basically the wave 1 in the entire wave 5 intermediate wave (if that makes sense). If you look at intermediate wave 2 (on daily charts) it was basically the same thing when wave 3 started. Three days of upward sharp movement and then a wave 2 correction in the wave 3 upward movement that was sharp. I concur that this is a wave 2 correction in the ultimate uptrend wave 5 and we will see a jump up most likely tuesday and then fade in to thursday and friday next week which will be the end leg of the wave 2 correction in wave 5 intermediate wave cycle.
So far, it appears that on the hourly chart wave 5-1 up (529.88-559.99) lasted approximately 3 days, and wave 5-2 down (559.99-539.90) lasted approximately 2 days. The corrective wave 5-2 on the hourly chart is either complete, or almost complete. So far, it took 5 trading sessions to complete the first two waves of intermediate wave 5 on the daily. How long do you expect wave 5-3 up to last, and what is the price target? To me, it appears that this intermediate wave 5 on the daly will be short after all. What do you think?
It is also interesting to note that wave 2 corrections retrace 61.8% of wave 1 (wave 5-1 in this case) which would make that price $543. Todays price is at $544 so I believe we are fairly close to the end of 5-2 and on to 5-3.
because we don’t know that minor wave 2 has ended yet, we can’t calculate a target for minor wave 3 upwards. I’d expect it to be either 40.04 or 79.35 in length. I’d expect minor wave 3 to be longer in duration than minor wave 1 which I have as two days. I’d expect minor wave 3 to be either 5 or 8 days.
I think the big black channel on the daily chart would be a most excellent guide to where intermediate wave (5) should end.
Hi, could you tell me that in AAPL(Daily), the minute w,x,y formed the minor 4 is a double zigzag or just represented sideways correction?
Thanks
It subdivides as a double zigzag on the hourly chart.
not necessarily
That is exactly what I think too, which is why I am playing the Jan 24 call options. To me it appears that minute wave (v) on the hourly chart is almost complete. There may be one more thrust lower at the opening bell on Mon to complete this wave, and then prompt reversal to begin the intermediate wave 5 on the daily chart.
So, I’m thinking that your wave count shows we must be done soon with the downward move (and the stock is near the uptrend line so that would make sense).
If I have this right, we should see about 2 weeks worth of upward movement toward 600 which is followed by a trip to new lows (350 or thereabouts).
So………. it would seem that this would have to happen before earnings, because why would the stock go up to 600 after earnings and then travel to new lows.
Earnings is 10 trading days away.
Where did you get 2 weeks from??? Wave 5 can not be longer than wave 3 as a guideline. Wave 3 was 12 weeks in duration. Wave 5 therefore approximates wave 1 which was shorter than wave 3. Therefore, the duration to 600 would take roughly 7-8 weeks to mature to the 600 target. And also remember…there are invalidations if price moves above or below certain levels. So just because it moves to 600 does not mean it can not go to 1000.
Will be interesting to see what happens next week. There must be a catalyst to drive this price higher and validate wave 5. Things have been quite as of late…typical of a wave 4 correction, usually frustration and option market volatility, and low volumes….all of which have happened.
I have put no timeframe on this next upwards wave, so yeah, two weeks did not come from me.
However, intermediate wave (3) at 127.92 is slightly longer than intermediate wave (1) at 124.87 and so the length of intermediate wave (5) is not limited. It may be longer than wave (3). The rule is that a third wave may not be the shortest, not that a fifth wave cannot be longer than a third.
Wave (1) lasted 35 days, wave (3) lasted 55 days. Wave (5) may be more likely to be closer to 35 days, which would see it last seven weeks.
It was from the last lines of the Jan. 6th update:
“Subsequent movement above 552.32 would confirm that minor wave C and so probably intermediate wave (4) would be over. At that stage I would expect about two weeks of upwards movement towards 600.”
okay, yes.
that was wrong. I did not look at the duration of the first and third waves when I wrote that expectation. I would expect the fifth wave to more likely be similar in duration to the first which was 35 days. Two weeks would be too brief.
I’ll be more careful in the next AAPL analysis to provide expectations for duration which are better than that! sorry!
Are you expecting a move to 600 within Jan itself?