
Last analysis expected more choppy overlapping movement, with a new high possible during Tuesday’s session, which is exactly what we have seen.
This correction is not over and should continue for another three to seven days.
Click on the charts below to enlarge.
This wave count has a higher probability than the bullish alternate. Upwards movement over the last 4 1/2 years subdivides best as a zigzag. If something is “off” about the supposed recovery then it must be a B wave because there is plenty that is off in this scenario in terms of social mood.
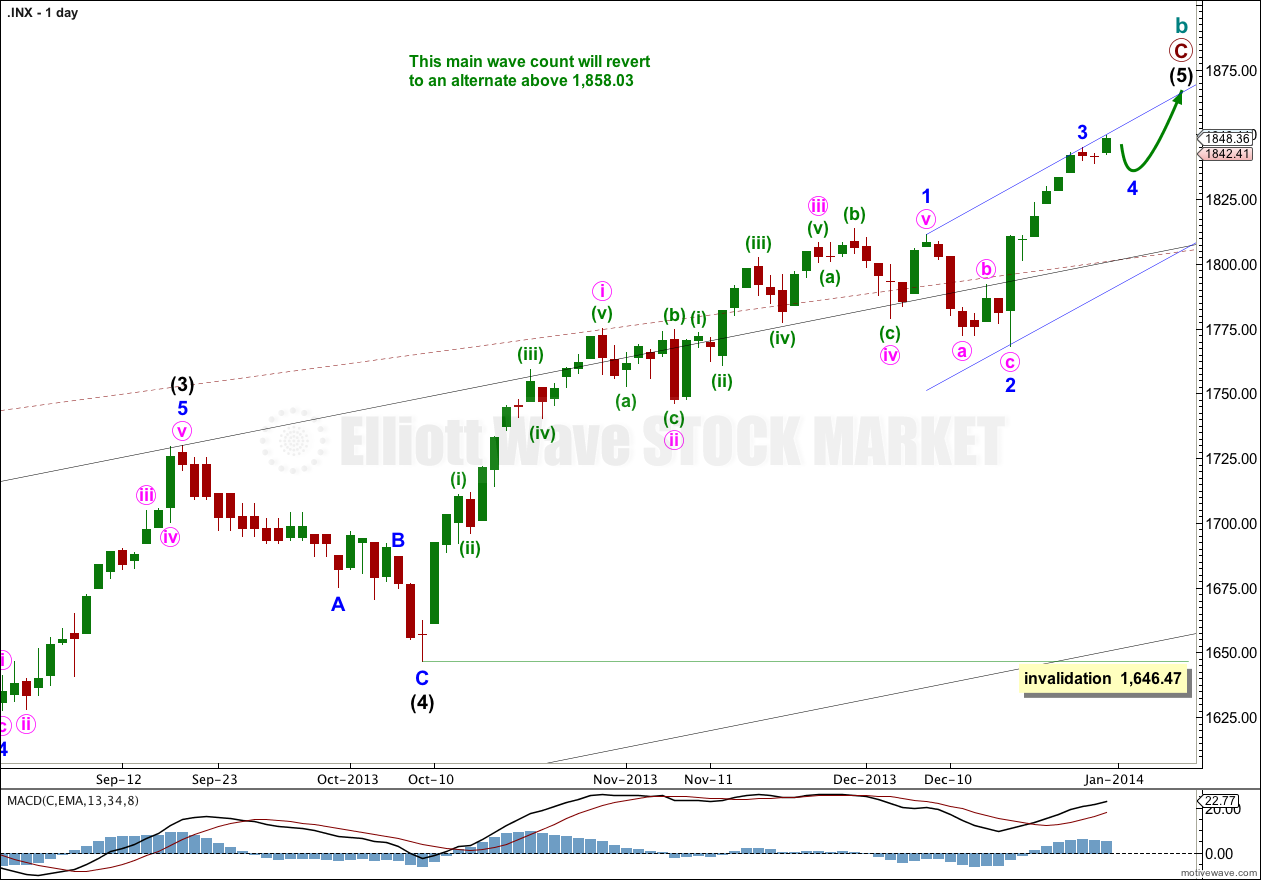
We should always assume the trend remains the same, until proven otherwise. This is a huge trend change. I will assume we are yet to see new highs while price remains above 1,646.47.
Minor waves 1, 2 and 3 are complete. Minor wave 4 has begun.
We may be about to see a larger fractal at minor wave degree of the structure within minor wave 1 at minute wave degree; there the first wave was extended, the third wave was shorter, and the fifth wave was shorter still.
Intermediate wave (3) is just 0.76 points short of 2.618 the length of intermediate wave (1). We may not see a Fibonacci ratio between intermediate wave (5) and either of (3) or (1).
Intermediate wave (1) lasted 18 days. So far intermediate wave (5) has lasted 57 days. It may last a total of a Fibonacci 89 days which would see it end on 10th February, 2014. However, Fibonacci time relationships are not very reliable for the S&P. This is a rough guideline only,
At super cycle degree the structure is an expanded flat correction. Within the flat the maximum common length of cycle wave b is 138% the length of cycle wave a, and this is achieved at 1,858.03. When cycle wave b is longer than the common length of cycle wave a then the probability that an expanded flat is unfolding would reduce and it would be more likely that a long term bull market is underway. Above 1,858.03 I will swap this main wave count over with the bullish alternate.
Upwards movement was expected to complete a C wave within an upwards zigzag.
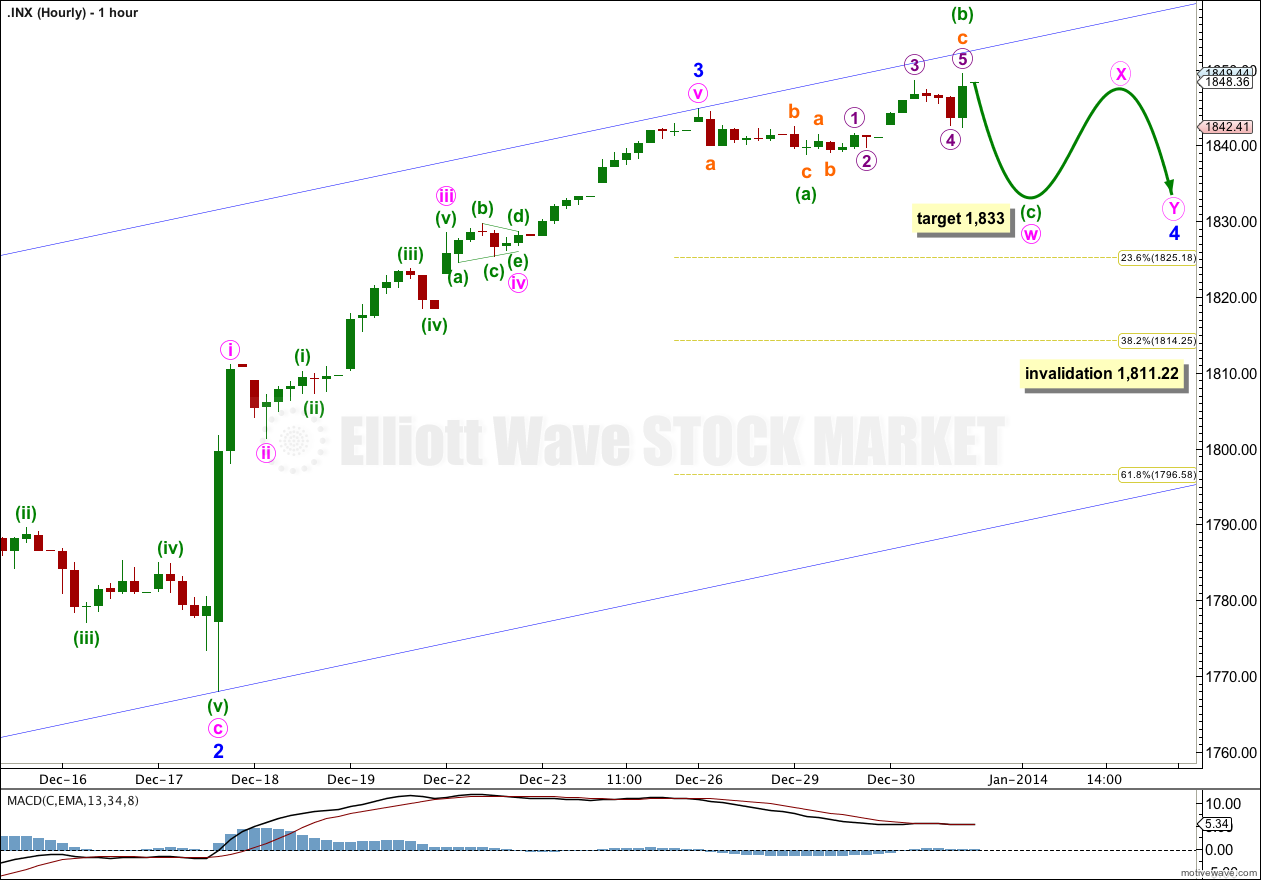
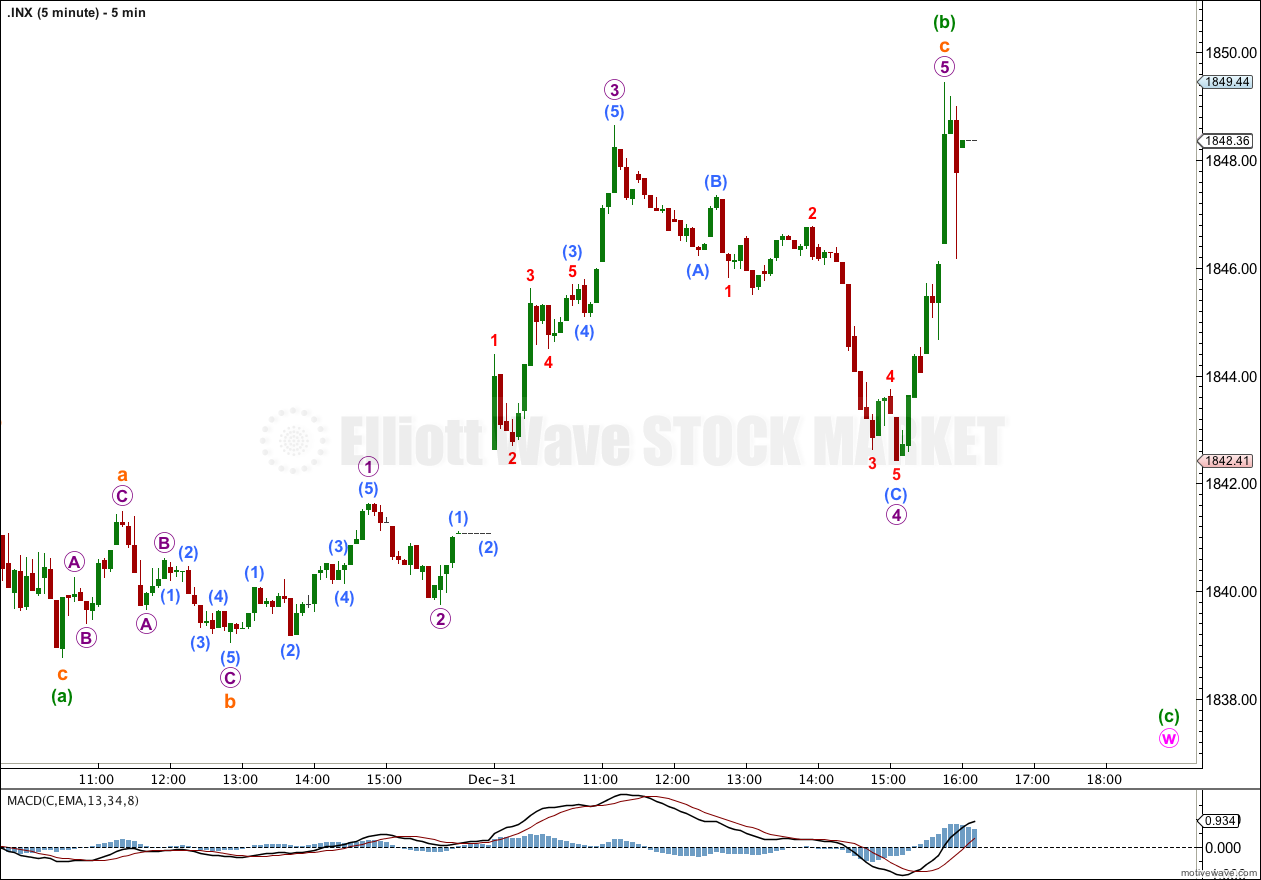
Within minor wave 4 I have today moved the degree of labeling down one degree. I would not expect minor wave 4 to be over in just one or two more days, but I would expect a three wave structure to be over probably tomorrow. This first three wave structure is most likely the first flat correction within a double flat or double combination.
Within the first flat correction of this double so far minuette waves (a) and now (b) may be complete. Minuette wave (b) is a 174% correction of minuette wave (a). If minute wave w is unfolding as a flat correction (most likely) then it would be an expanded flat.
Because of minuette wave (b) is long in relation to minuette wave (a) the target for minuette wave (c) is calculated at 2.618 the length of minuette wave (a) at 1,833. This is exactly 0.146 of minor wave 3 (an unusual Fibonacci ratio, but mathematically correct).
So far minor wave 4 has lasted two days. I would expect it to continue further for another three days at least, and more likely longer. It may complete in another three to seven days.
Minor wave 4 may not move into minor wave 1 price territory. This wave count is invalidated with movement below 1,811.22.
Bullish Alternate Wave Count.
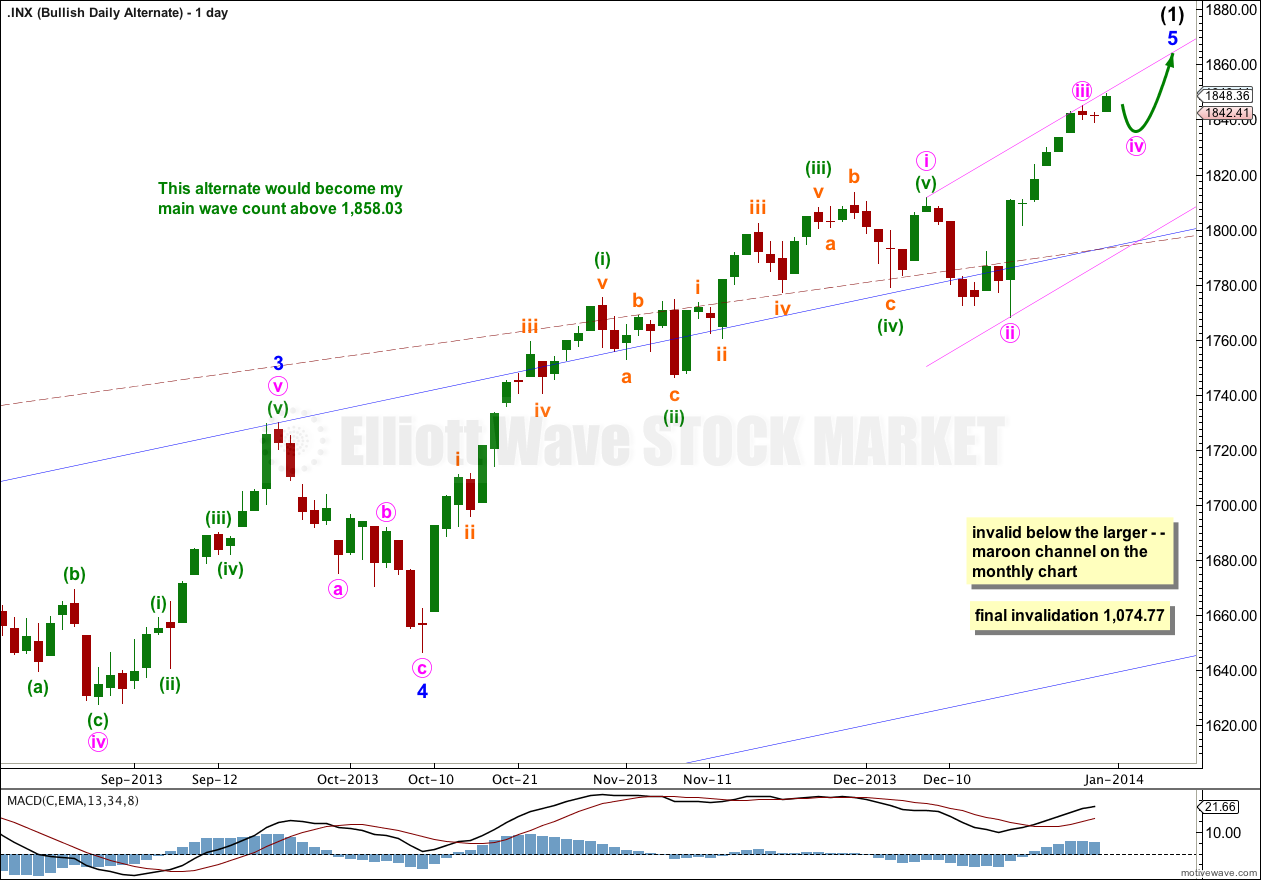
It is possible that a new cycle degree bull market began at 666.79. So far it is not yet halfway through, and I would expect it to last for a few years (at least five more years and probably longer).
The current upwards impulse, labeled intermediate wave (5) for the main wave count and minor wave 5 for this alternate is incomplete. The structure within the final fifth wave is the same, and the structure on the hourly chart is the same. Targets would be the same for this bullish wave count. This wave count does not diverge with the main wave count, and it will not for several weeks or a couple of months or so yet.
The maroon – – – channel is an acceleration channel drawn about primary waves 1 and 2 on the monthly chart (it is drawn in exactly the same way on the main wave count, but there it is termed a corrective channel). I would not expect intermediate wave (2) to breach this channel because a lower degree (intermediate) wave should not breach an acceleration channel of a higher degree (primary) first and second wave.
Sweet way to start the new year …. one of your best turns // Thank you!
thanks! Happy New Year
TEPCO Quietly Admits Reactor 3 Could Be Melting Down NOW http://nsnbc.me/2013/12/30/tepco-quietly-admits-reactor-3-melting-now/