
Yesterday’s main wave count expected more upwards movement before a second wave correction began. The second wave correction had already started, and price did not move higher.
All three daily wave counts remain valid.
Click on the charts below to enlarge.
Main Wave Count.
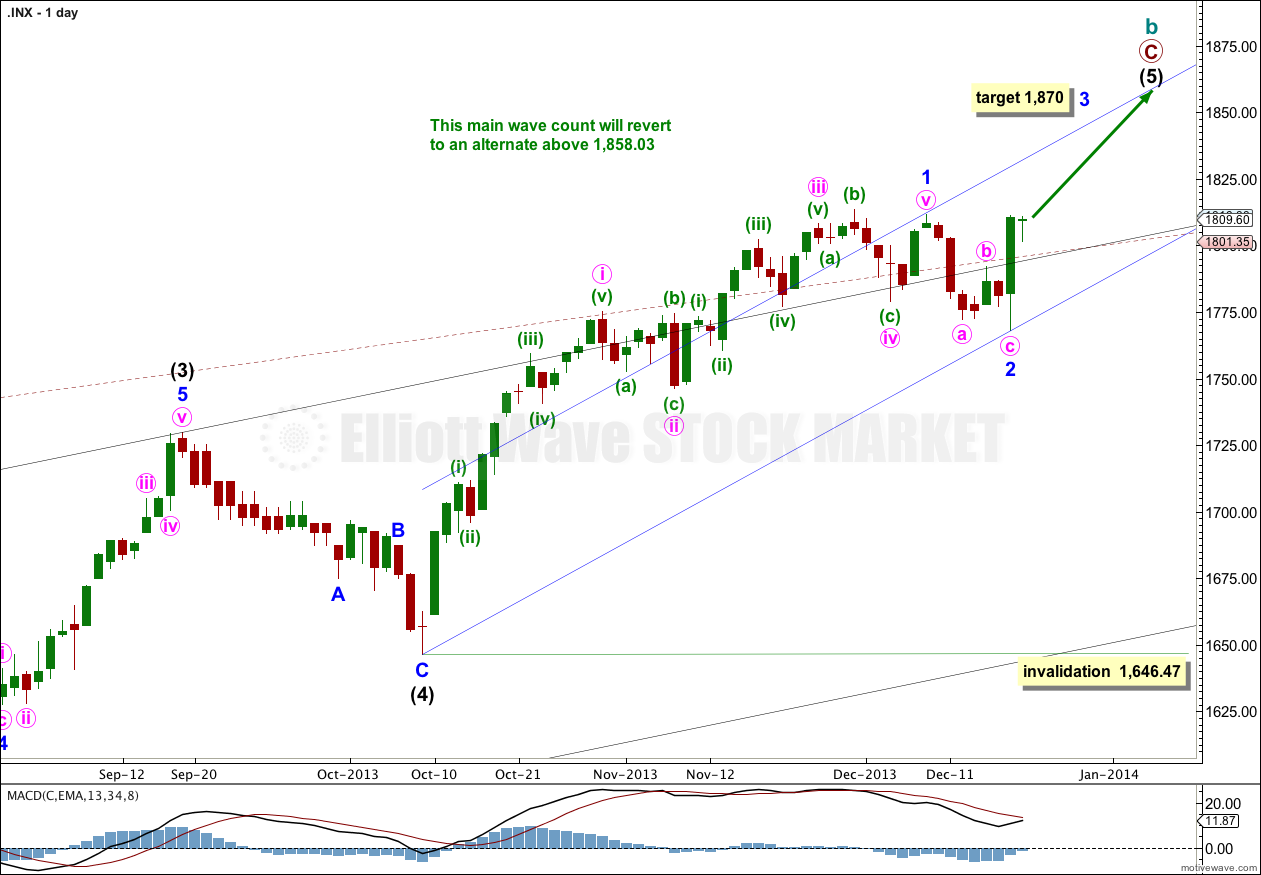
This wave count has a higher probability than the bullish alternate. Upwards movement over the last 4 1/2 years subdivides best as a zigzag. If something is “off” about the supposed recovery then it must be a B wave because there is plenty that is off in this scenario in terms of social mood.
We should always assume the trend remains the same, until proven otherwise. This is a huge trend change. I will assume we are yet to see new highs while price remains above 1,646.47.
Minor waves 1 and now also 2 are most likely complete. Minor wave 3 upwards may have begun. I have drawn an acceleration channel about minor waves 1 and 2. Minor wave 3 upwards should break through resistance at the upper trend line. The lower trend line should provide support for corrections within minor wave 3.
At 1,870 minor wave 3 would reach 0.618 the length of minor wave 1. I am using this Fibonacci ratio to calculate the target because minor wave 1 is extended, and so minor wave 3 may not be. We may be about to see a larger fractal at minor wave degree of the structure within minor wave 1 at minute wave degree; there the first wave was extended, the third wave was shorter, and the fifth wave was shorter still.
Intermediate wave (3) is just 0.76 points short of 2.618 the length of intermediate wave (1). We may not see a Fibonacci ratio between intermediate wave (5) and either of (3) or (1).
Intermediate wave (1) lasted 18 days. So far intermediate wave (5) has lasted 53 days. If it is continuing it may last a total of a Fibonacci 89 days which would see it end on 10th February, 2014. However, Fibonacci time relationships are not very reliable for the S&P. This is a rough guideline only,
At super cycle degree the structure is an expanded flat correction. Within the flat the maximum common length of cycle wave b is 138% the length of cycle wave a, and this is achieved at 1,858.03. When cycle wave b is longer than the common length of cycle wave a then the probability that an expanded flat is unfolding would reduce and it would be more likely that a long term bull market is underway. Above 1,858.03 I will swap this main wave count over with the bullish alternate.
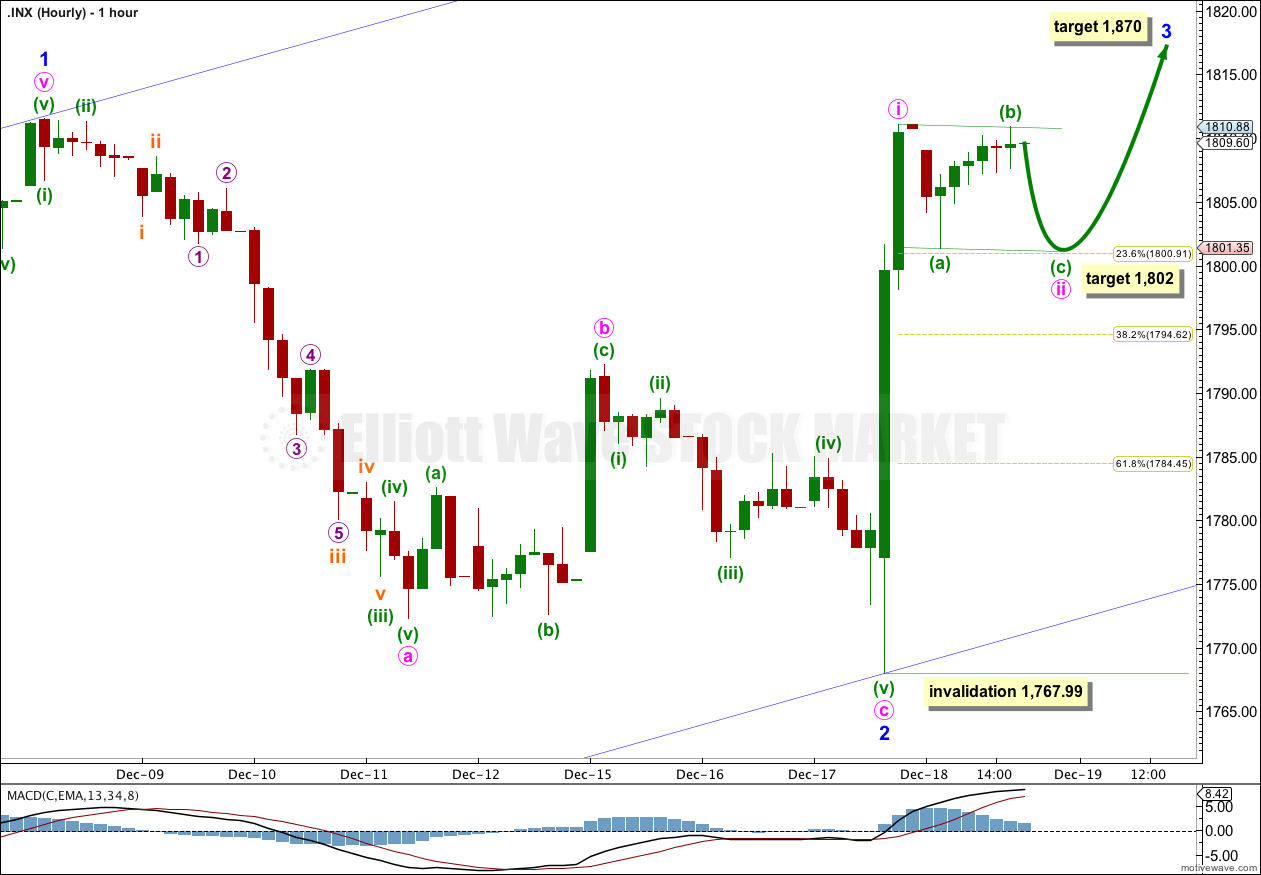
So far within minor wave 3 minute wave i may be complete. Minute wave ii may possibly be complete at the low labeled minuette wave (a) if we move the degree of labeling within that three wave structure up one degree. But what is more likely is that minute wave ii will continue further to be better in proportion to minute wave i, and that it will show on the daily chart as a doji and a red candlestick.
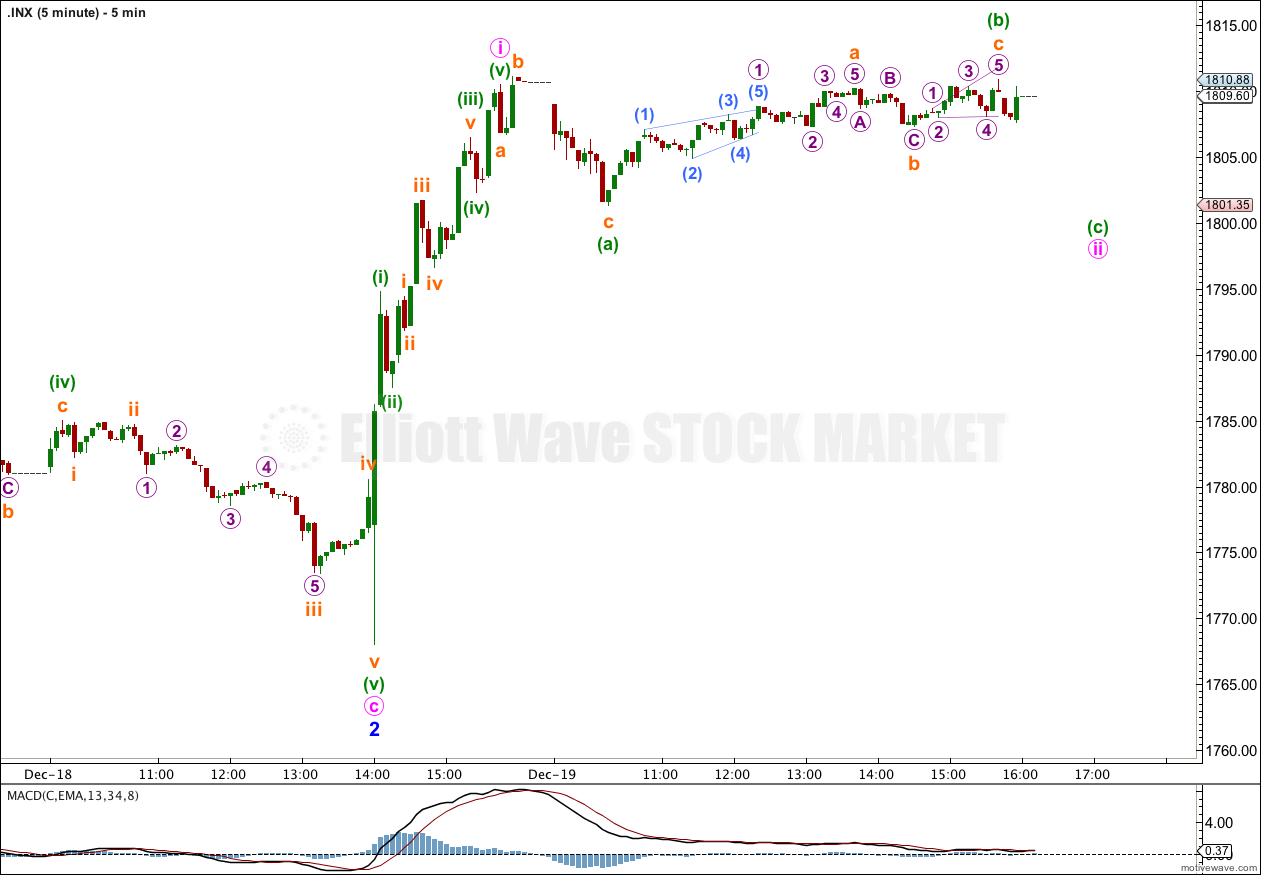
Within minute wave ii minuette wave (a) subdivides as a three, and minuette wave (b) also subdivides as a three. Minuette wave (b) is a 104% correction of minuette wave a so this would be a regular flat. Regular flats most often remain nicely contained within parallel channels, and minuette wave (c) would most likely reach equality with minuette wave (a) at 1,802. (Wave lengths and targets were calculated from the 5 minute chart below).
Minute wave ii may not move beyond the start of minute wave i. This wave count is invalidated with movement below 1,767.99.
Bearish Alternate Wave Count.
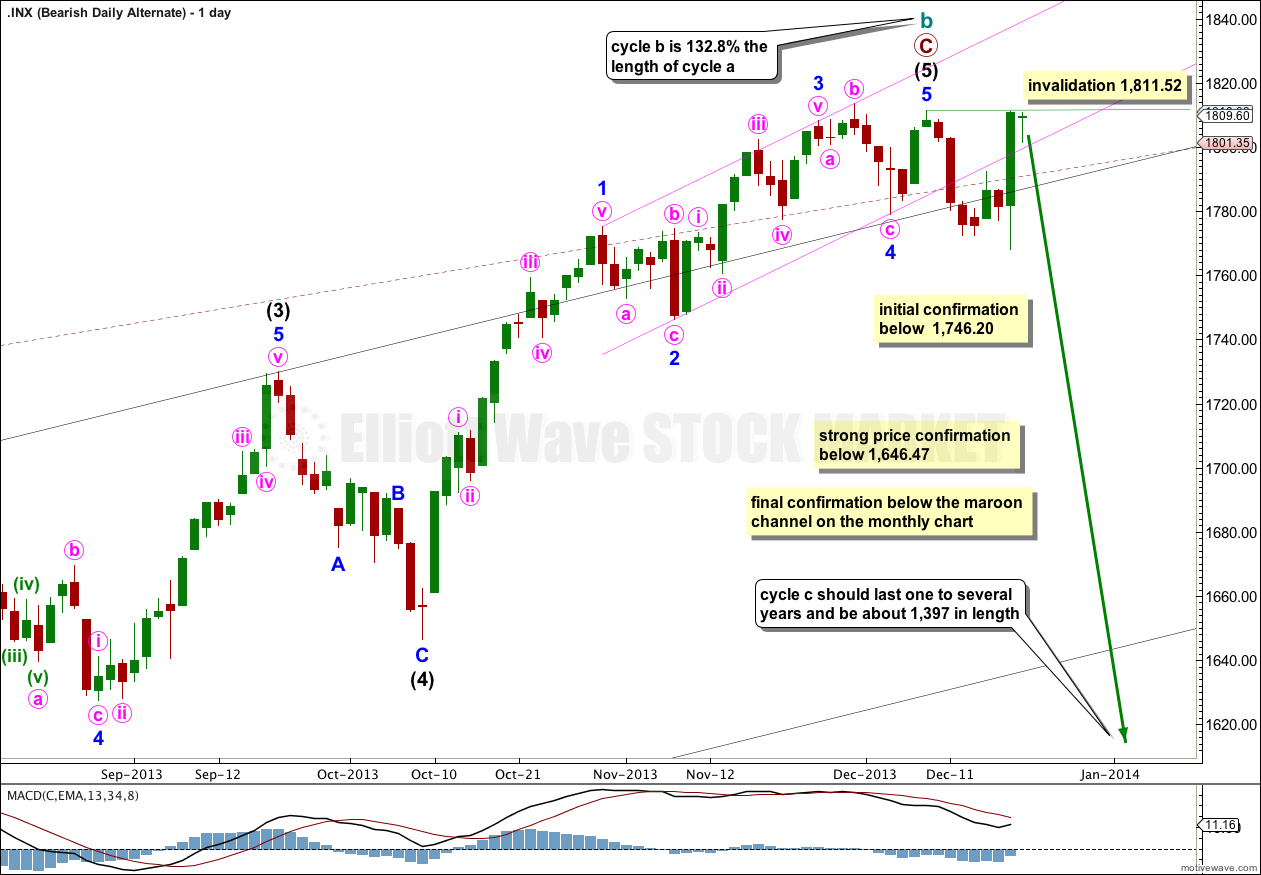
We should always assume the trend remains the same, until proven otherwise. “The trend is your friend”. This wave count is possible, but we have absolutely no confirmation of a trend change at cycle degree.
By simply moving the degree of labeling within intermediate wave (5) up one degree it is possible to see cycle wave b completed at all wave degrees. On the hourly chart the subdivisions for this wave count would be the same as the hourly chart above, except instead of being labeled a-b-c it would be labeled 1-2-3. When the possible fourth wave arrives it will provide an indication as to whether or not this wave count is correct; if price moves back above 1,772.28 then upwards movement could not be a fourth wave correction as it would be in what would be first wave price territory. The main wave count would require movement above this point.
Within cycle wave b primary wave C is 47.06 longer than equality with primary wave A. Upwards movement may have found final resistance at the upper edge of the maroon channel drawn about the whole of cycle wave b from its start at 666.79.
Cycle wave b is 132.8% the length of cycle wave a, within the common length of 100% to 138% for a flat correction. Because cycle wave b is over 105% the length of cycle wave a this would be an expanded flat which normally expects a C wave to move substantially beyond the end of the A wave. Movement well below 666.79 would be expected for this wave count.
Strong price confirmation of a trend change would come with movement below 1,646.47, and with invalidation of the main wave count above. At that stage both this wave count and the bullish alternate would be correct, and this would be my main wave count.
For this bearish wave count the big maroon channel on the monthly chart needs to be breached. If that occurs then the bullish alternate would be discarded, and this would be my only wave count.
Within cycle wave c no second wave correction may move beyond the start of its first wave. This wave count is invalidated with movement above 1,811.52.
Bullish Alternate Wave Count.
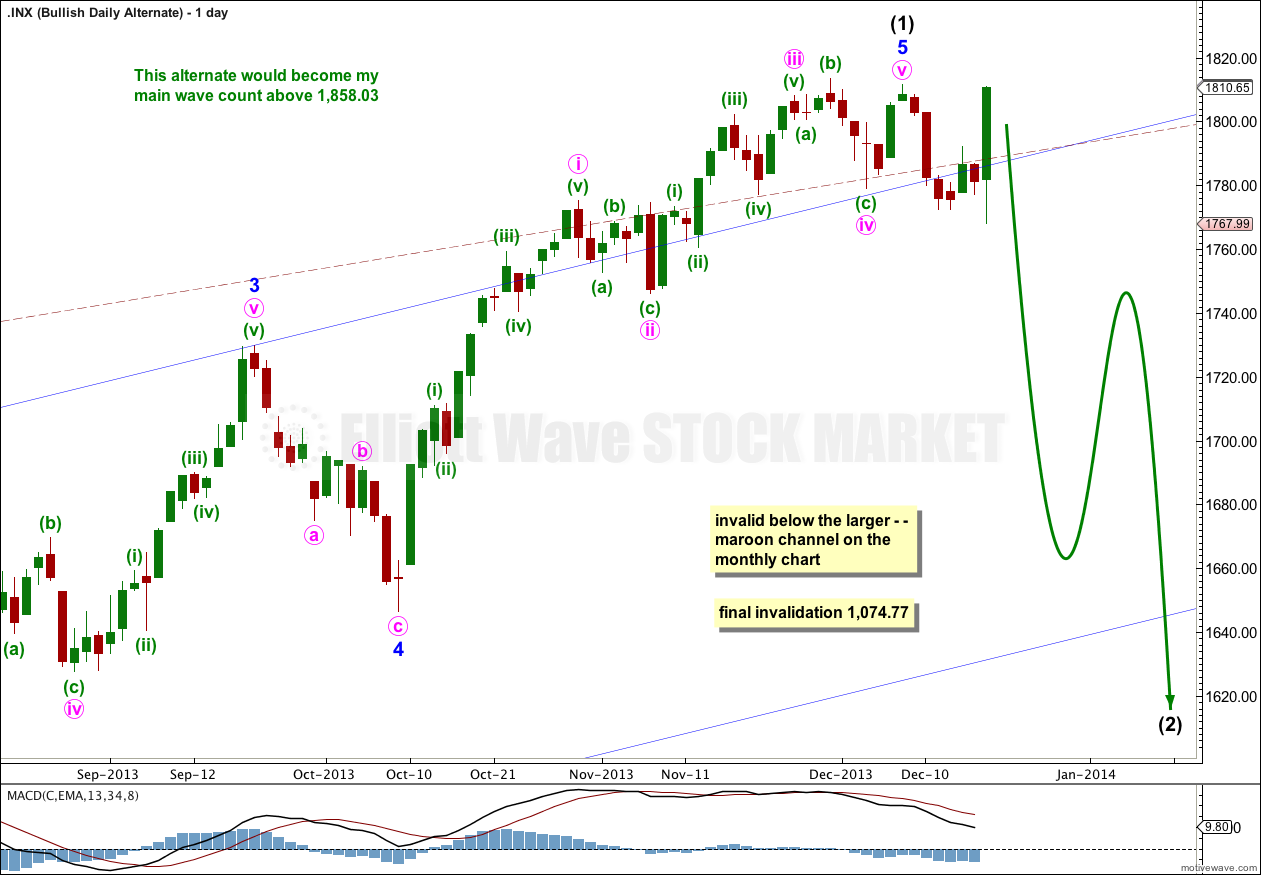
It is possible that a new cycle degree bull market began at 666.79. So far it is not yet halfway through, and I would expect it to last for a few years (at least five more years and probably longer).
The current upwards impulse, labeled intermediate wave (5) for the main wave count and minor wave 5 for this alternate could now be completed. At this stage both wave counts could see a trend change. The bearish wave count expects a huge cycle degree trend change, and this alternate expects an intermediate degree trend change. If the downwards movement subdivides as a three and remains within the maroon channel then this alternate would be preferred. If it breaches the channel this alternate would be discarded.
The maroon – – – channel is an acceleration channel drawn about primary waves 1 and 2 on the monthly chart (it is drawn in exactly the same way on the main wave count, but there it is termed a corrective channel). I would not expect intermediate wave (2) to breach this channel because a lower degree (intermediate) wave should not breach an acceleration channel of a higher degree (primary) first and second wave.
Hi Lara,
My FXCM charts show a low of 1759.8 on the 16/12/13, but your charts today show the low as 1767 on the 17/12/13. I don’t know why this is ?
It’s infuriating I know, and it shouldn’t happen. But different data feeds sometimes have different price points.
I’m using a google / yahoo data feed.
On the 16th Dec I have a low of 1,777.48. On the 17th Dec I have a low of 1,777.05.
I think you mean the low labeled minor wave 2. I have that on 18th Dec at 1,767.98.
I don’t know why this is either. And it shouldn’t happen. It’s a perennial problem, and one reason why I try to stick to the one data feed even though this one has problems sometimes of disappearing candlesticks…
If anyone else has a theory as to why different data feeds show different price points for the same market I’d be interested to hear it.