
A long standing member has asked for a wave count of the Nasdaq.
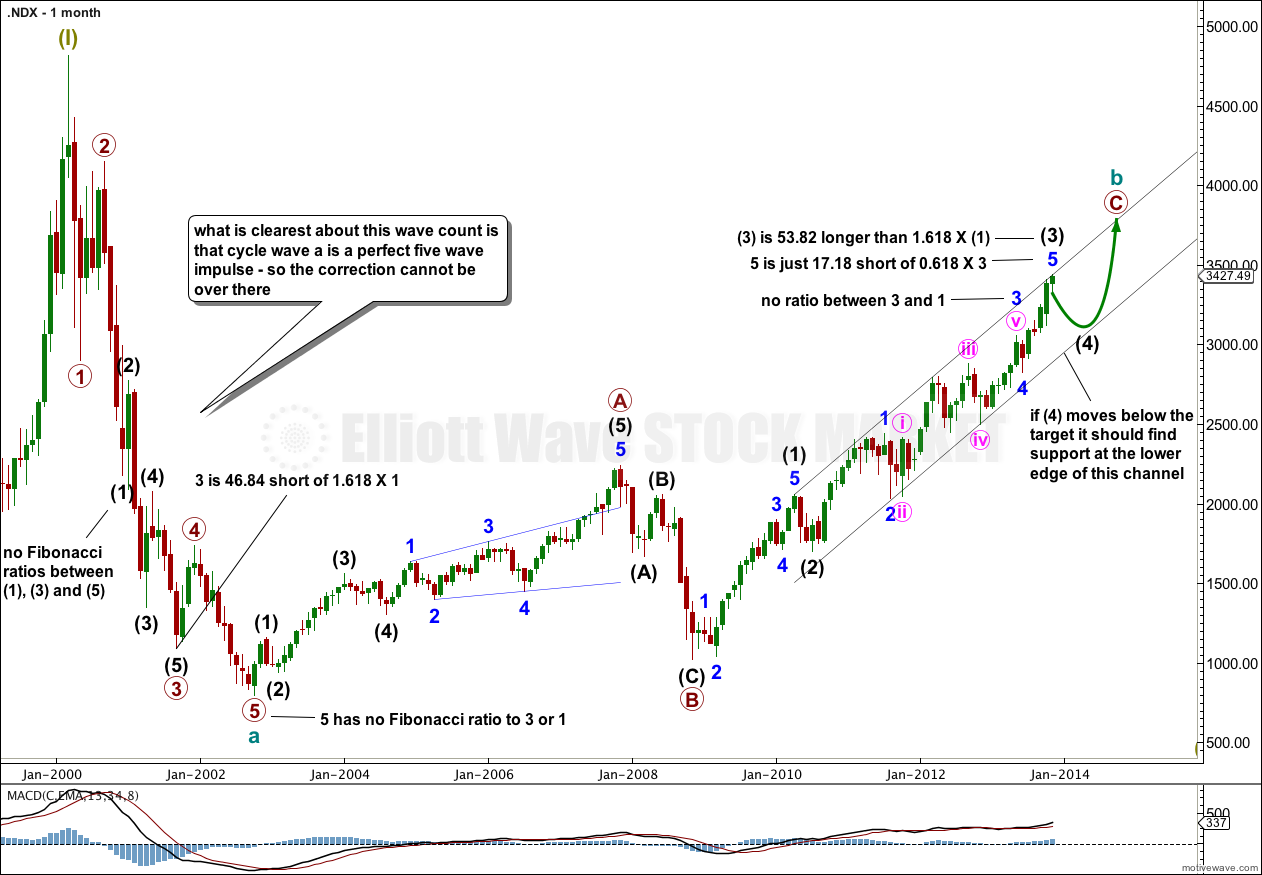
The clearest thing on the monthly chart is the big move downwards ending at 4,021.10 in October 2002. This structure is a five wave impulse. It moves against the trend, so it is corrective. A single five wave structure cannot be a complete correction.
When cycle wave b upwards is complete cycle wave c would be highly likely to move price below 4,021.10 to avoid a truncation.
Cycle wave b may not move beyond the start of cycle wave a. I would not expect new all time highs from the Nasdaq for a long time yet.
Click on the charts below to enlarge.

– This analysis is for members only,
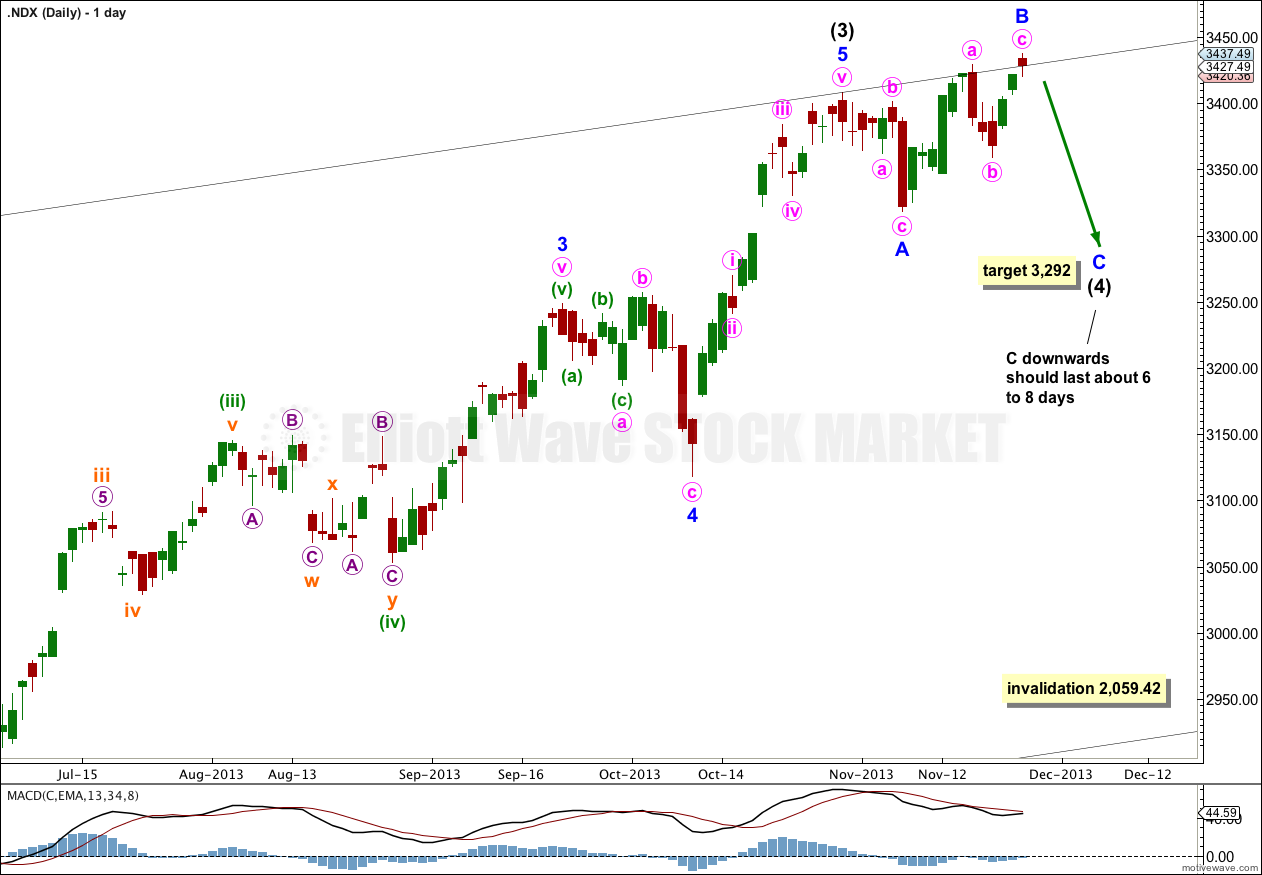
Hi Lara. This count is very useful. Given subsequent price action, I suspect that intermediate wave (3) may have completed at the March high of 3740 where wave 3 equals 200% of wave 1. If this is correct, then we would now be in intermediate wave (4) correction. Does this look feasible to you?
It does… but I have not updated my Nasdaq wave count since November last year.
The only thing which jumps out at me from the Nasdaq chart is the current downwards wave subdivides as a five, and looks like a diagonal. Which means I would expect it to move lower before it is done.