
Yesterday’s analysis expected a little more upwards movement to a short term target at 1,612. This did not happen, but although price moved lower it has remained above the invalidation point on the hourly chart.
I am adjusting the wave count on the hourly chart because we have failed to see further upwards movement with an increase in momentum.
Click on the charts below to enlarge.
We should always assume that the trend remains the same, until proven otherwise. We should expect the upwards trend to continue until we have confirmation there has been a trend change.
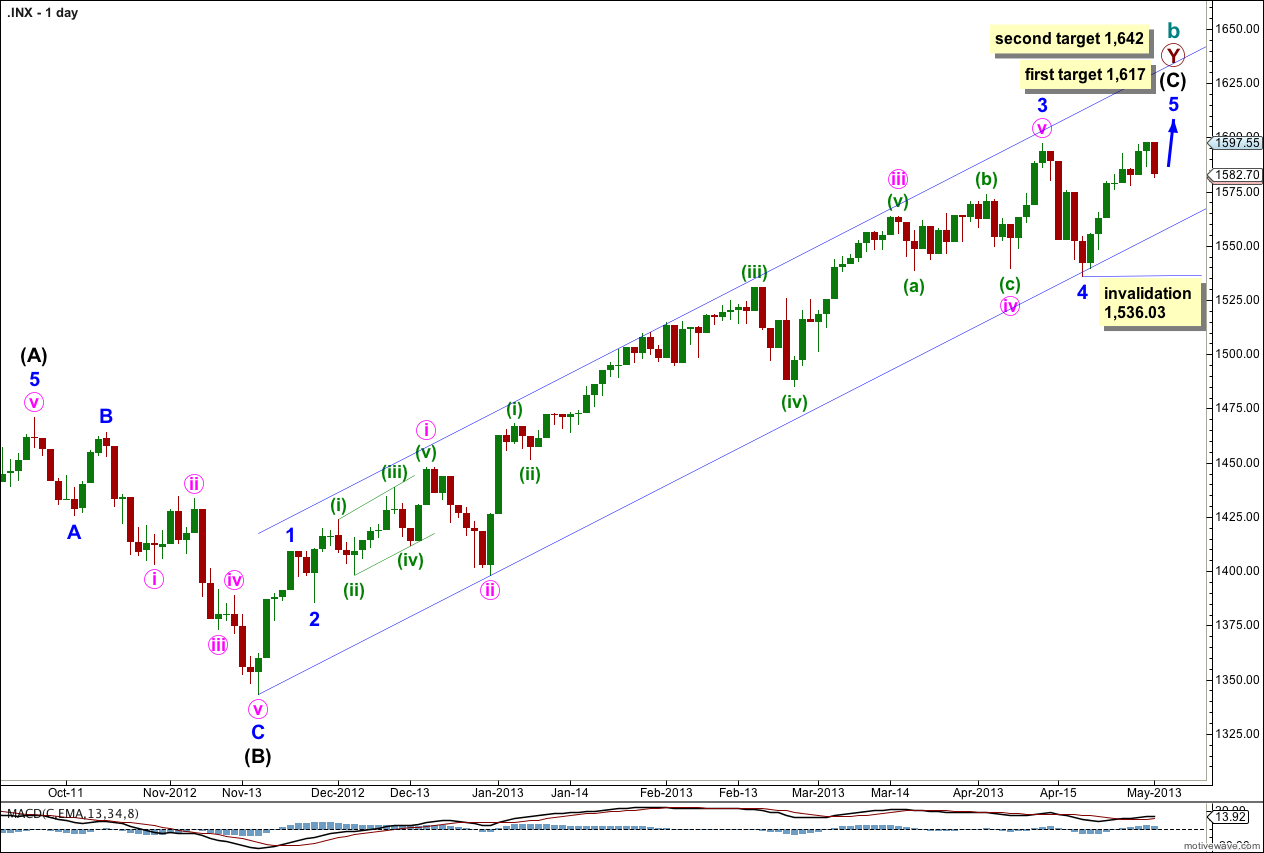
Draw a channel about intermediate wave (C) here on the daily chart. Draw the first trend line from the start of intermediate wave (C) to the low of minute wave iii within minor wave 3. Place a parallel copy to contain all this upwards movement. So far this channel shows very closely where price is finding support and resistance and should continue to do so.
The wave count within minor wave 3 too fits with MACD as an indicator of momentum. The strongest piece of upwards movement within intermediate wave (C) corresponds to the middle of a third wave.
Within intermediate wave (C) minor wave 4 is over and minor wave 5 is underway. Because there is no Fibonacci ratio between minor waves 1 and 3 I would expect to see a ratio for minor wave 5.
Looking at the structure of minor wave 5 on the hourly chart it looks like it may be longer than equality with minor wave 1. The next expected ratio would be at 1,617 where minor wave 5 would reach 0.382 the length of minor wave 1. If price continues upwards through this first target the next target is at 1,642 where minor wave 5 would reach 1.618 the length of minor wave 1.
Within minor wave 5 no second wave correction may move beyond the start of its first wave. This wave count is invalidated with movement below 1,536.03.
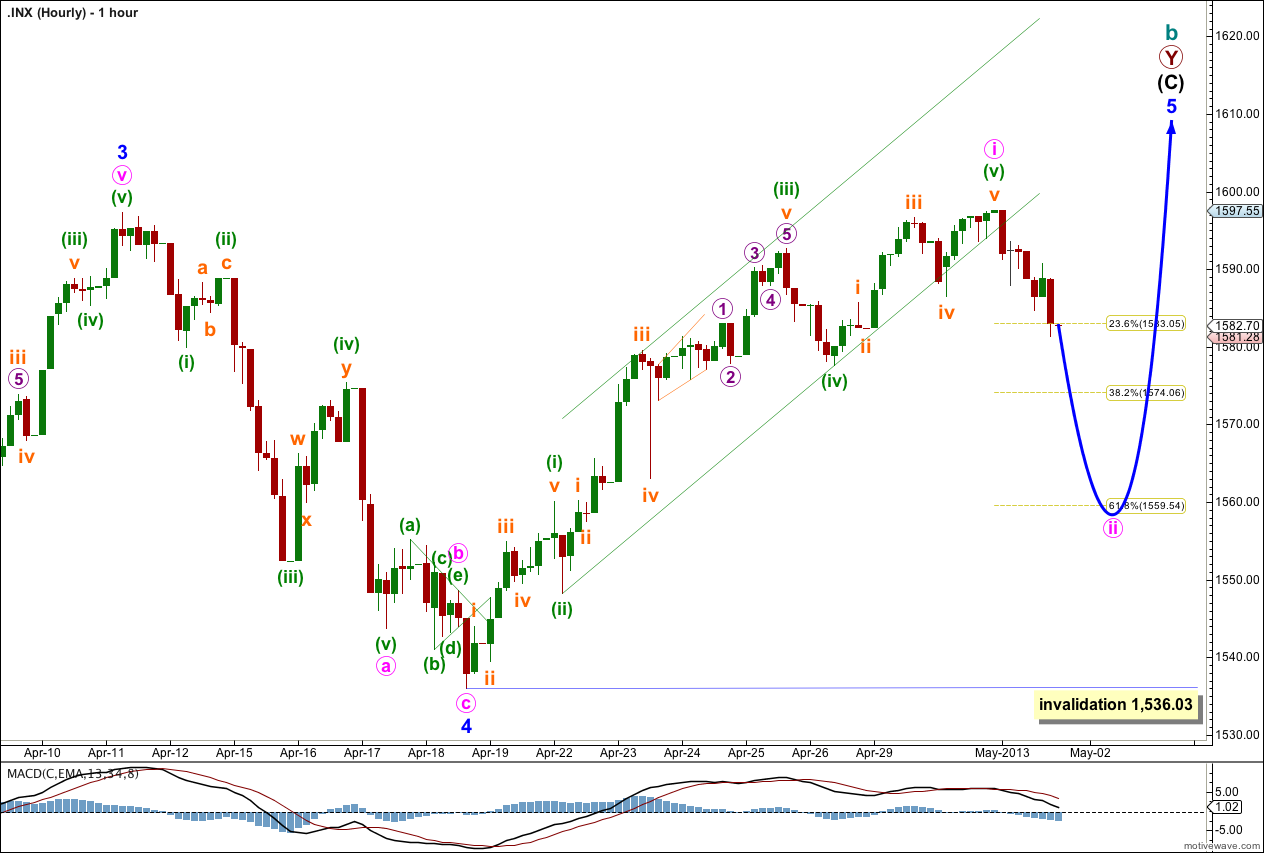
Within minor wave 5 minute wave i may have just recently completed. This entire movement can be seen as subdividing into a complete five wave impulse with the third wave corresponding to the strongest part of this movement. This fits with MACD.
Within minute wave i there are no adequate Fibonacci ratios between minuette waves (i), (iii) and (v).
Ratios within minuette wave (v) are: subminuette wave iii is 1.28 points longer than 1.618 the length of subminuette wave i, and subminuette wave v has no Fibonacci ratio to either of subminuette waves i or iii.
A parallel channel drawn around the impulse of minute wave i using Elliott’s second technique is clearly breached by downwards movement during Wednesday’s session. This channel breach indicates the upwards impulse is over and a downwards correction has begun. Minute wave ii may be expected to be most likely to reach down to the 0.618 Fibonacci ratio of minute wave i at 1,559.54. When there is more structure within minute wave ii I will use the ratio between minuette waves (a) and (c) within it to calculate a target. I may be able to do that for you tomorrow.
Minute wave ii may not move beyond the start of minute wave i. This wave count is invalidated with movement below 1,536.03.
If this wave count is invalidated with downwards movement in the next few days I would consider the alternate possibility below.
Alternate Wave Count.
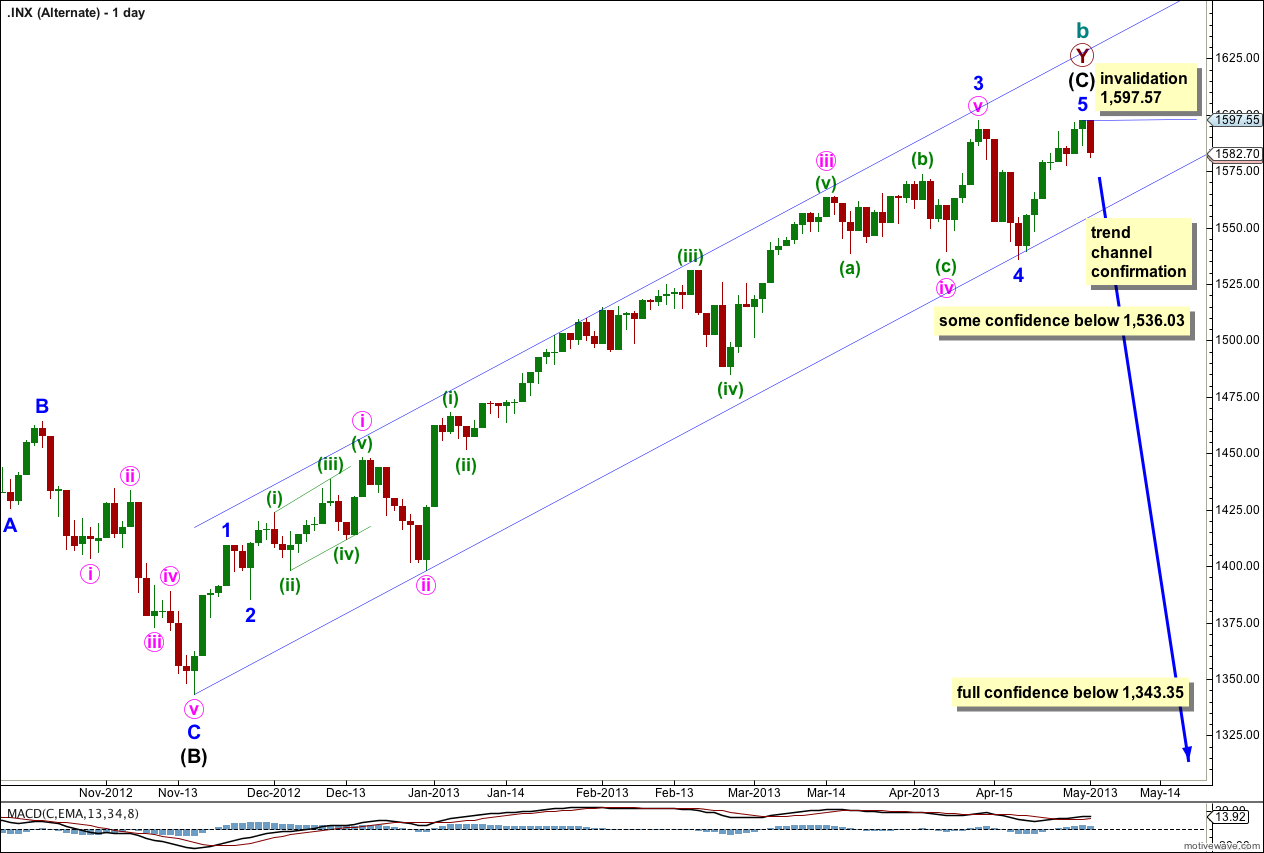
Again, it is possible for this entire structure for cycle wave b to be complete. Within minor wave 5 we have a completed five wave impulse.
Intermediate wave (C) would be just 9.37 points longer than 0.618 the length of intermediate wave (A).
Ratios within intermediate wave (C) are: there is no Fibonacci ratio between minor waves 3 and 1, and minor wave 5 is just 4.27 points short of equality with minor wave 1.
Ratios within minor wave 3 are: minute wave iii is just 1.4 points longer than 2.618 the length of minute wave i, and minute wave v is 4.72 points short of equality with minute wave i.
We need to see a full daily candlestick below this channel and not touching the lower trend line before we may have any confidence whatsoever in a trend change. Movement below 1,536.03 would invalidate the main wave count and provide some confirmation of this alternate.
This is a trend change at cycle degree. The new downwards trend for cycle wave c would be expected to last one to several years and take price substantially below 666.76. Waiting for confirmation of this trend change before having confidence in this alternate wave count is a wise idea.
Any movement above 1,597.57 would immediately invalidate this wave count.
Hello,Lara
In the hourly Chart.
The primary 1,2,3,4,and 5 can be within(contained in) a subminutte wave v ?
Can you explain?,please
That’s not primary degree, that’s micro degree.
Primary is maroon and bigger, micro is purple and smaller.
On the right hand sidebar of this site you will find a .pdf file with colours, degrees and labeling examples. Print it out to use as a quick reference.
Do you have a wave count with the market going over 1700??
Yes, in the historical analysis, here.