
Updated monthly charts are below.
I have changed the main monthly wave count from a double flat to a single flat. This has a much better fit for the upwards movement from the low at 666.79.
The two alternate monthly wave counts remain the same. The expanding triangle expects mostly the same movement next as does the main monthly wave count. The second alternate, a new bull market, requires an increase in upwards momentum to be seen very soon.
Click on the charts below to enlarge.
Main Monthly Wave Count.
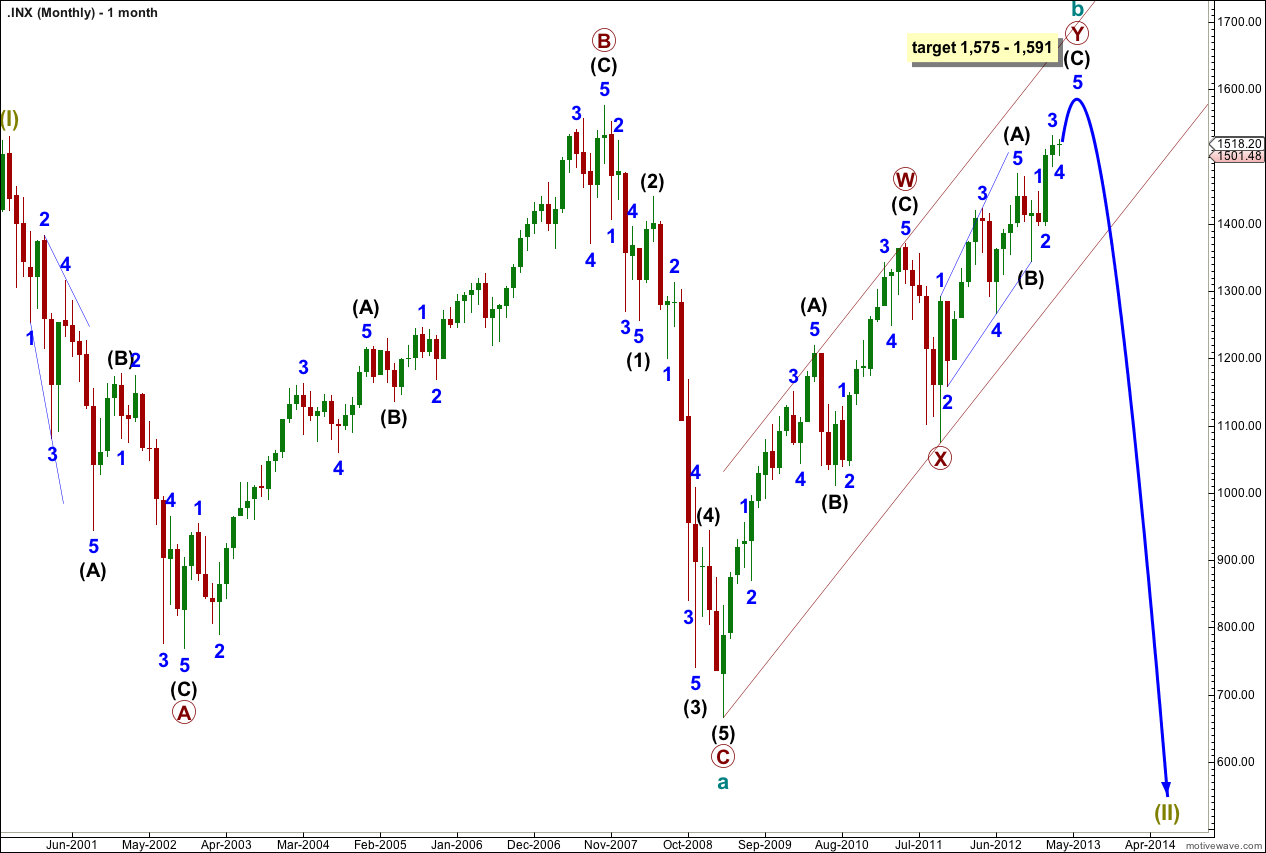
The last monthly wave count looked at a double flat unfolding for super cycle wave (II). I have changed the wave count to see a single flat unfolding. I have also moved all labeling down one degree.
This means upwards movement from the low of 666.79 is not an X wave but a B wave, which may subdivide into a multiple.
Within the flat cycle wave a is complete as a three wave structure, an expanded flat correction.
Cycle wave b is an incomplete double zigzag. It passed the minimum required length for a B wave of a flat at 90% of the A wave at 1,444.
If this structure at super cycle degree is an expanded flat then cycle wave b should reach 105% the length of cycle wave a at 1,573.
At 1,573 minor wave 5 within intermediate wave (C) would reach 0.618 the length of minor wave 3.
At 1,590 intermediate wave (C) would reach 0.618 the length of intermediate wave (A).
At 1,591 minor wave 5 within intermediate wave (C) would reach 1.618 the length of minor wave 1.
The first target will be about 1,573. If price continues higher through that target then the next likely target will be about 1,590.
When the channel drawn about this double zigzag is breached on the monthly chart we shall have confirmation at cycle degree of a trend change. Cycle wave c is likely to be about 1,232 (edit: not 1,397) points in length and should last one to several years.
Movement below 1,343.75 (the end of intermediate wave (B) within primary wave Y) would be an early price indication of a trend change.
The trend change may yet be a few weeks away.
Alternate Monthly Wave Count.
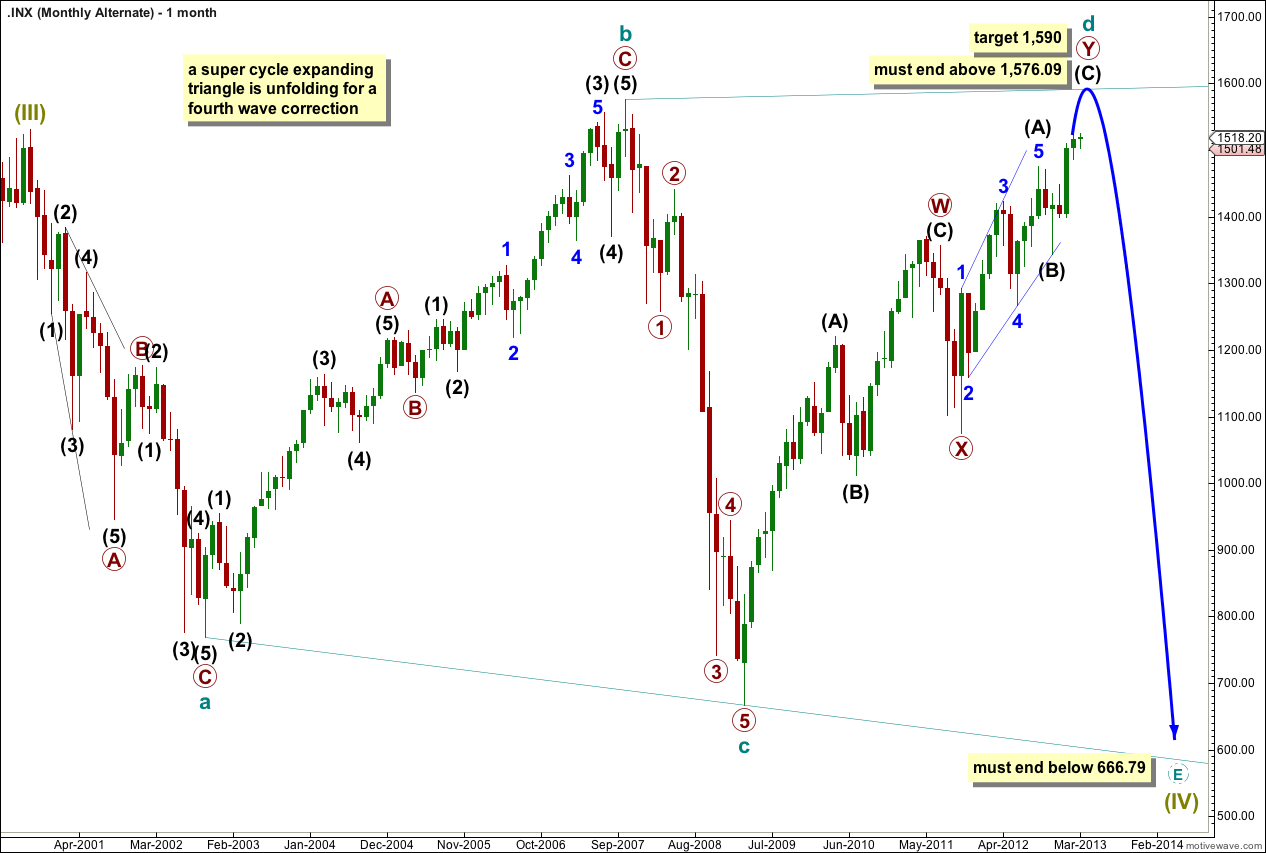
Expanding triangles are the rarest of all Elliott wave structures. This reduces the probability of this wave count. However, at this stage this alternate expects the same movement next, the target is the same and the invalidation points are the same as the main monthly wave count above. The difference is in the structure of the next bear wave down; the main wave count expects a five wave structure this alternate expects a zigzag.
At super cycle degree this wave count sees an expanding triangle unfolding. Within the triangle cycle wave d is unfolding as a longer lasting and more complicated double zigzag structure.
Within this double zigzag the second zigzag labeled primary wave Y is incomplete.
Within primary wave Y wave (C) black is incomplete.
The triangle is expanding because cycle wave c ended below the low of cycle wave a. Within an expanding triangle wave d must move beyond the end of wave b, so cycle wave d must make a new all time high above 1,576.09.
When cycle wave d is complete then cycle wave e should crash to new lows. Cycle wave e must move price below the end of cycle wave c at 666.79.
To the downside within wave (C) black no second wave correction may move beyond the start of its first wave. This wave count is invalidated with movement below 1,343.35 in the short term, prior to a new high.
Second Alternate Monthly Wave Count.
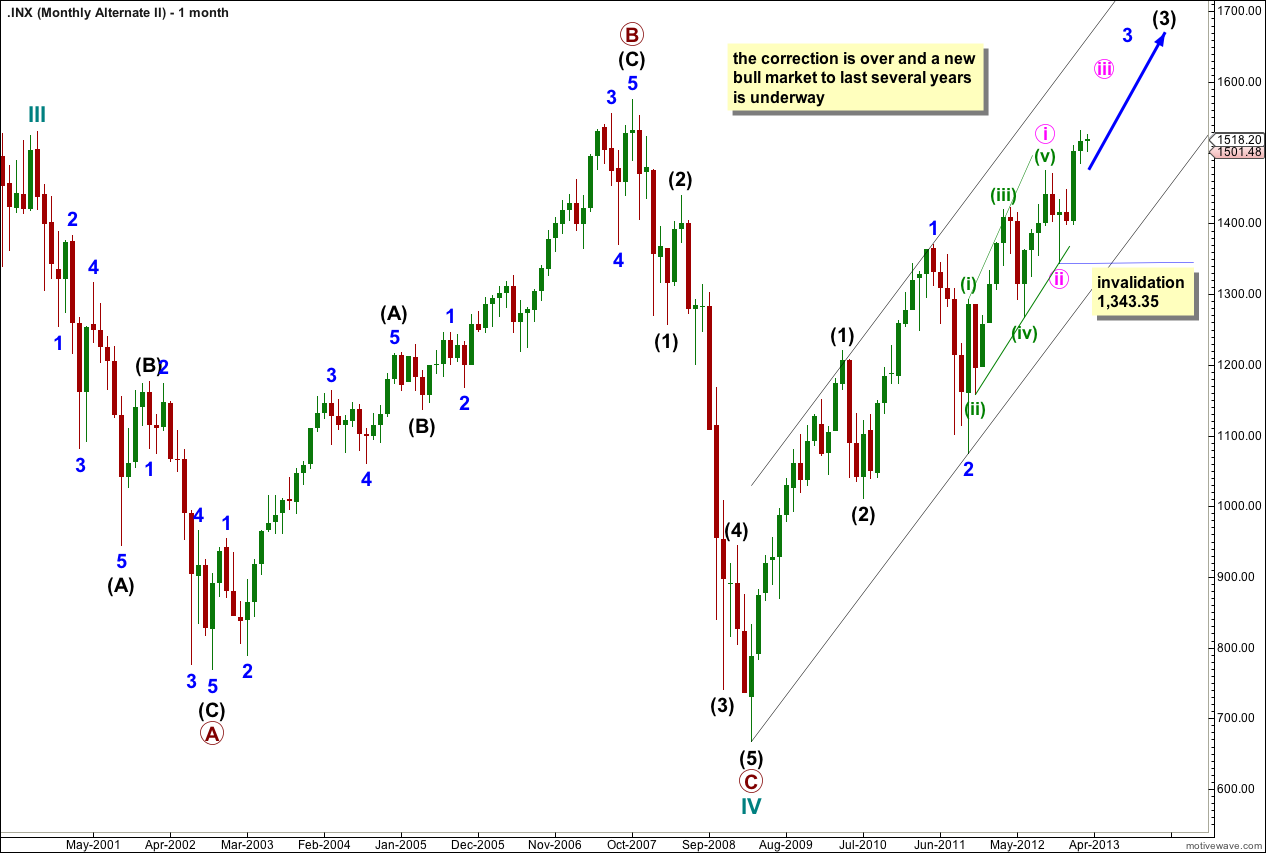
For this second alternate I have moved everything down one degree.
It is possible that the correction ended at the end of the “credit crunch” and the S&P 500 is in a new bull market to last several years.
This wave count does not so far have the right look though. There is so much overlapping in the new upwards trend and the proportions of minor waves 1 and 2 are greater then intermediate (black) waves (1) and (2) of one degree higher. However, this is entirely possible and no rules are broken. It just looks odd.
If this wave count is correct then the S&P 500 is getting ready for some very strong upwards movement as the middle of a third wave begins. A series of overlapping first and second waves is like a coiled up spring; potential energy is released when the third wave unfolds. It should be explosive.
Within minor wave 3 black minute wave i may have been a leading diagonal. However, within this diagonal wave v pink is too short. The diagonal is expanding so wave v pink should be longer than wave iii pink but it is not. The third wave is the longest. This reduces the probability of this wave count.
Within minute wave iii no second wave correction may move beyond the start of its first wave. This wave count is invalidated with movement below 1,343.35.
Lara,
I really enjoy the clarity of your wave count and presentation. Keep it up!
Madhan
Thank you!
Wow. That is still a spectacular drop. I have already begun to position myself for a significant drop, but this is beyond even what I had imagined.
Yes, true.
Still, I’m simply basing this prediction on structure. Expanded flats are the most common type.
If this upwards trend reaches 1,573 then the structure at super cycle degree may be an expanded flat, because then cycle wave b would be 105% the length of cycle wave a. At that stage I would have more confidence in calling for a cycle degree c wave to be about 1,232 points in length.
A huge drop like that would fit with social mood. The Middle East is still in revolution, Europe is experiencing huge unemployment and riots and the United States also has very high unemployment. It looks like social mood is very negative, and could get worse before it gets better.
Lara,
Is that correct that cycle wave (c) for your main wave count has a target length of 1397? That would imply a low for the S&P of around 200.
Thanks,
Peter
I’ve made an error in my calculation. I would expect cycle wave c to be 1,232 points in length.
If cycle wave b ended at 1,591 that would mean cycle wave c may end about 359.
If cycle wave b ended at 1,575 that would mean cycle wave c may end about 343.