
Last analysis of AAPL expected upwards movement to a short term target at 441. This is not what we have seen as price moved lower to slightly breach the invalidation point at 419.68 by 0.13.
However, price has remained above 419 (so far) and so this wave count remains valid.
Click on the charts below to enlarge.
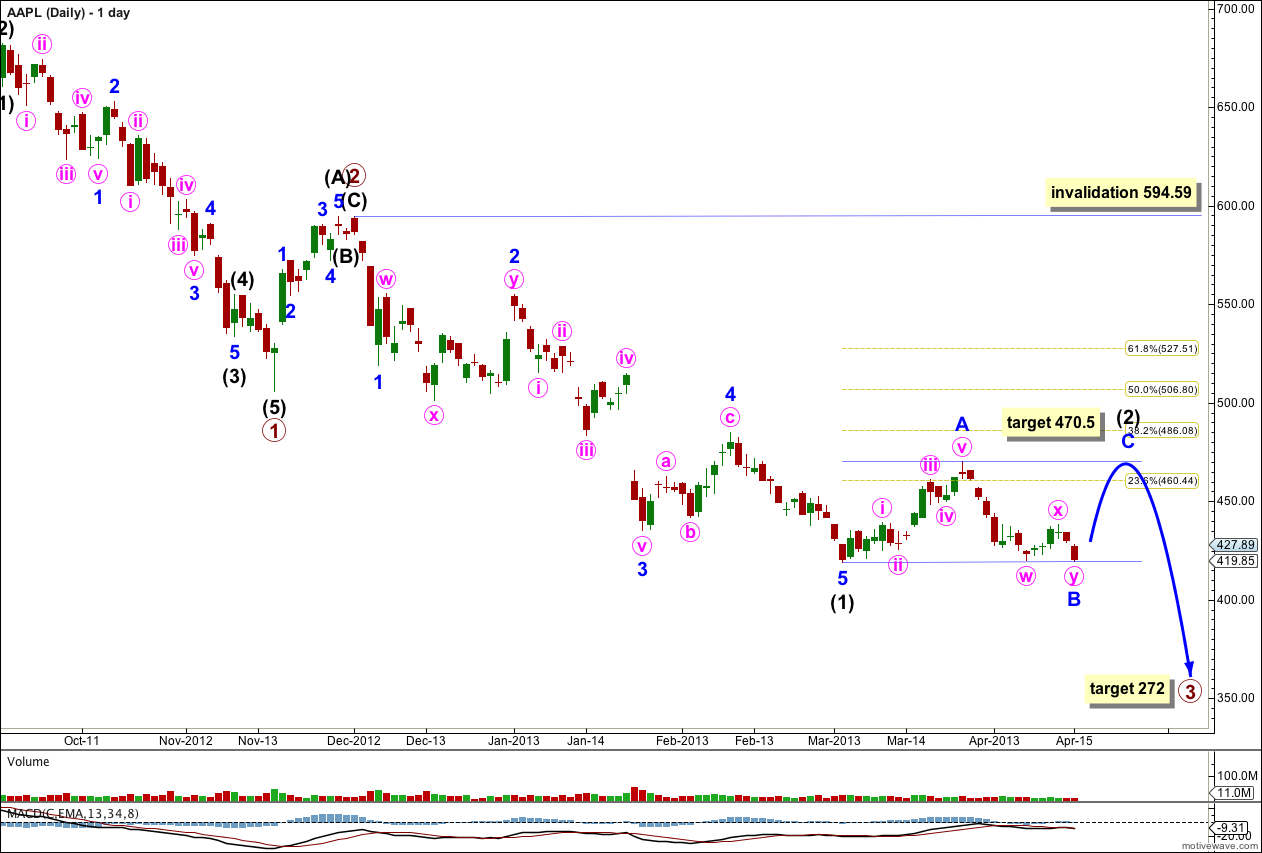
This main wave count expects a five wave impulse for a cycle degree wave a is unfolding to the downside. Within the impulse primary waves 1 and 2 are complete. Primary wave 3 may be extending. Within primary wave 3 intermediate wave (1) is a complete five wave structure and intermediate wave (2) is unfolding.
Within intermediate wave (2) minor waves A and B are now most likely complete. At 470.5 minor wave C would reach equality in length of minor wave A.
Intermediate wave (2) may not move beyond the start of intermediate wave (1). This main daily wave count is invalidated with movement above 594.59. If price moves above this point then we may use the alternate wave count below.
At 272 primary wave 3 would reach 1.618 the length of primary wave 1. This long term target is months away.
Draw a parallel channel about intermediate wave (2). Draw the first trend line from the start of minor wave A to the end of minor wave B, then place a parallel copy upon the high of minor wave A. Minor wave C may reach equality with minor wave A and price would find resistance at the upper end of this channel.
When the zigzag for intermediate wave (2) may be seen as complete then subsequent movement below the channel would confirm that the next wave, intermediate wave (3), would be underway.
If the hourly wave count is invalidated by downwards movement below 419 then it may be possible that intermediate wave (2) is over and intermediate wave (3) may be underway.
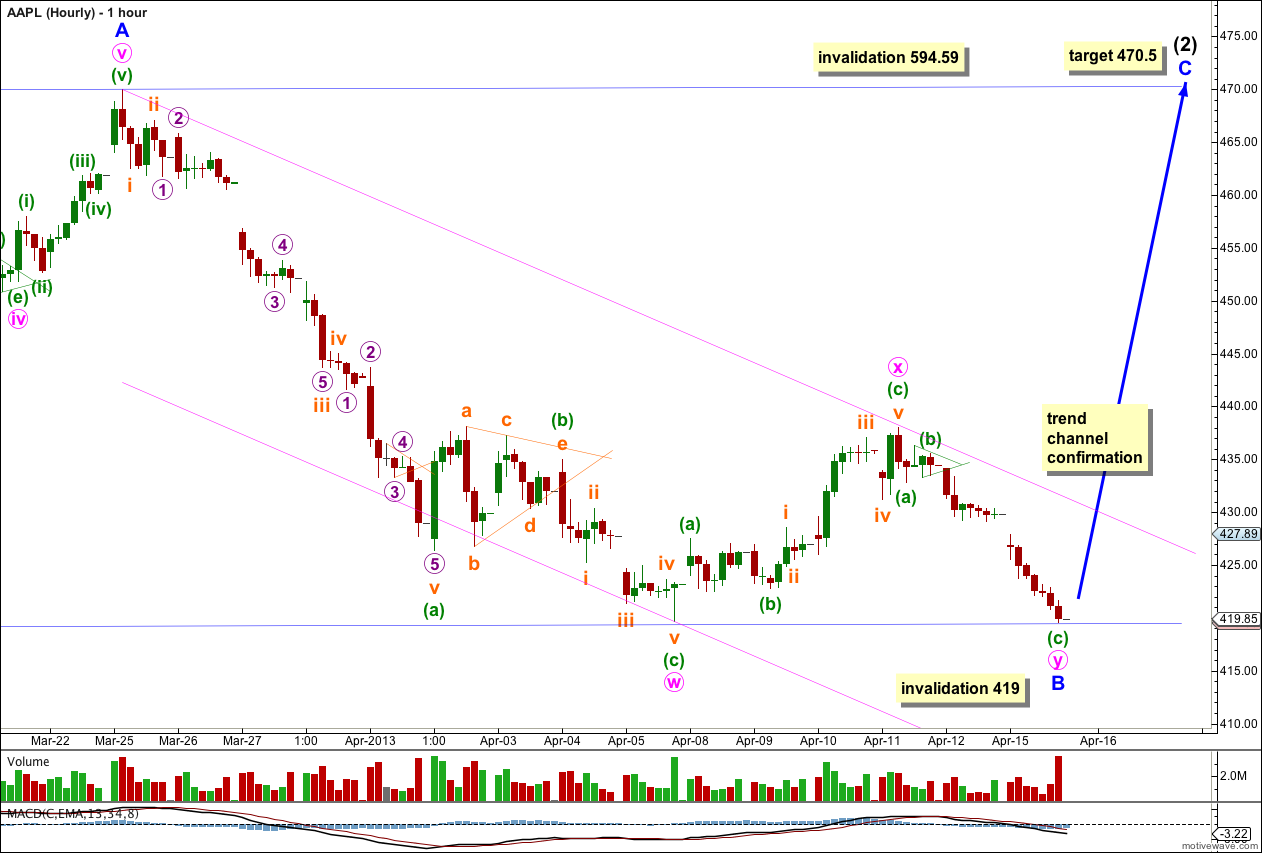
With the last low labeled minor wave B being slightly lower than the previous low labeled minute wave w, it is clear that minor wave B may have extended further sideways.
The structure subdivides as a double zigzag, but has not really achieved the purpose of a double zigzag which is to deepen a correction when the first zigzag did not move far enough. Within the second zigzag the triangle completed but was a B wave, not a fourth wave as last analysis expected.
There is no Fibonacci ratio between minuette waves (a) and (b) within minute wave y.
Minor wave B has no room left to move in. It may not move beyond the start of minor wave A below 419. If this wave count is invalidated with downwards movement expect it to be a third wave down.
This wave count sees the probability of a new five wave structure upwards as likely. Minor wave C is likely to make a new high above the end of minor wave A at 469.95 to avoid a truncation.
Alternate Daily Wave Count.
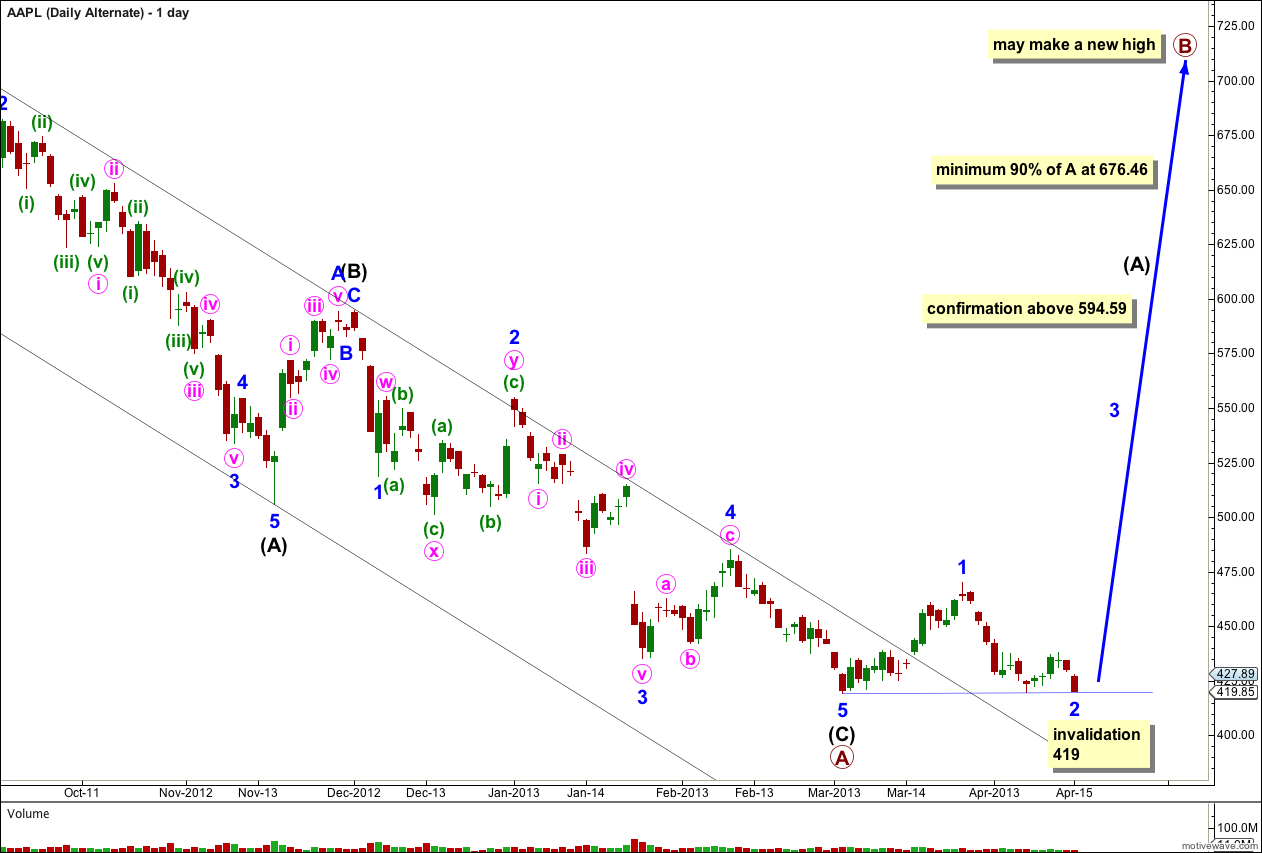
If the main daily wave count is invalidated with upwards movement above 594.59 then this alternate would be confirmed.
If cycle wave a is subdividing into a three wave structure then within it primary wave A may be a complete zigzag. Cycle wave a may be unfolding as a flat correction.
Within primary wave A intermediate waves (A) and (C) have no Fibonacci ratio to each other.
The parallel channel drawn here using Elliott’s technique about a correction is clearly breached by upwards movement. The downwards zigzag is over and an upwards trend has begun.
Within primary wave B minor wave 2 may not move beyond the start of minor wave 1. This wave count is firmly invalidated with movement below 419.
Primary wave B must subdivide into a three wave structure, most likely a zigzag.
If cycle wave a is a flat correction then primary wave B must reach at least 90% the length of primary wave A at 676.46.
Primary wave B may make a new high above 705.07. Primary wave B should last about six months.
Lara,
would you still expect a large primary wave (B) correction upwards if your alternate count on the S&P i.e. to go down big time, was valid?
Yep.
Look at monthly charts of AAPL and SPX side by side. Since September 2012 AAPL has moved lower while SPX has moved higher. They do not necessarily move together. The monthly charts for these markets look quite different. The wave counts are very different.
I approach these markets from a pure Elliott wave perspective; I assume each market stands alone and I don’t consider one when I’m analysing the other.
Wasn’t 507 your most recent short term upside target? I don’t recall 441
441 was the short term target from the previous analysis. I try to give short term targets when I can, which should be reached in one to three sessions, when my longer term targets are weeks away.
Understood Lara. Tyvm