
“They” say that Apple is a market leader. I’m curious to see if this is the case. I’ve decided to offer members and visitors to this site regular (once or twice a week) analysis of AAPL.
This is my first wave count. Over the next few days I’ll look at alternates.
This is what I saw first. I began my wave count at July 1982.
Overall I noticed some remarkably close Fibonacci ratios. Within each impulse I analysed I found at least one Fibonacci ratio between the three actionary waves. Within the two corrective waves I analysed for Fibonacci ratios I found a ratio for each.
The structures also seem to sit nicely within trend channels.
Overall Apple seems to conform very well to Elliott wave structures and behaves typically.
Click on the charts below to enlarge.
Monthly.
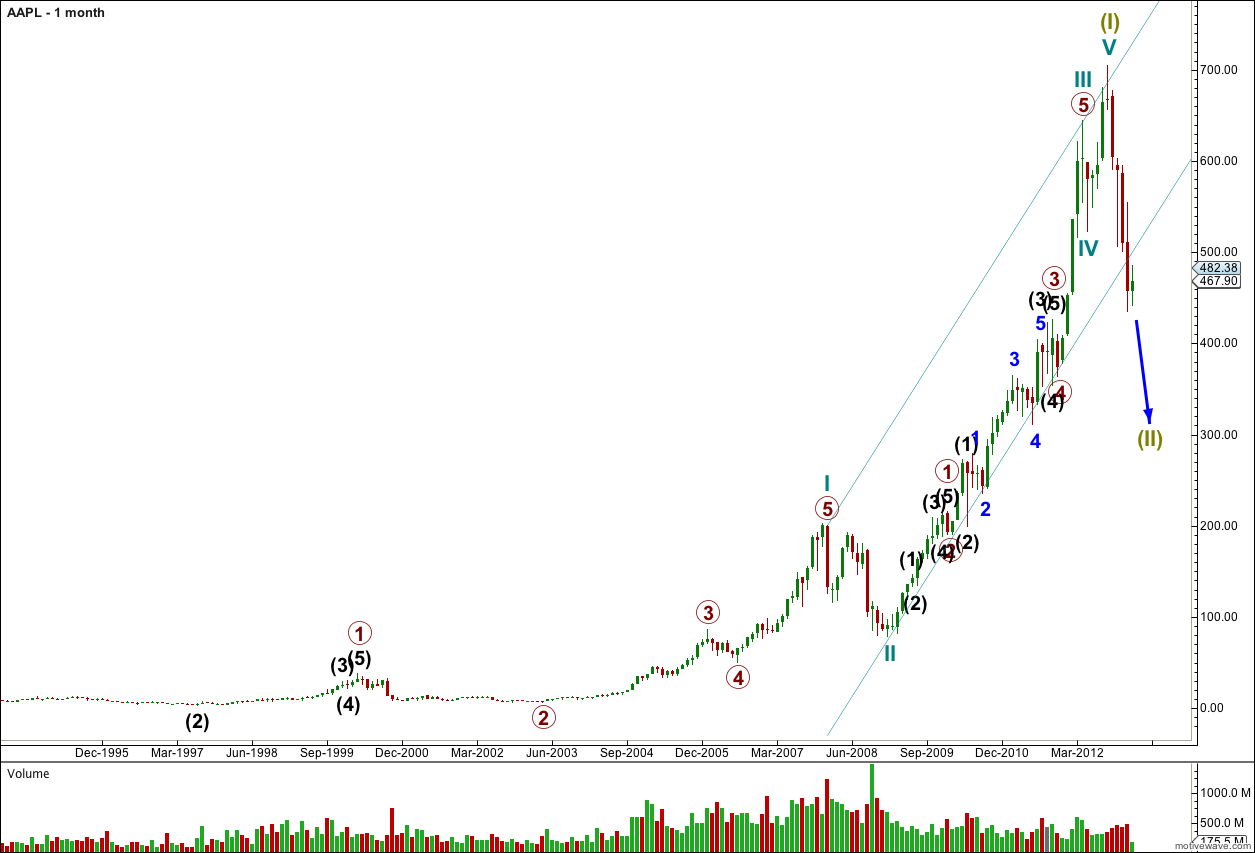
From 1982 to September 2012 Apple saw a significant rise. This looks like a nice impulse structure.
The drop from September 2012 to the current date is significant and may be a correction at super cycle degree.
Within super cycle wave (I) (olive green) ratios are: cycle wave III is 44.53 points short of 2.618 the length of cycle wave I (this is a 7.9% variation which is acceptable), and cycle wave (V) is 16.22 points short of equality with cycle wave (I).
So far within super cycle wave II the structure is incomplete. Overall over the next several months to couple of years I would expect to see new lows for Apple, but there is a B wave yet to come which may also make a new high. The weekly chart focuses on the structure of the end to super cycle wave I, and the daily chart focuses on the structure of super cycle wave II.
When we use Elliott’s channeling technique to draw a channel about this impulse for super cycle wave (I) the last monthly candlestick clearly breaches the channel. This indicates that the new downwards trend may be a large correction of the upwards trend from the 1980’s.
The channel is drawn first with a trend line from the highs of cycle waves I to III, then a parallel copy is placed upon the low of cycle wave II.
Weekly.
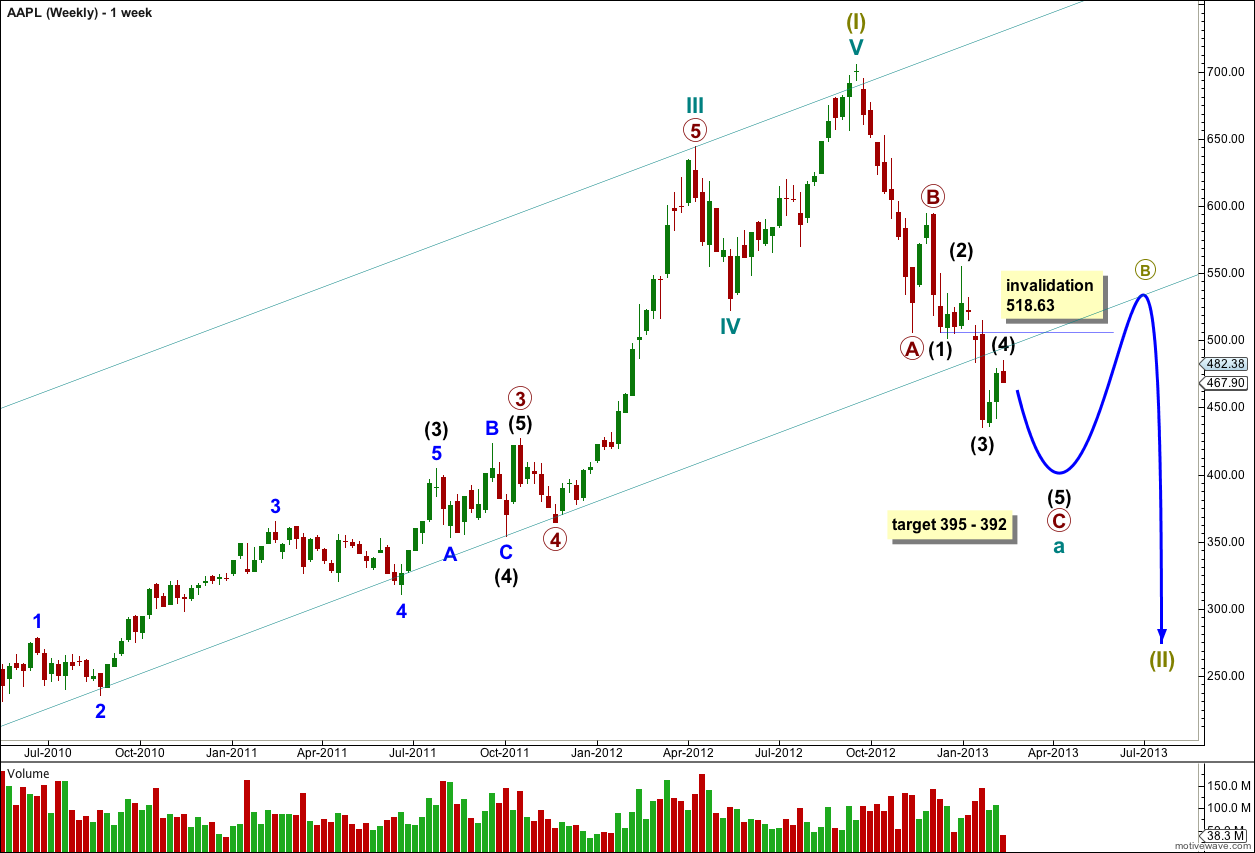
This weekly chart shows the end of super cycle wave (I) and the start of super cycle wave (II).
Within super cycle wave (I) ratios within cycle wave III (teal green) are: primary wave 3 (maroon) is 14.15 points longer than 1.618 the length of primary wave 1, and primary wave 5 has no Fibonacci ratio to primary waves 3 or 1.
Ratios within primary wave 3 are: intermediate wave (3) (black) is just 9.97 points longer than 2.618 the length of intermediate wave (1), and intermediate wave is 5.94 points short of 0.382 the length of intermediate wave (3).
Ratios within intermediate wave (3) are: minor wave 3 (blue) is just 0.29 points longer than 1.618 the length of minor wave 1, and minor wave 5 has no Fibonacci ratio to either of minor waves 1 or 3.
Within super cycle wave (II) cycle wave a is incomplete. So far it looks like it may be unfolding as a zigzag structure with primary waves A and B complete. The subdivisions of primary wave C are better seen on the daily chart below.
Daily.
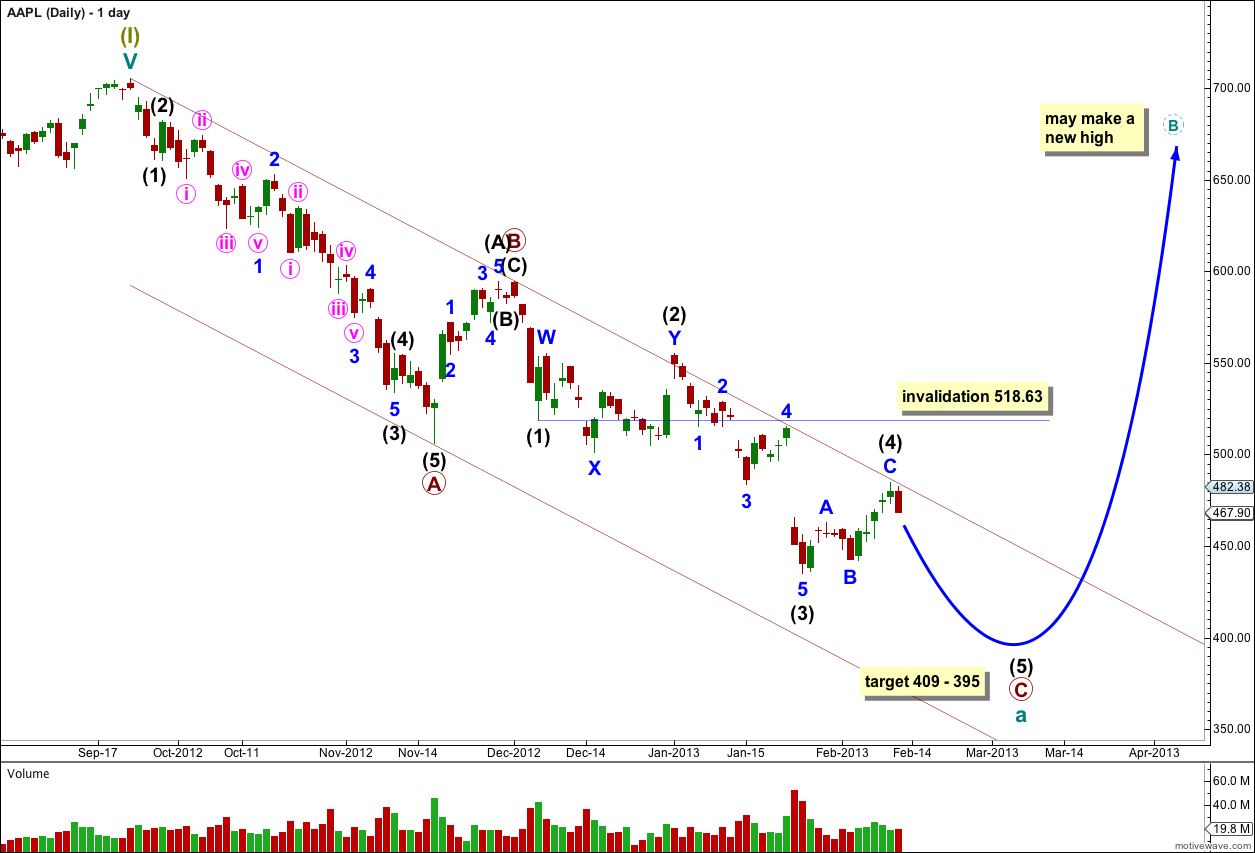
Within super cycle wave (II) cycle wave a may be unfolding as a zigzag with primary waves A and B complete. Primary wave C is an incomplete structure and requires more downwards movement.
Ratios within primary wave A are: intermediate wave (1) has no Fibonacci ratio to intermediate wave (3), and intermediate wave (5) is just 4.88 points longer then equality with intermediate wave (1).
Ratios within intermediate wave (3) are: minor wave 3 has no Fibonacci ratio to minor wave 1, and minor wave 5 is just 1.3 points short of equality with minor wave 1.
Ratios within minor wave 1 within intermediate wave (3) are: minute wave iii (pink) is just 0.3 points short of 1.618 the length of minute wave i, and minute wave v has no Fibonacci ratio to either of minute waves i or iii.
Ratios within minor wave 3 or intermediate wave (3) are: minute wave iii is 4.51 points longer than equality with minute wave i, and minute wave v is 1.22 points short of 0.618 the length of minute wave iii.
Within primary wave B intermediate wave (C) is 1.01 points short of 0.146 the length of intermediate wave (A).
Ratios within intermediate wave (A) are: minor wave 3 has no Fibonacci ratio to minor wave 1, and minor wave 5 is just 0.16 points short of 0.618 the length of minor wave 3.
Within primary wave C intermediate wave (3) is just 2.9 points short of 1.618 the length of intermediate wave (1).
Within intermediate wave (4) of primary wave C minor wave C is 1.72 points short of 1.618 the length of minor wave A.
At 409 intermediate wave (5) would reach equality in length with intermediate wave (1).
At 395 primary wave C would reach equality in length with intermediate wave A.
I favour the lower end of this target because there is already a good Fibonacci ratio at intermediate degree.
Prior to the completion of intermediate wave (5) if price moves above 518.63 this wave count would be invalidated. Intermediate wave (4) may not move into intermediate wave (1) price territory.
Intermediate wave (5) does not have to make a new low below the end of intermediate wave (3) at 435, but is more likely to do so than not.
The channel I have drawn uses Elliott’s technique for a correction. The first trend line is drawn from the start of primary wave A to the end of primary wave B. A parallel copy is placed upon the end of primary wave A. So far price is nicely contained within this channel. Primary wave C may end about the lower edge of the channel. When the channel is breached by upwards movement then that will be an indicator that the zigzag for cycle wave a is complete and cycle wave b upwards has begun.
When cycle wave a is complete then I would expect a new upwards trend for cycle wave b which is fairly likely to make a new all time high.