
Movement above 1,422.38 has invalidated the main wave count and confirmed the alternate.
The situation is changed at intermediate degree. I will cover monthly and weekly charts today to take a step back and look at the bigger picture.
I have two wave counts at the monthly chart level which have quite different outcomes. The main wave count has a higher probability simply because it has a common structure while the alternate has a lower probability because it has the rarest Elliott wave structure.
Click on the charts below to enlarge.
Main Wave Count.
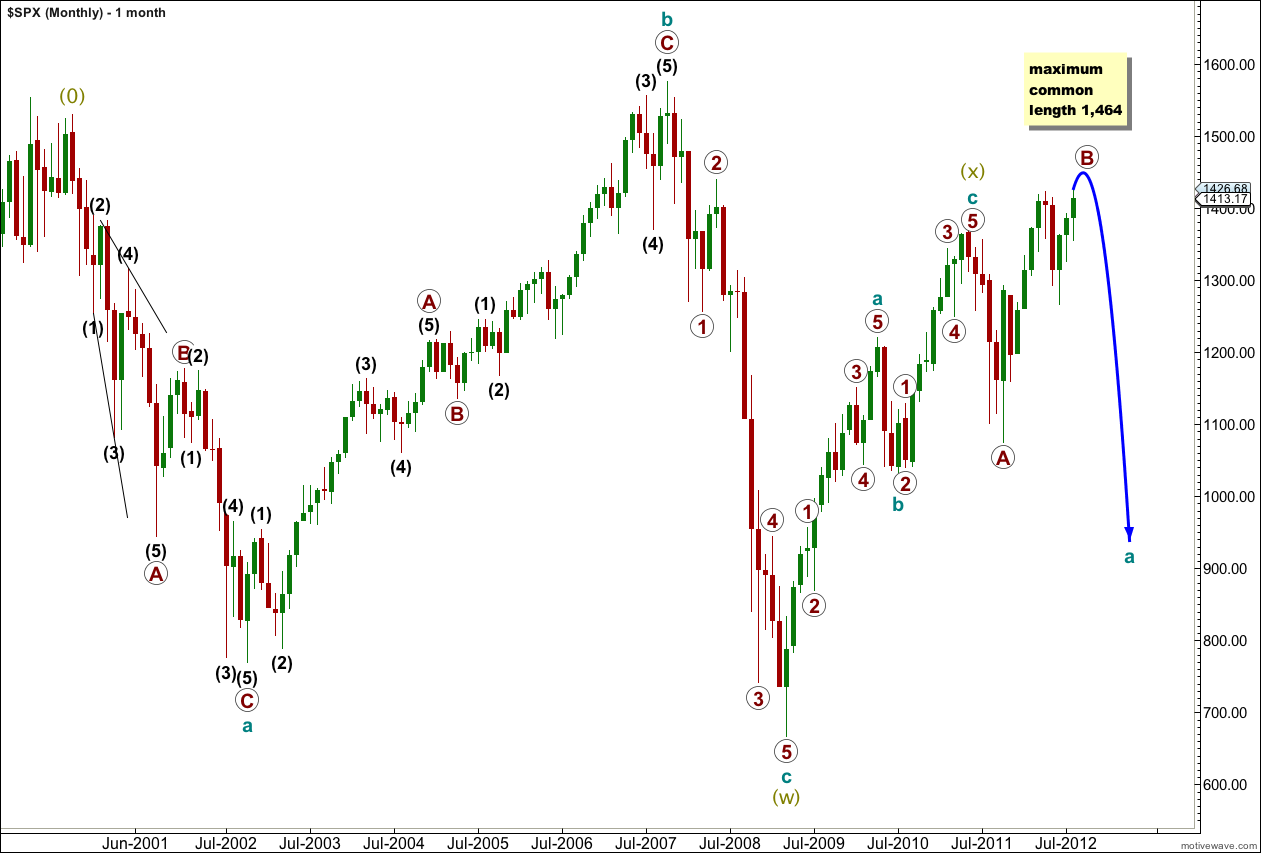
At grand super cycle degree this wave count looks at a double flat unfolding. Super cycle wave (w) (olive green) was a flat correction. Super cycle wave (x) was a zigzag (it cannot itself be a double or triple so it must have been over) and super cycle (y) is unfolding as a flat correction.
Within super cycle wave (y) cycle wave a (teal green) itself is incomplete and is unfolding as a flat correction.
Within cycle wave a (teal green) primary wave A was a zigzag. Primary wave B is unfolding as a very rare triple zigzag.
There is no upper invalidation point for primary wave B, but there is a maximum common length. Within a flat wave B is usually between 100% to 138% the length of wave A. Primary Wave B will reach 138% the length of primary wave A at 1.464.
If price rises above 1,464 this wave count would reduce in probability. At that stage I would use the alternate monthly wave count (the expanding triangle scenario) as the main wave count.
Interestingly, at the end of super cycle wave (x) the structure looks to be a larger fractal of the current structure. In super cycle wave (x) there was a truncated fifth wave, followed by a three down, and then price turned higher while we have just seen a truncated fifth wave on the last intermediate degree upwards movement labeled (Y) black, followed by a three down labeled (X) blue and now a new high.
Within primary wave B the first upwards wave labeled intermediate (W) can only be seen as a zigzag. It does not subdivide into a five. Therefore, the only structure which now fits for this wave count in this piece of movement is a very rare triple zigzag.
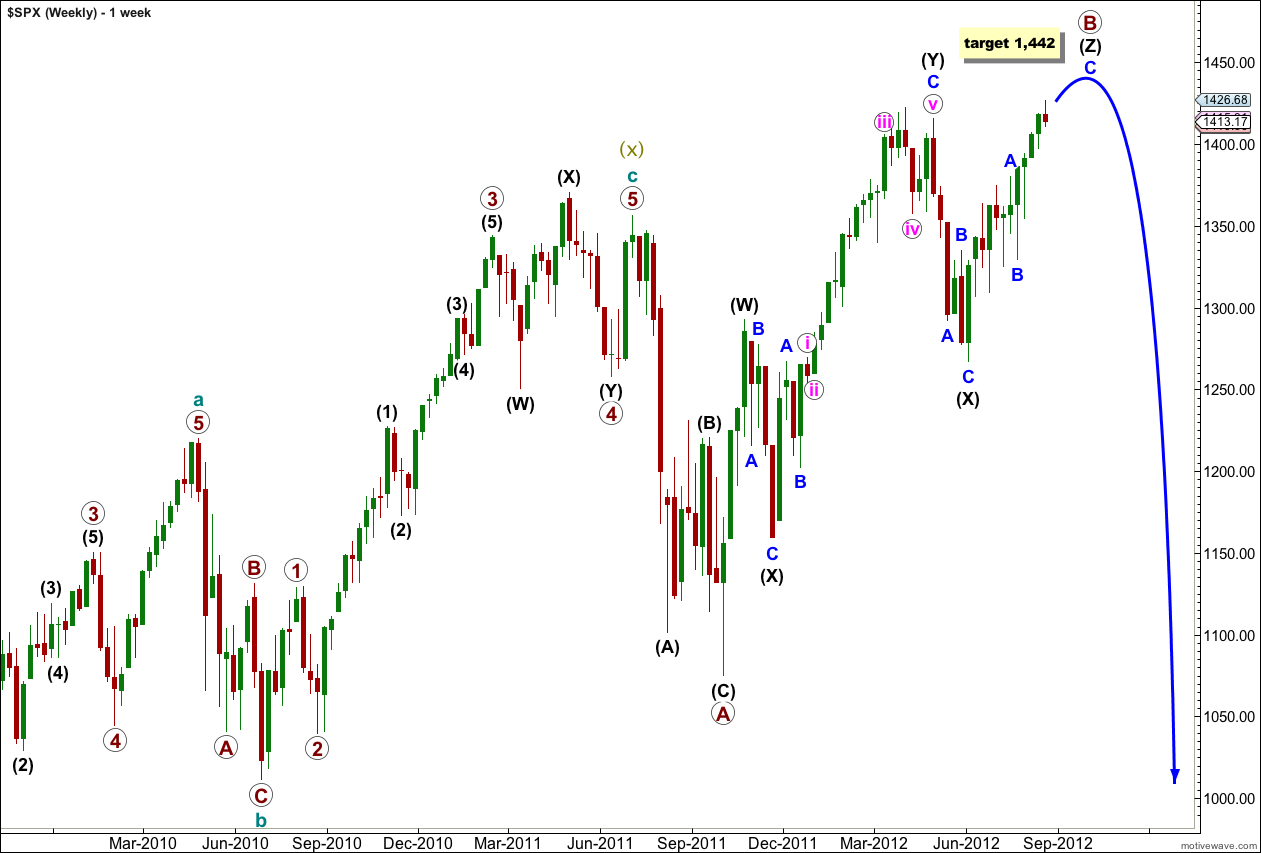
Within primary wave B the structure is now within the third and last zigzag upwards.
Within wave (Z) black waves A and B blue are complete. Wave C blue would reach equality with wave A blue at 1,442. This is our target now for upwards movement to end. It is probably at least two weeks away if not longer.
Within wave (Z) black wave A blue was a leading contracting diagonal. Wave B blue was a brief zigzag. Wave C blue is exhibiting alternation with wave A blue and unfolding as an impulse.
When the parallel channel about wave (Z) black is clearly breached by downwards movement then we shall have confirmation of a trend change.
Within wave C blue wave iv pink may not move into wave i pink price territory. This wave count is invalidated with movement below 1,391.74. If this wave count is invalidated with downwards movement then we may consider the alternate hourly wave count below.
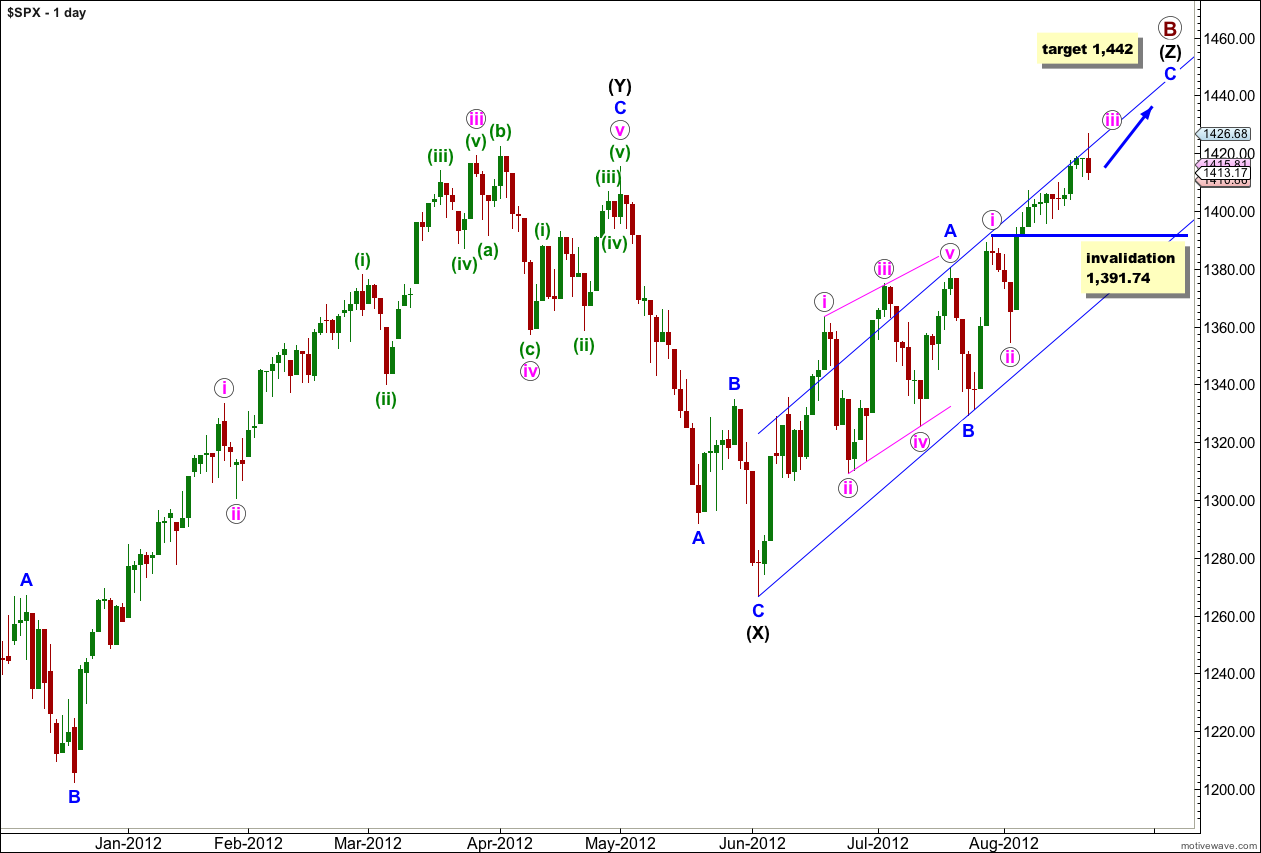
Within the structure of wave C blue we should see an increase in upwards momentum if this wave count is correct. At this stage MACD does not agree with this wave count as it should see the highest reading for the middle or end of the third wave and not diverge as seen here and on the 2 hourly chart. However, the structure does fit.
Within wave iii pink wave (iii) green may have ended yesterday and it is just 1.38 points short of 0.618 the length of wave (i) green.
Wave (ii) green was a combination correction and wave (iv) green may be exhibiting alternation as a zigzag.
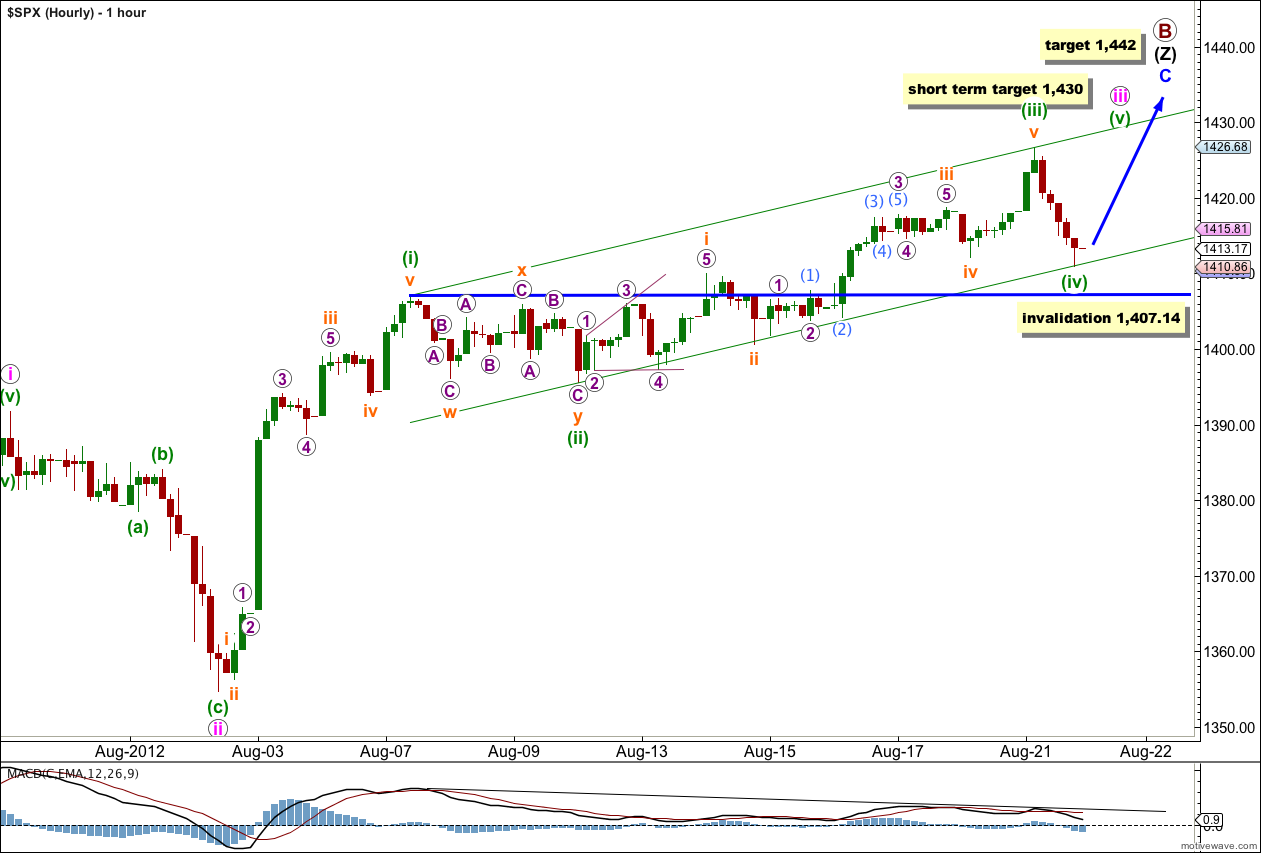
In the short term at 1,430 wave (v) green would reach 0.618 the length of wave (iii) green.
When markets open tomorrow any further downwards movement of wave (iv) green may not move into wave (i) green price territory. This wave count is invalidated with movement below 1,407.14.
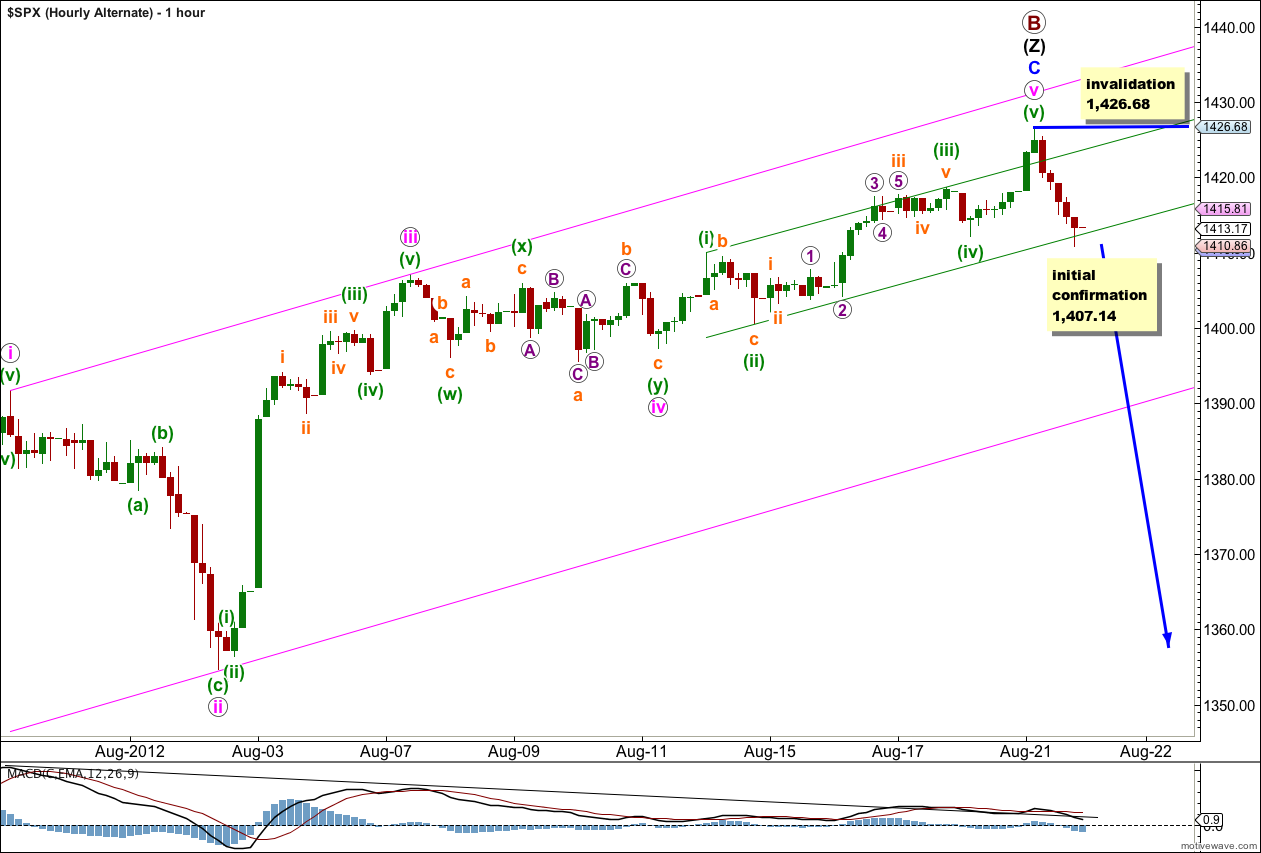
If price moves below 1,407.14 tomorrow then this wave count would increase slightly in probability. I would still want to wait for channel confirmation of a trend change though before having any confidence in it.
On the way up there will be multiple points at which the structure could be considered complete. It is always safest to assume that the trend remains the same, until proven otherwise. We must be aware that this wave count is possible, but we should assume the trend remains upwards until a change is confirmed.
This wave count also does not agree with MACD because the high of wave iii pink does not correspond to the strongest point on MACD.
Movement below the parallel channel here on this hourly chart would be a good early indicator that we may have had a trend change.
Alternate Wave Count.
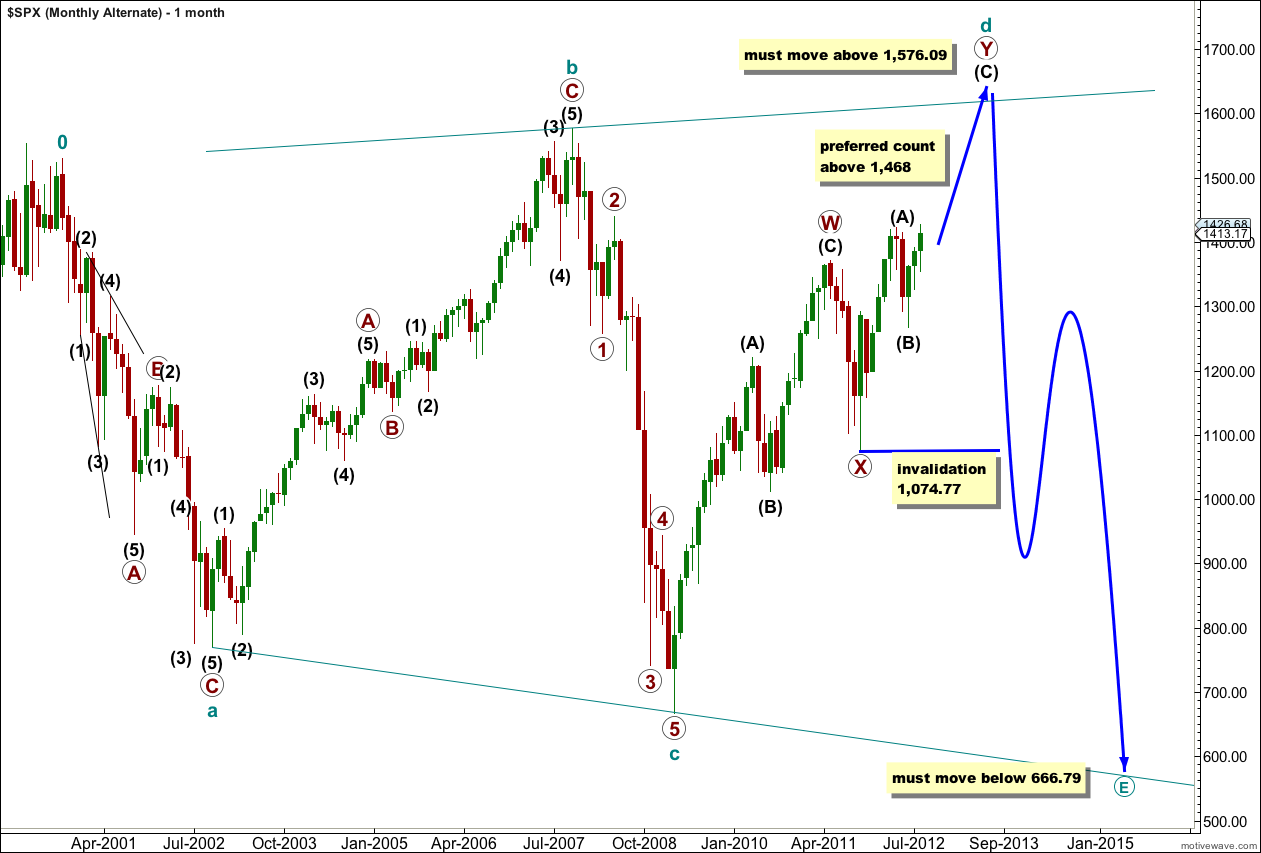
If price moves above 1,468 this wave count would become my preferred wave count. However, until that time it has an extremely low probability because expanding triangles are exceedingly rare structures.
Movement below 1,074.77 would invalidate this wave count.
Hi Lara
Just to say that a running of shorts above 1422 was hardly surprising nor was the (key?) reversal (day).
However i thought that generally divergence indicates a top / bottom. In addition MACD is “supposed” to be higher in a 3rd wave than a 5th ??
Yes, divergence generally does indicate a trend change ahead or imminent. That’s partly why I have the alternate hourly chart.
MACD is supposed to be higher in the third wave than both the first and fifth, which is why I suspect that the third wave may not be over and it’s possible we should see an increase in upwards momentum. It should show a stronger reading than the high of wave i pink. If this happens then there would obviously be no divergence anymore.
I’ve seen instances where this does not work though (especially within C waves) and so I would use MACD as an indicator of whether or not I’m on the right track for a wave count, but I would never use it as a definitive guide.
Thanks for reviewing the big picture. Nice analysis of options. Critical inflexion point!
You’re welcome!