
The S&P 500 has moved lower invalidating the main hourly chart and providing initial confirmation of the alternate. The main daily wave count remains valid. While price remains above the invalidation point on the daily chart we do not have confirmation of a trend change.
We still have the same wave counts at monthly chart level. To see a full analysis of the bigger picture see yesterday’s analysis here.
Click on the charts below to enlarge.
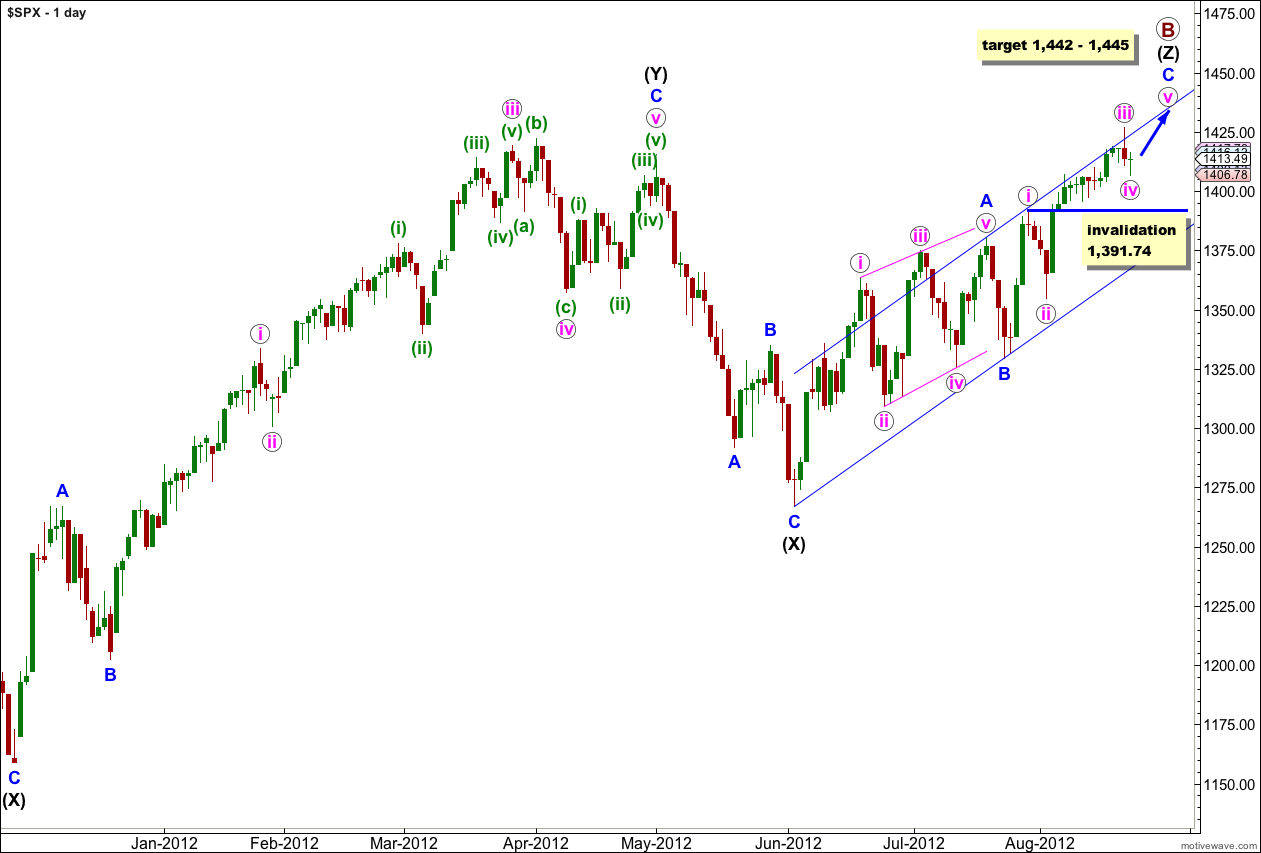
Price moved lower but has so far remained above 1,426.68. For the labeling on this daily chart it may be that downwards movement is a fourth wave correction.
Within wave (Z) black wave A blue was a leading contracting diagonal. Wave B blue was a brief zigzag. Wave C blue is exhibiting alternation with wave A blue and unfolding as an impulse.
When the parallel channel about wave (Z) black is clearly breached by downwards movement then we shall have confirmation of a trend change.
Within wave C blue wave iv pink may not move into wave i pink price territory. This wave count is invalidated with movement below 1,391.74. If this wave count is invalidated with downwards movement then we may consider the alternate hourly wave count below.
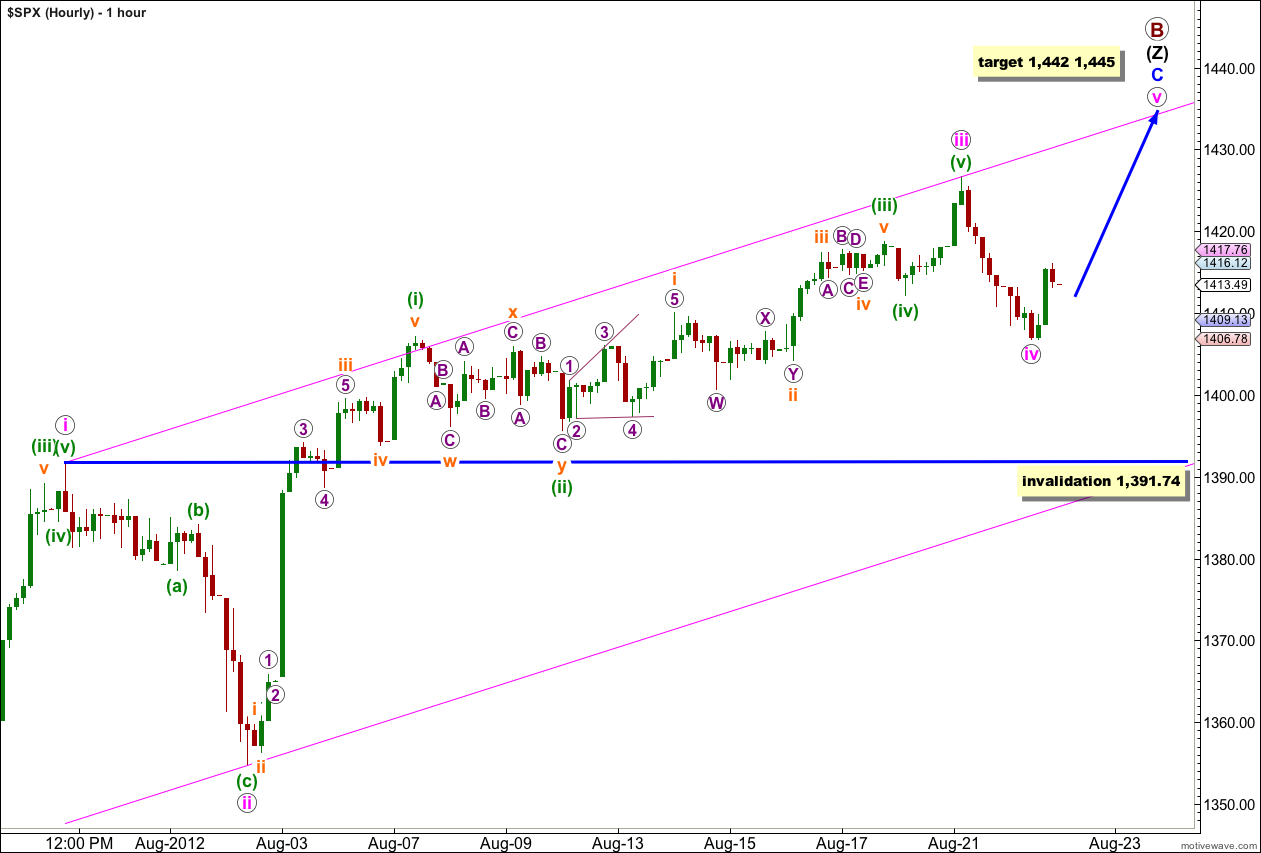
This hourly wave count is perfectly in line with the daily wave count and sees downwards movement as wave iv pink.
At 1,445 wave v pink would reach 0.618 the length of wave i pink. At 1,442 wave C blue would reach equality with wave A blue. This gives us a 3 point target zone for upwards movement to end.
I would expect wave v pink to take at least one week, if not longer, to unfold.
If price moves below 1,391.74 in the next few days we may consider the alternate below, although it would still require trend channel confirmation.
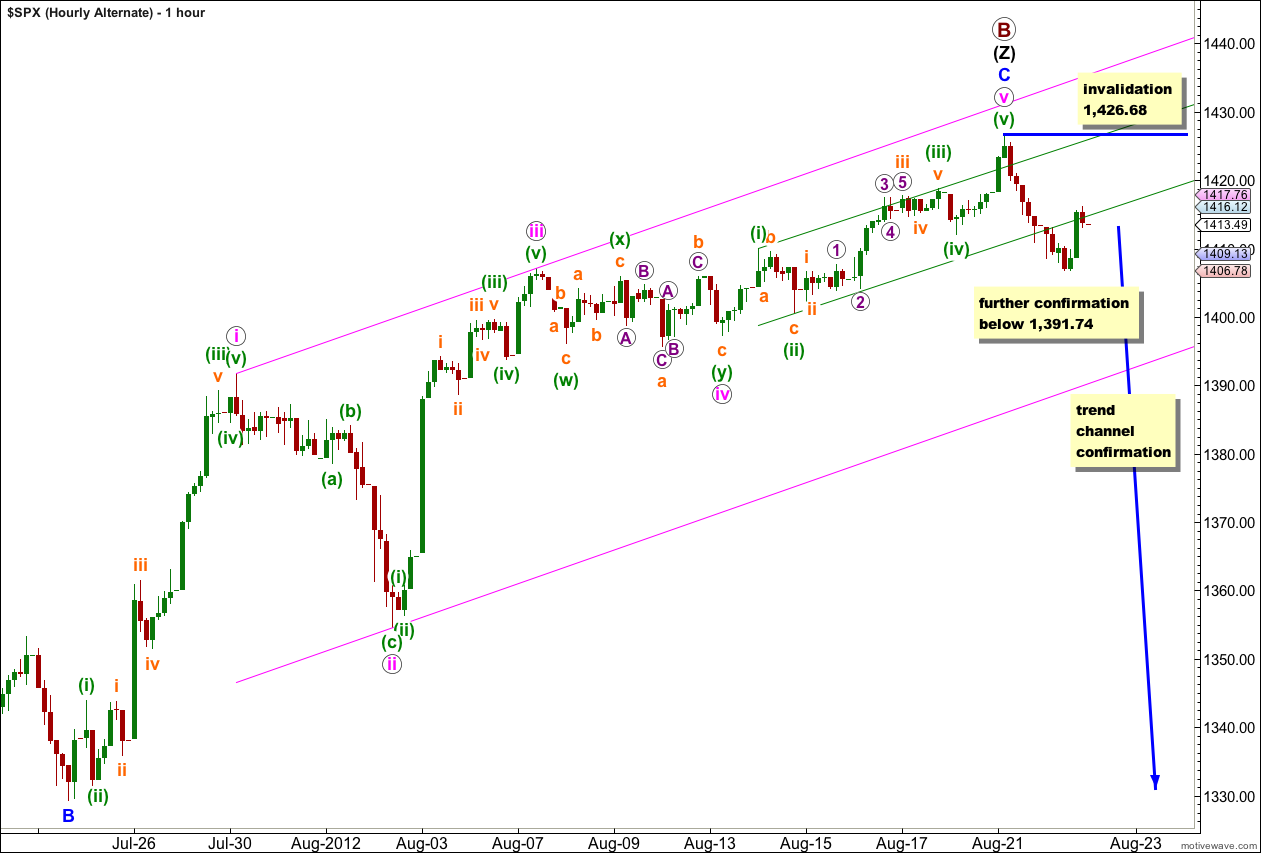
It remains possible that upwards movement is over. Within any trend there will always be several points along the way at which the structure could be considered complete at all wave degrees, but we should assume the trend remains the same, until proven otherwise. Therefore, we should assume the trend is up while price is above 1,391.74 and within the parallel channel on the daily and hourly charts.
If price begins to fall below 1,391.74 this alternate wave count would increase in probability. Movement below the channel would further increase the probability of a trend change.