
The main wave count expected upwards movement, which is exactly how the short trading week has ended. The target remains the same.
Summary: The target for upwards movement is now 2,737. A new high above 2,674.78 would add confidence in an upwards swing. A bullish signal today from the both AD line and inverted VIX supports this. Price has again bounced up off support at both a trend line and the 200 day moving average. Expect support to hold until it is breached.
A new low below 2,585.89 would indicate downwards movement has one more low before it is done, and the target would be at 2,561 or 2,521. Bearish On Balance Volume supports this view.
Always practice good risk management. Always trade with stops and invest only 1-5% of equity on any one trade.
New updates to this analysis are in bold.
The biggest picture, Grand Super Cycle analysis, is here.
Last historic analysis with monthly charts is here. Video is here.
An alternate idea at the monthly chart level is given here at the end of this analysis.
An historic example of a cycle degree fifth wave is given at the end of the analysis here.
MAIN ELLIOTT WAVE COUNT
WEEKLY CHART
Click chart to enlarge.
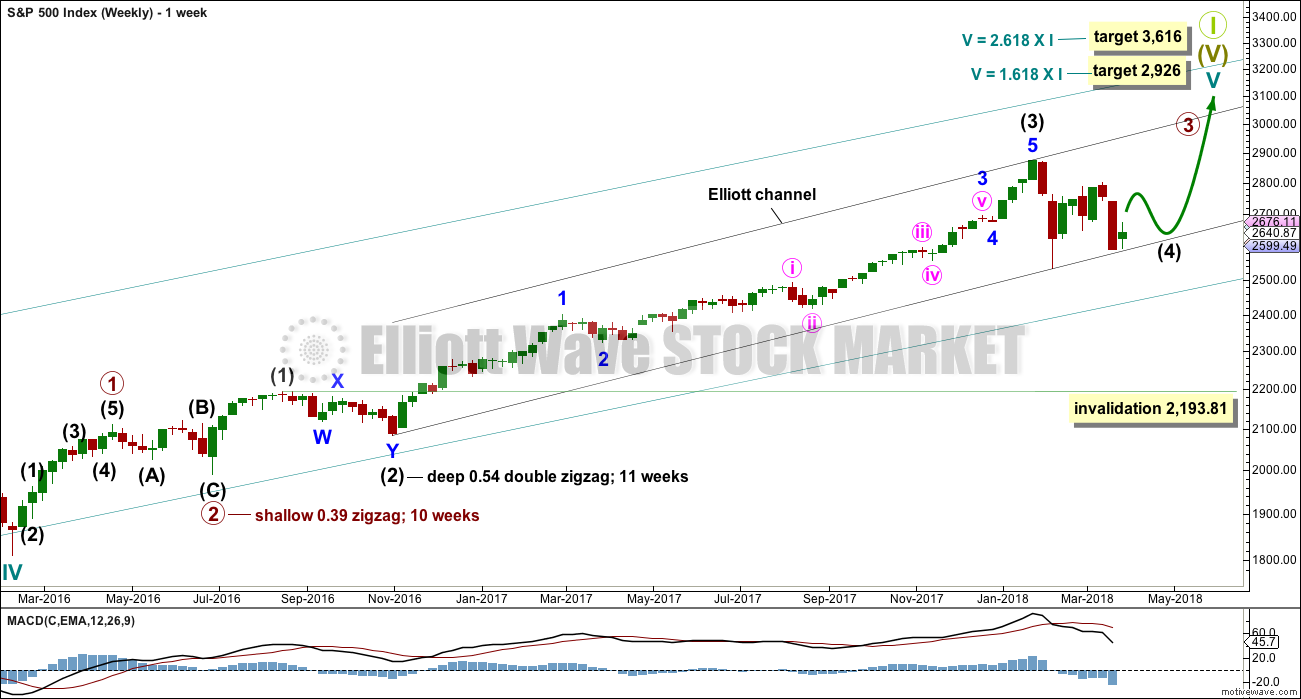
Cycle wave V must complete as a five structure, which should look clear at the weekly chart level. It may only be an impulse or ending diagonal. At this stage, it is clear it is an impulse.
Within cycle wave V, the third waves at all degrees may only subdivide as impulses.
Intermediate wave (4) has breached an Elliott channel drawn using Elliott’s first technique. The channel is redrawn using Elliott’s second technique as if intermediate wave (4) was over at the first swing low within it. If intermediate wave (4) continues sideways, then the channel may be redrawn when it is over. The upper edge may provide resistance for intermediate wave (5).
Intermediate wave (4) may not move into intermediate wave (1) price territory below 2,193.81. However, it would be extremely likely to remain within the wider teal channel (copied over from the monthly chart) if it were to be reasonably deep. This channel contains the entire bull market since the low in March 2009, with only two small overshoots at the end of cycle wave IV. If this channel is breached, then the idea of cycle wave V continuing higher would be discarded well before the invalidation point is breached.
At this stage, it now looks like intermediate wave (4) may be continuing further sideways as a combination, triangle or flat. These three ideas are separated into separate daily charts. All three ideas would see intermediate wave (4) exhibit alternation in structure with the double zigzag of intermediate wave (2).
A double zigzag would also be possible for intermediate wave (4), but because intermediate wave (2) was a double zigzag this is the least likely structure for intermediate wave (4) to be. Alternation should be expected until price proves otherwise.
DAILY CHART – TRIANGLE
Click chart to enlarge.
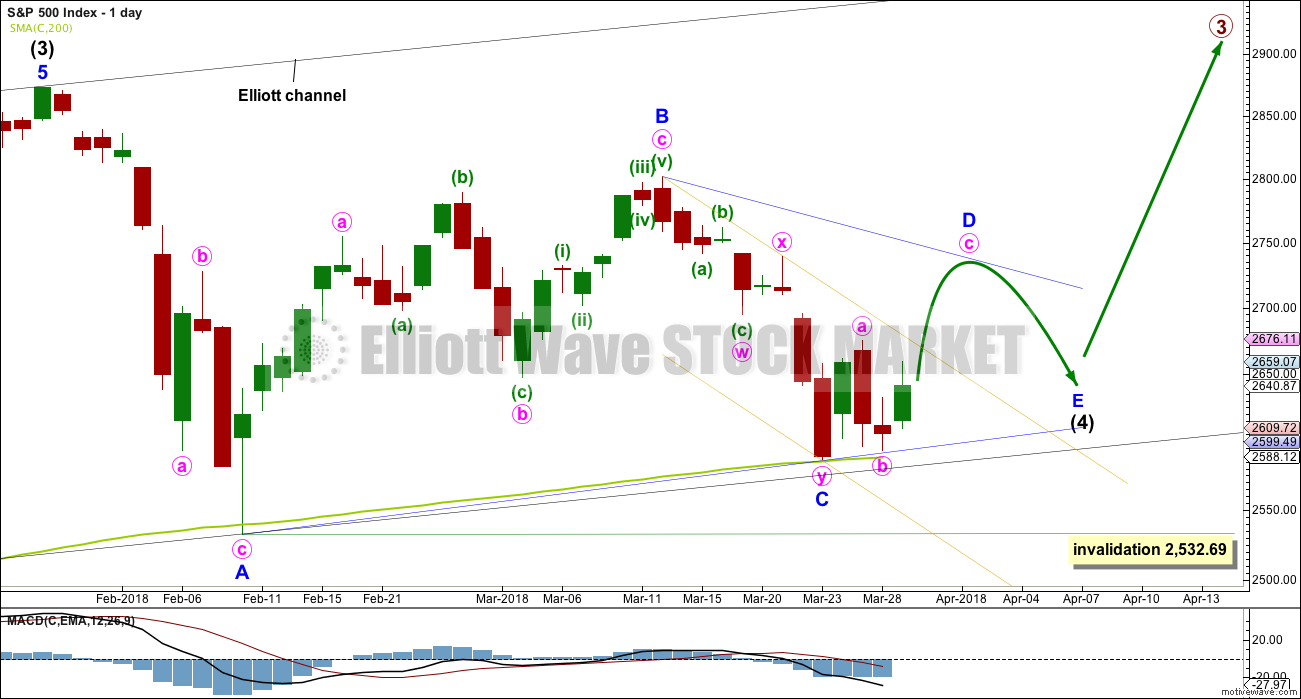
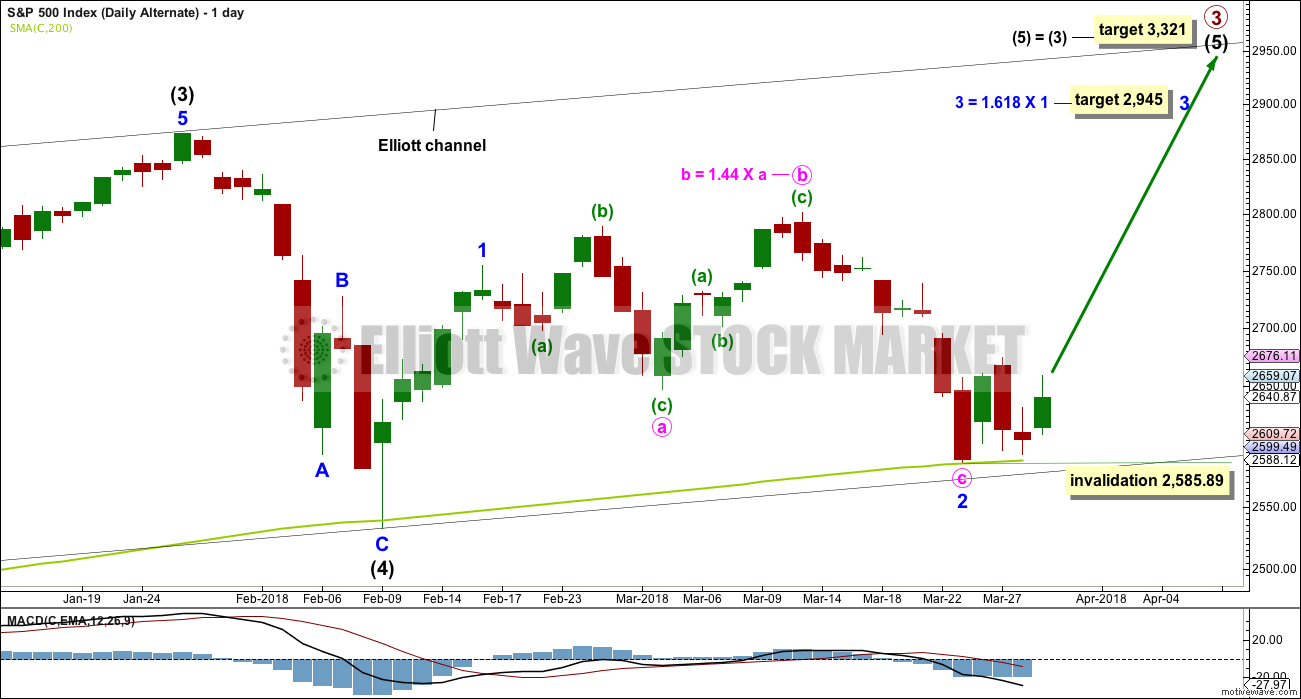
This first daily chart looks at a triangle structure for intermediate wave (4). The triangle may be either a regular contracting or regular barrier triangle. Within the triangle, minor waves A, B and now C may be complete.
If intermediate wave (4) is a regular contracting triangle, the most common type, then minor wave D may not move beyond the end of minor wave B above 2,801.90. Minor wave D would be very likely to end about 0.80 to 0.85 the length of minor wave C.
If intermediate wave (4) is a regular barrier triangle, then minor wave D may end about the same level as minor wave B at 2,801.90. As long as the B-D trend line remains essentially flat a triangle will remain valid. In practice, this means the minor wave D can end slightly above 2,801.90 as this rule is subjective.
When a zigzag upwards for minor wave D is complete, then this wave count would expect a final smaller zigzag downwards for minor wave E, which would most likely fall reasonably short of the A-C trend line.
If this all takes a further four weeks to complete, then intermediate wave (4) may total a Fibonacci 13 weeks and would be just two weeks longer in duration than intermediate wave (2). There would be very good proportion between intermediate waves (2) and (4), which would give the wave count the right look.
The low yesterday has found support right on the A-C trend line. Triangles normally adhere well to their trend lines, and it is common for the trend lines to be tested within triangle sub-waves. This has a typical look.
It is possible that minor wave C is over as per the labelling on this daily chart and the first hourly chart below, but it is also possible that it could continue lower. An alternate hourly chart covers that possibility.
The best fit channel about minor wave C is redrawn to be as conservative as possible. It is copied over to the alternate hourly chart below.
HOURLY CHART
Click chart to enlarge.
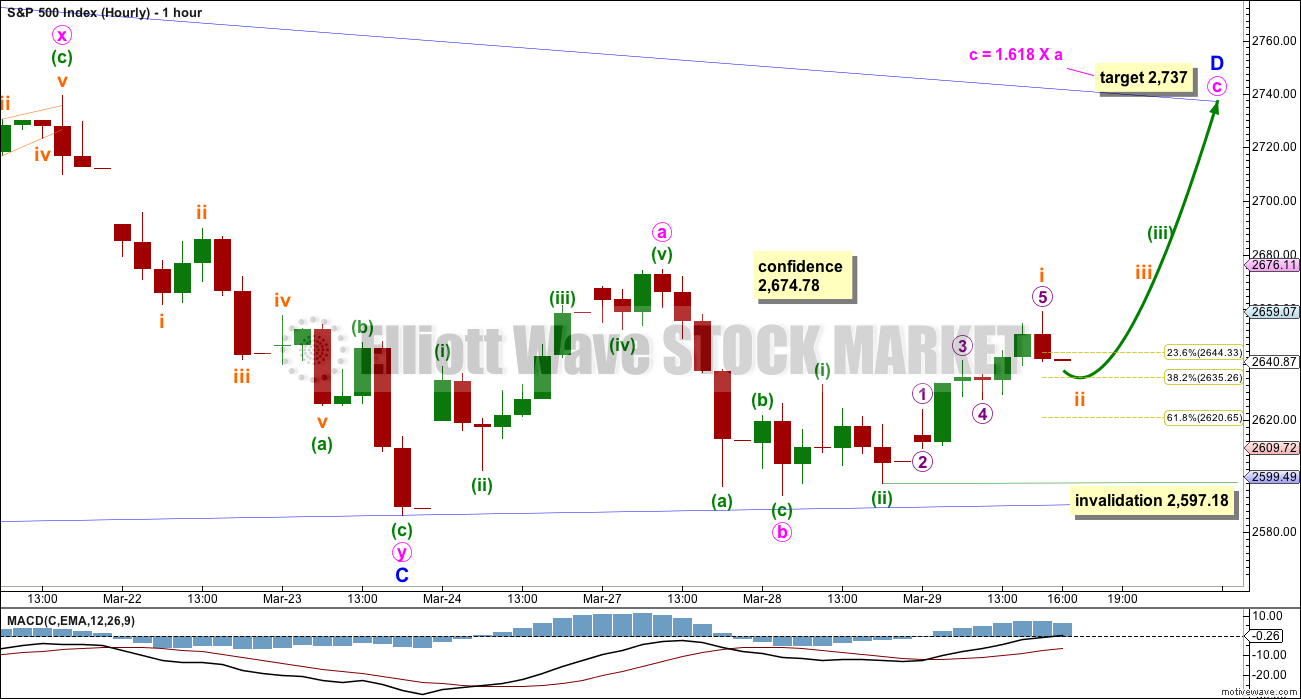
Minor wave D within a triangle should subdivide into a simple A-B-C corrective structure, most likely a simple zigzag.
Some confidence in this wave count at the hourly chart level may be had if price makes a new high above 2,674.78.
Minute wave c must subdivide as a five wave structure. Because upwards movement for Thursday does not have support from volume it looks unlikely that minuette wave (iii) was over at Friday’s high. Minuette wave (iii) may be incomplete. It should be expected to exhibit an increase in upwards momentum and have some support from volume.
Within minuette wave (iii), subminuette wave i may be over at Thursday’s high. Subminuette wave ii may be more brief and shallow than a typical second wave due to an upwards pull from the middle of a third wave. Subminuette wave ii may not move beyond the start of subminuette wave i below 2,597.18.
Price has found support now three times at the A-C trend line. If this wave count is correct, then support there should hold.
ALTERNATE HOURLY CHART
Click chart to enlarge.
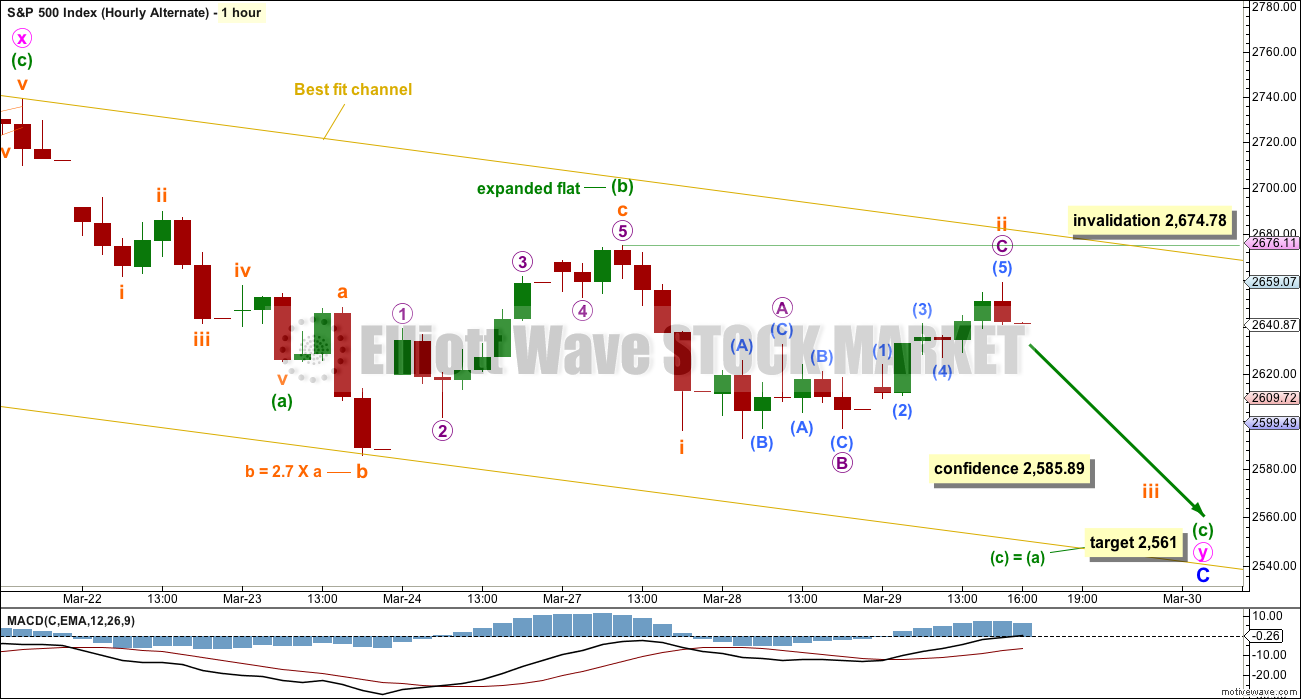
It is also possible that the second zigzag in the double for minor wave C is incomplete.
If the zigzag of minute wave y is continuing, then within it minuette wave (b) must be seen as an expanded flat correction (all subdivisions will fit at the five minute chart level). The problem here though is the length of subminuette wave b within the expanded flat. While there is no rule stating a limit for B waves within flats, there is a convention that states when the B wave is more than twice the length of the A wave the probability of a flat is extremely low. I have seen a few expanded flats where wave B is longer than twice the length of wave A, but they are uncommon.
The probability of this wave count would be reduced for this reason.
Now the size in both depth and duration of subminuette wave ii further reduces the probability of this wave count. It no longer has reasonable looking proportions.
Subminuette wave ii may not move beyond the start of subminuette wave i above 2,674.78.
If price makes a new low below 2,585.89, then the target for the triangle wave count would be at 2,561. This would expect the most common Fibonacci ratio between minuette waves (a) and (c).
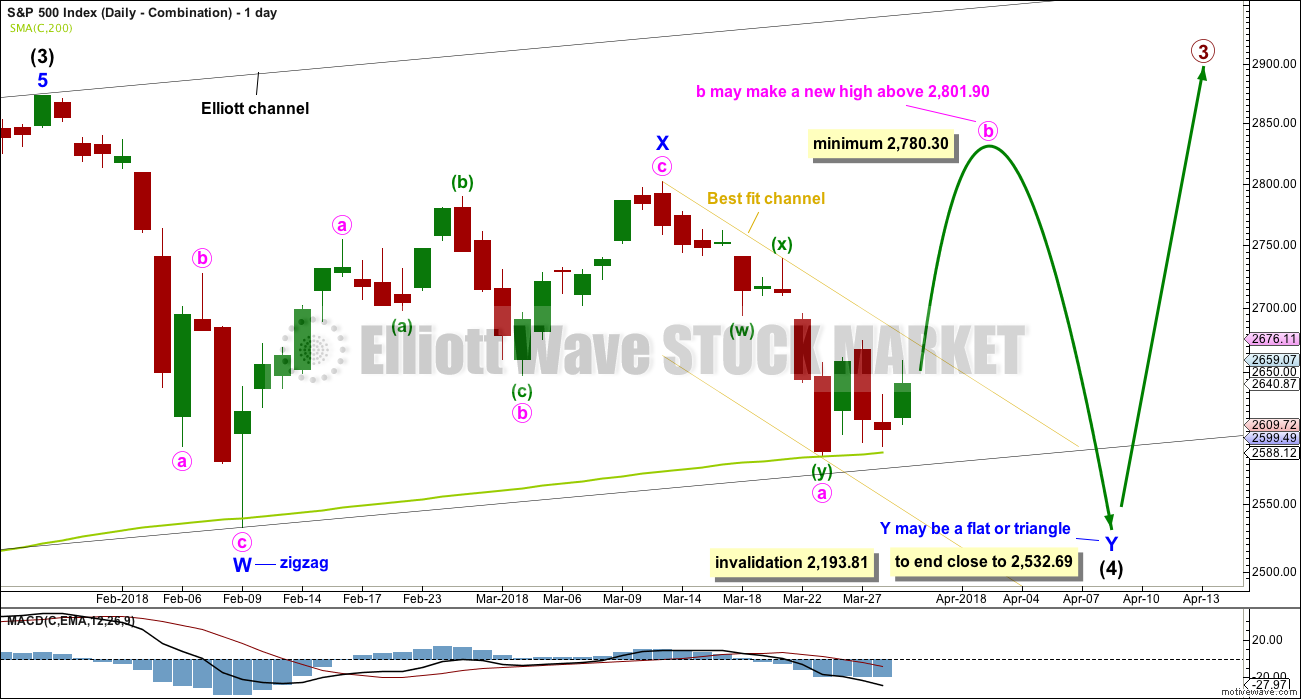
DAILY CHART – COMBINATION
Click chart to enlarge.
Double combinations are very common structures. The first structure in a possible double combination for intermediate wave (4) would be a complete zigzag labelled minor wave W. The double should be joined by a three in the opposite direction labelled minor wave X, which may be a complete zigzag. X waves within combinations are typically very deep; if minor wave X is over at the last high, then it would be a 0.79 length of minor wave W, which is fairly deep giving it a normal look. There is no minimum nor maximum requirement for X waves within combinations.
The second structure in the double would most likely be a flat correction labelled minor wave Y. It may also be a triangle, but in my experience this is very rare, so it will not be expected. The much more common flat for minor wave Y will be charted and expected.
A flat correction would subdivide 3-3-5. Minute wave a must be a three wave structure, most likely a zigzag. It may also be a double zigzag. On the hourly chart, this is now how this downwards movement fits best, and this will now be how it is labelled.
Minute wave b must now reach a minimum 0.90 length of minute wave a. Minute wave b must be a corrective structure. It may be any corrective structure.
The purpose of combinations is to take up time and move price sideways. To achieve this purpose the second structure in the double usually ends close to the same level as the first. Minor wave Y would be expected to end about the same level as minor wave W at 2,532.69. This would require a strong overshoot or breach of the 200 day moving average, which looks unlikely.
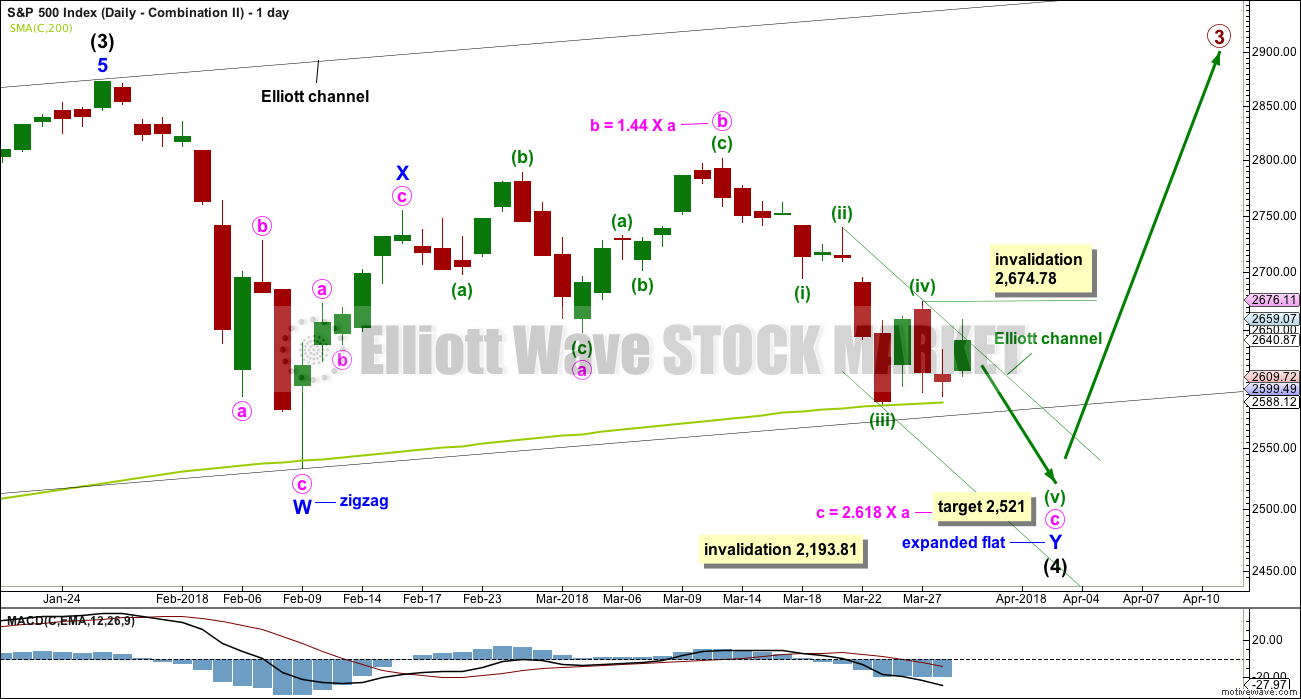
DAILY CHART – COMBINATION II
Click chart to enlarge.
This is another way to label the combination.
Minor wave W is still a zigzag labelled in the same way, over at the first low within intermediate wave (4).
The double is joined by a quick three in the opposite direction labelled minor wave X, subdividing as a zigzag.
Minor wave Y may have begun earlier and may be an almost complete expanded flat correction, and within it minute wave a is a three, itself an expanded flat. Minute wave b is a zigzag and only slightly longer than the most common length of up to 1.38 times the length of minute wave a. Minute wave c downwards must be a five wave structure. It may need a final fifth wave to complete it.
Within minuette wave (v), no second wave correction may move beyond its start above 2,674.78.
The target would see minor wave Y end only slightly below the end of minor wave W. The whole structure for the double combination would move sideways. This wave count would also require a substantial breach of the 200 day moving average (at this point about 68 points). This looks unlikely but is discussed as a possibility in the classic technical analysis section below.
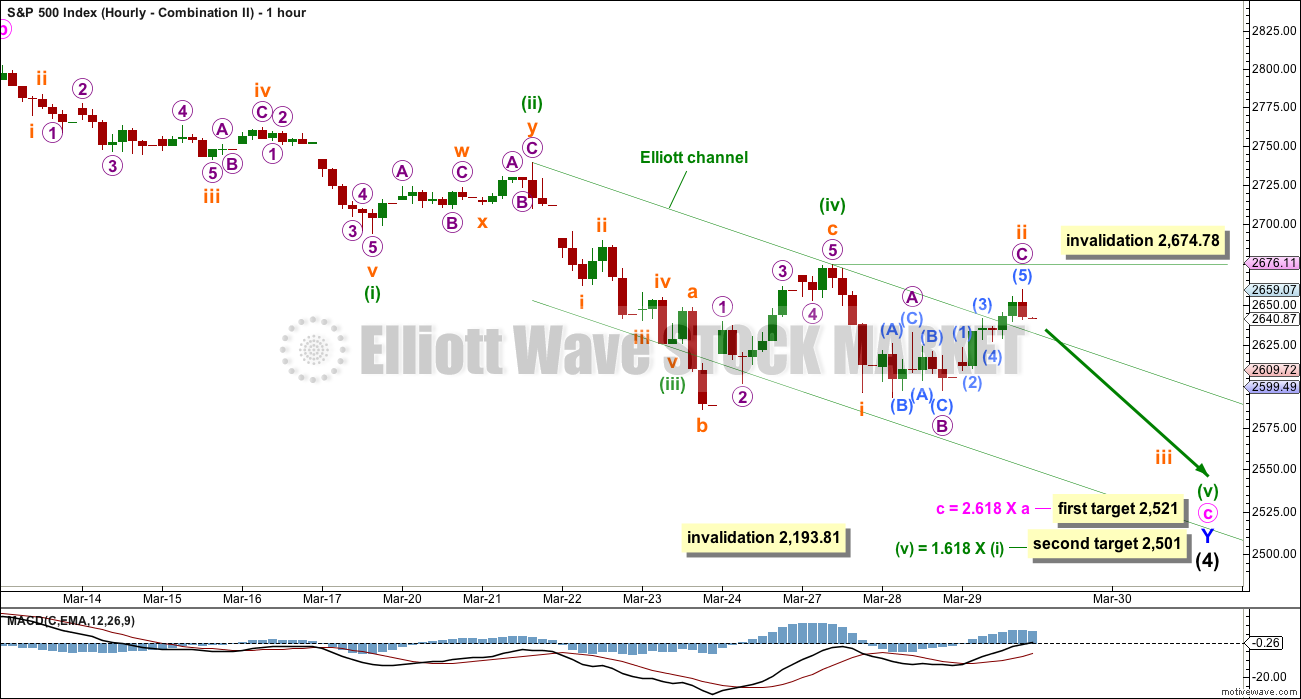
HOURLY CHART – COMBINATION II
Click chart to enlarge.
The Elliott channel is drawn using Elliott’s second technique for an impulse. If an impulse downwards is incomplete, then within minuette wave (v) upwards corrections should find strong resistance at the upper edge of the channel. That channel should not be breached.
The fact that the end of Thursday’s session has breached the channel indicates this wave count may be wrong. It has substantially reduced in probability.
If subminuette wave ii continues higher, it may not move beyond the start of subminuette wave i above 2,674.78.
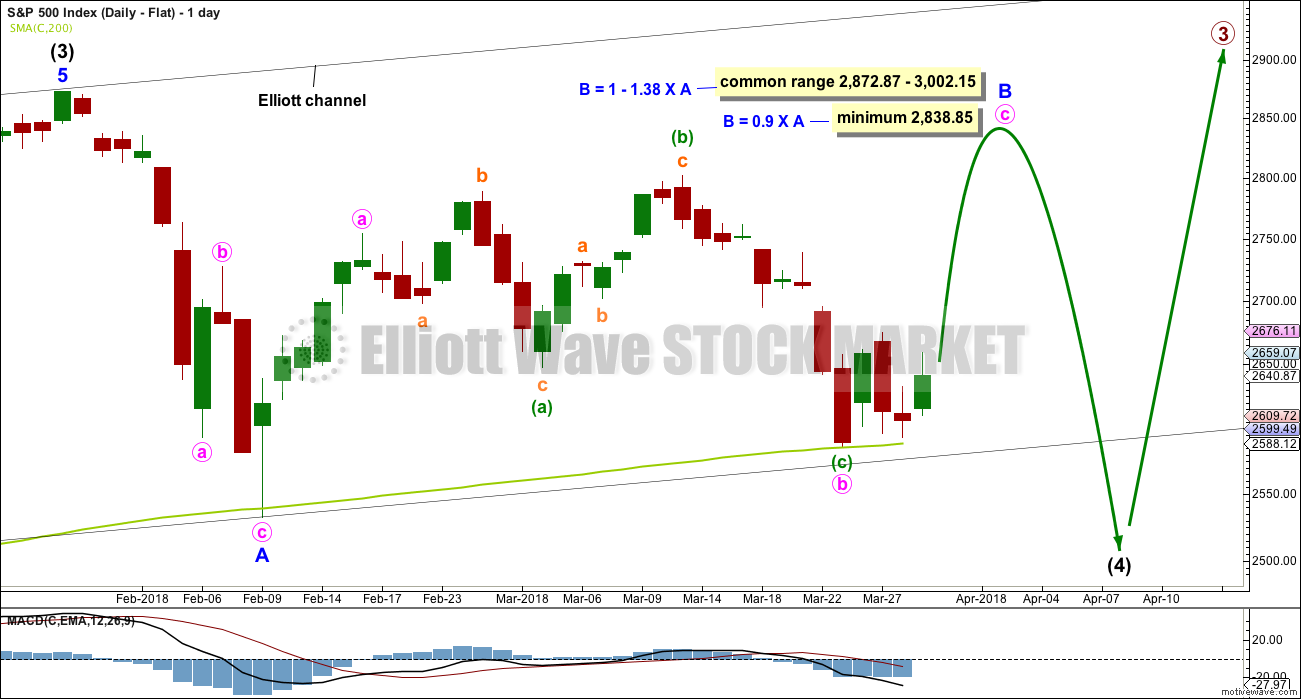
DAILY CHART – FLAT
Click chart to enlarge.
Flat corrections are very common. The most common type of flat is an expanded flat. This would see minor wave B move above the start of minor wave A at 2,872.87.
Within a flat correction, minor wave B must retrace a minimum 0.9 length of minor wave A at 2,838.85. The most common length for minor wave B within a flat correction would be 1 to 1.38 times the length of minor wave A at 2,872.87 to 3,002.15. An expanded flat would see minor wave B 1.05 times the length of minor wave A or longer, at 2,889.89 or above.
Minor wave B may be an incomplete zigzag, and within it minute wave c upwards must now subdivide as a five wave structure. How high minor wave B goes would indicate for this wave count what type of flat correction may be unfolding for intermediate wave (4).
It is also possible for this wave count that minute wave b may not be complete and may move lower.
When minor wave B is a complete corrective structure ending at or above the minimum requirement, then minor wave C downwards would be expected to make a new low below the end of minor wave A at 2,532.69 to avoid a truncation.
This wave count would require a very substantial breach of the 200 day moving average for the end of intermediate wave (4). This is possible but may be less likely than a smaller breach. Support at the 200 day average at this stage continues to hold and should be expected to do so until price breaks it.
DAILY CHART – ALTERNATE
Click chart to enlarge.
It is possible still that intermediate wave (4) was complete as a relatively brief and shallow single zigzag.
A new all time high with support from volume and any one of a bullish signal from On Balance Volume or the AD line would see this alternate wave count become the main wave count.
The target for minor wave 3 expects the most common Fibonacci ratio to minor wave 1.
It now looks more likely that for this alternate wave count minor wave 2 should be over. Within minor wave 3, no second wave correction may move beyond the start of its first wave below 2,585.89.
TECHNICAL ANALYSIS
WEEKLY CHART
Click chart to enlarge. Chart courtesy of StockCharts.com.
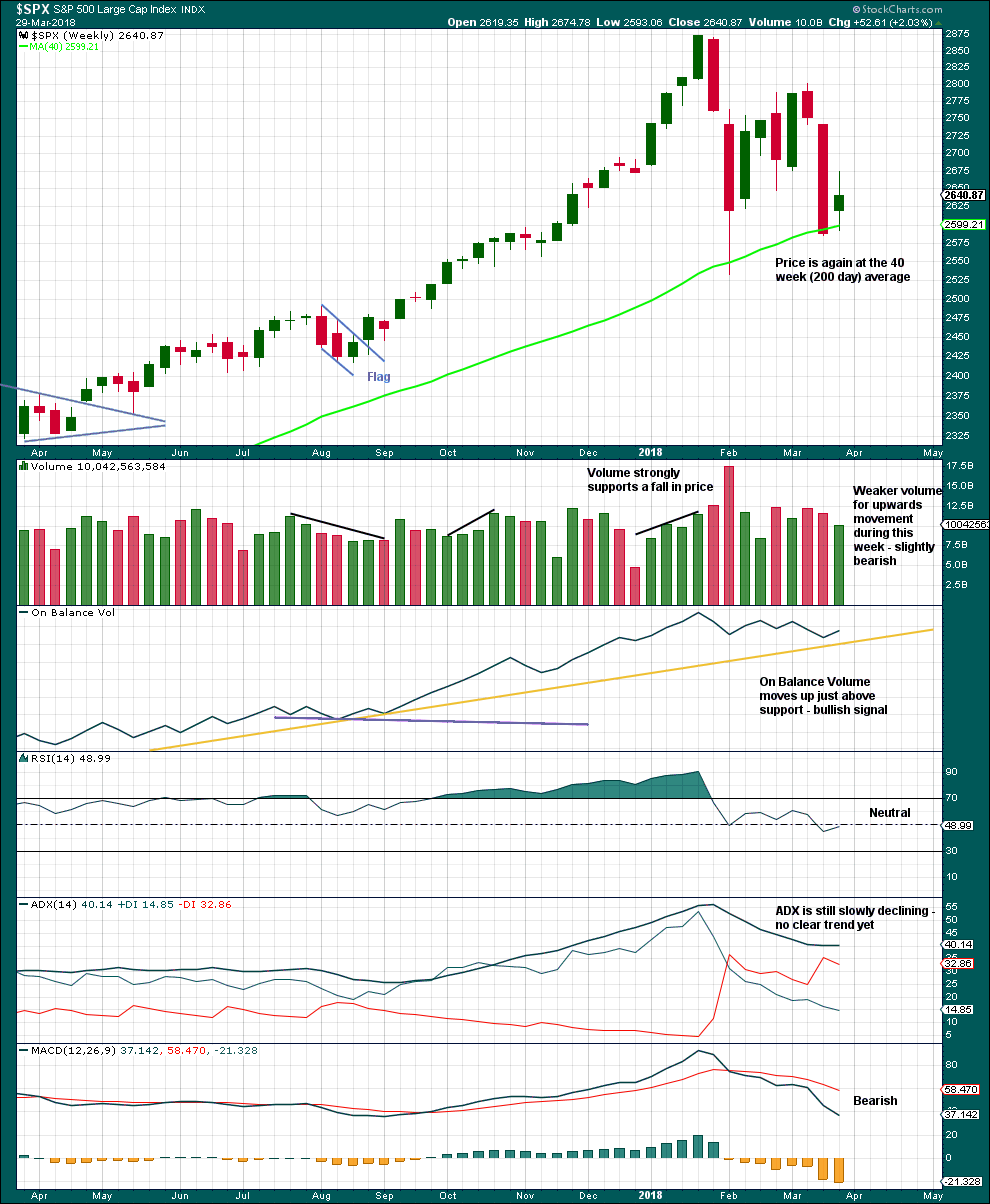
Although volume this week is lighter than last two downwards weeks, this is only of slight concern. Light and declining volume has long been a feature of this bull market. It does not appear to be causing the bull market to be unsustainable, yet.
Give reasonable weight to the bullish signal from On Balance Volume, although it has not perfectly touched the support line.
It is a reasonable approach to expect the 200 day / 40 week moving average to continue to provide strong support while price is above it.
DAILY CHART
Click chart to enlarge. Chart courtesy of StockCharts.com.
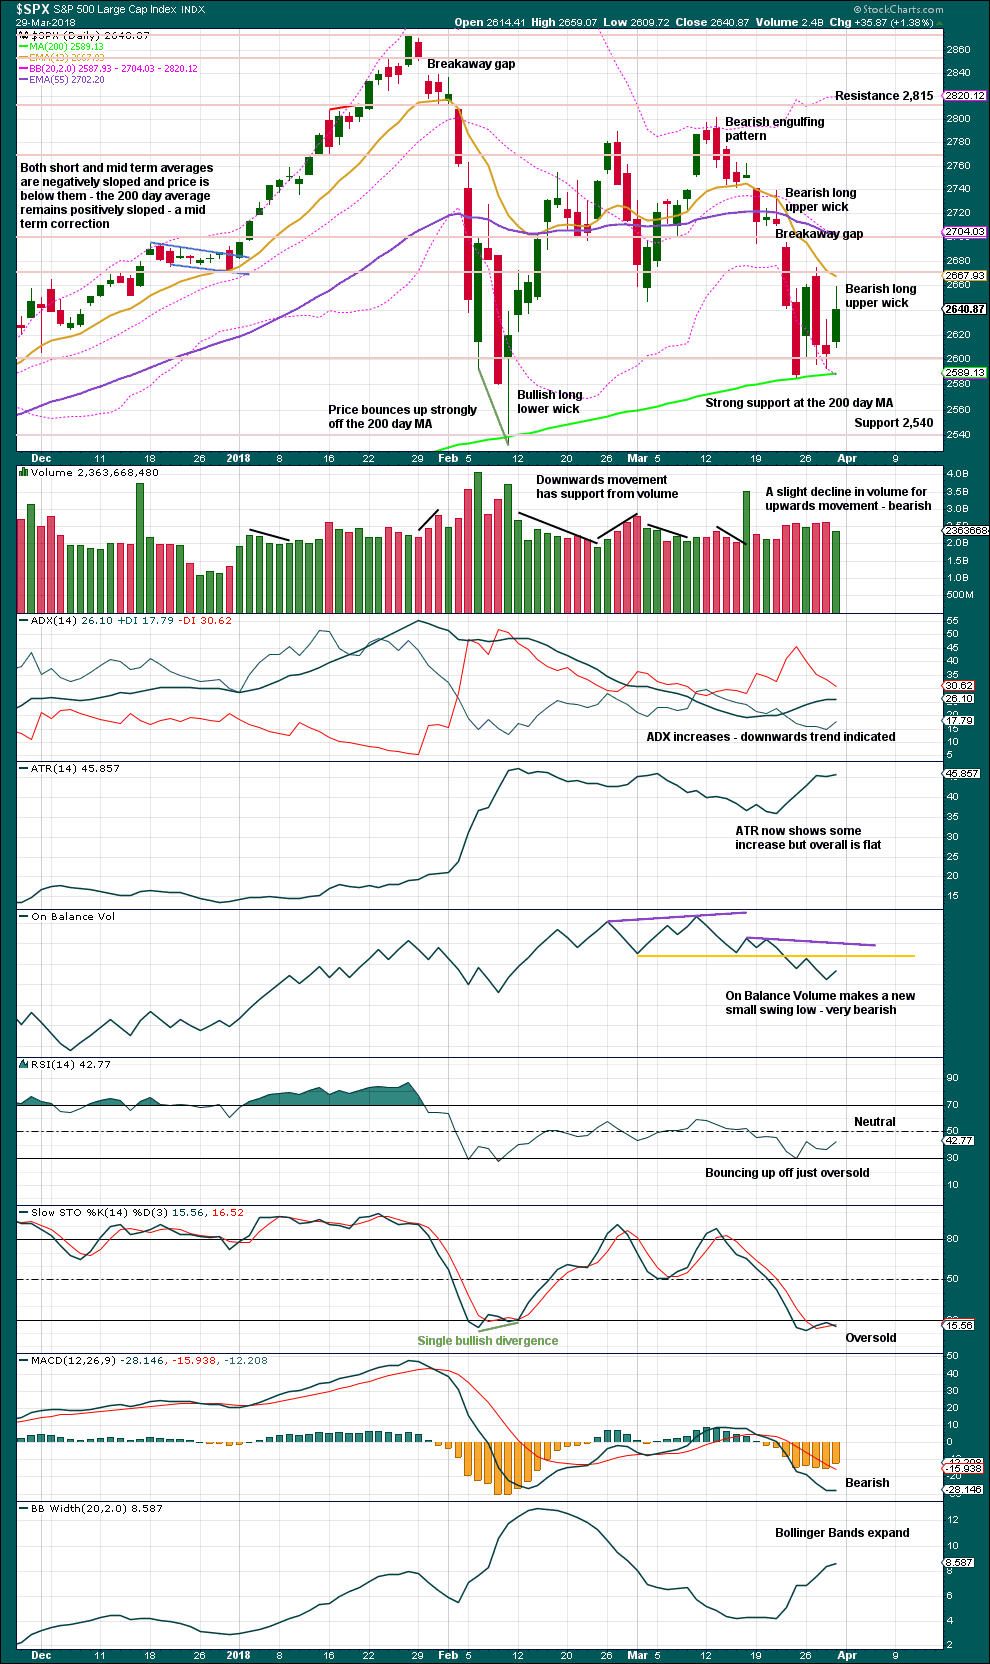
Look out for resistance at the breakaway gap at 2,709.79. The yellow line on On Balance Volume may also provide resistance, but it allows for some more upwards movement first.
Lighter volume for Thursday with a long upper candlestick wick suggest a pullback on Monday may unfold. There is support just below about 2,600.
VOLATILITY – INVERTED VIX CHART
Click chart to enlarge. Chart courtesy of StockCharts.com.
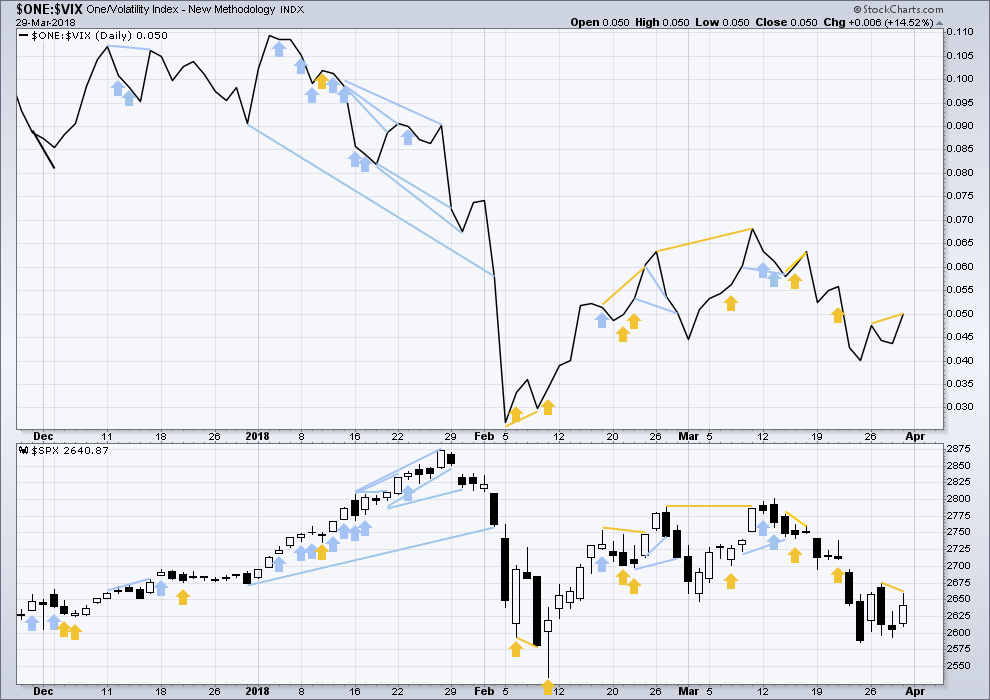
So that colour blind members are included, bearish signals will be noted with blue and bullish signals with yellow.
Normally, volatility should decline as price moves higher and increase as price moves lower. This means that normally inverted VIX should move in the same direction as price.
Thursday’s new small swing high has made a new high in inverted VIX but not yet in price. This divergence is read as bullish, if inverted VIX is a leading indicator.
BREADTH – AD LINE
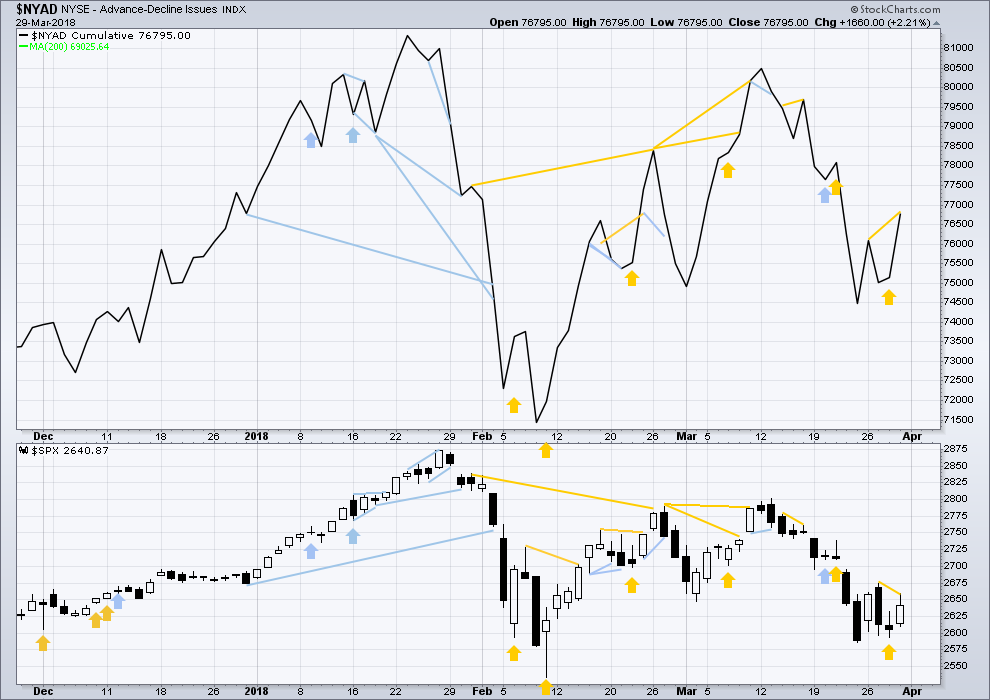
Click chart to enlarge. Chart courtesy of StockCharts.com.
There is normally 4-6 months divergence between price and market breadth prior to a full fledged bear market. This has been so for all major bear markets within the last 90 odd years. With no longer term divergence yet at this point, any decline in price should be expected to be a pullback within an ongoing bull market and not necessarily the start of a bear market.
All of small, mid and large caps last week fell strongly. The fall in price has broad support from market breadth. It was small caps though that had the least decline. This slight divergence indicates some weakness and may be interpreted as slightly bullish.
Breadth should be read as a leading indicator.
Thursday’s small new swing high in the AD line has not seen a corresponding new swing high in price. This is read as bullish divergence.
DOW THEORY
All indices have made new all time highs as recently as nine weeks ago, confirming the ongoing bull market.
The following lows need to be exceeded for Dow Theory to confirm the end of the bull market and a change to a bear market:
DJIA: 17,883.56.
DJT: 7,039.41.
S&P500: 2,083.79.
Nasdaq: 5,034.41.
Charts showing each prior major swing low used for Dow Theory are here.
Published @ 11:11 p.m. EST.
Another idea, the combination. This is my preferred way of labelling it.
Minute c needs to be a five wave structure. It’s not a diagonal, it may only be an impulse. This just doesn’t really fit though. And it looks weird. The correction of subminuette ii is too large.
Hourly chart for this idea:
The invalidation point may now be moved down to the end of subminuette wave i. Subminuette wave iv may not move up into subminuette wave i price territory.
And so a new high above 2,596.12 now would invalidate this idea at the hourly chart level (and make it even more difficult to see a solution at the daily chart level) and so add confidence to the triangle idea published just below.
First idea updated:
Main daily chart:
The triangle idea. Minor C may be moving lower today as a double zigzag. For the last portion of this downwards movement (the last 7 days) this has a good look at the daily chart level.
Hourly chart updated:
All subdivisions fit.
DJI has already taken out its Feb low…. 🙂
BarChart aren’t giving me DJIA data. Ugh. They’re unreasonably slow.
Yeah, I see that now on StockCharts.
The S&P500 and DJIA are probably going to have different structures for this correction.
But yeah, from a Dow Theory POV that’s interesting. I’m going to have to revisit my lows used for Dow Theory confirmation on all markets.
DJT is a long way off. It’s always a laggard.
Anyone thinks today might be the low for minor wave C in place at SPX 2570?
Both VIX and UVXY did not make a higher high with SPX clearly making a lower low from March 23rds kiss of the 200 SMA… that’s signalling me that a low might be in place?
Of course will have to wait and see if SPX can break above the 200 SMA first…
I’d be more than a little suprised if this is it. I think price is going to AT LEAST 2533 area (the Feb. low) before this now 14 day old push down is complete. I don’t think SPX slams down with this much momentum out of a multi-day and very wide consolidation zone without follow through. The classic follow through bar for tomorrow would be a “oops” bar similar to Feb 9 that has a tail around 2533 but closes above the open and above today’s close.
Volatility is no longer spiking with massive moves down in the indices. Note that although we have taken out the Feb low on some indices we are nowhere near the VIX highs of Feb 9. This is evidence of an incredible level of bullishness and complacency in the market. Truly stunning!
Took Christina to the train station for return to campus today. It was a nice break!
The next critical piece of this puzzle is the 200 day MAs.
It looks to me like momentum is increasing as we approach those pivots.
If they do not hold…well, need I say more?! 🙂
The SPX 200 day is busted down, per my charts. I had it at 2589, and spx is now 2579. Hey, just another -3% day, yawn….all part of a big darn 4 still working itself through its paces, as I see it. Get back far enough, SPX has done a big 5 wave down A, a big 3 wave up B, and is now in process of completing the 4 with a big 5 wave down C. Of course “it’s more complex than that” and probably a WXY etcetera but…at a big picture level, that’s pretty much what I see. Where C bottoms is the current question of interest.
I expected a low this morning but futures spinning a cautionary tale. Loaded lots of shorts on Friday on that long upper wick, impulsive move down and 62% expanded flat second wave. Taking some off the table on this move down. Trade safely!
Current move touched the 61.8% fibo at 2617. An obvious place for a turn back up. Next lower would be 78.6% at 2607.
The last 5 days of SPX action, in the larger context on the daily chart, sure as heck looks like a big bear flag to me. It may just be consolidation at the bottom…maybe. But some big red candles dropping away from it soon would be my “show me the chart and quickly guess what’s next” best guess, honestly. And that’s consistent with the weekly momentum being strongly down. One theory says that should take another few weeks of sideways/down to reach overbought and reverse.
Bounced off the 127% at 2577. Not holding…2556 is the 1.62% and it’s next….
Anyone want to play a little game? It’s real simple: guess the SPX low, before the next ATH (SPX).
My guess: 2466.
Anybody else want to play?
The 18 month SMA for SPX is at 2462 which has historically acted as support and resistance back to the year 1995… and there’s a gap up on 9/11/17… to close that gap would be at 2461…
So right there with your guesstimate!
Well, sure, I’ll play. Last week before this game was announced, I asked myself, “What would entice me to buy?” The answer was 2450 SPX. That is still true. However, I am favoring the corrective triangle on the daily charts to complete Intermediate 4. Unless that breaks down, the low is in at 2532.
Good game. What are you offering as a prize for the winner?
Honor and Prestige, Rodney, Honor and Prestige. Isn’t anyone a bull and going to go with the existing low?
Come on players, no fair waiting for more market data before deciding. Question is simple: ultimate low of SPX between the Jan 28 ATH and the next point in time when that ATH is exceeded. Here’s the board:
– Kevin: 2466
– Ari: 2462
– Rodney: 2532
I have a friend (not on this board) who has picked 1850!!! Super bear! I know there’s probably a few of you out there with similar views…step right up!! And how about the bulls? No one’s picked “the current low” (I have it at 2533) yet.
The secret remains with the short vol trade folk. That scenario tells you everything you need to know! 🙂
One of the most amazing things to me about markets is that there are people who trade and invest in the market, yet steadfastly deny that governments routinely intervene to try and control market price. Supposedly informed financial talking heads on all sorts of media, including television, ridicule the notion, some even denying the existence of the President’s Working Group on Financial Markets, fondly knows as the PPT (plunge protection team). This is quite remarkable as the 1988 executive order under Reagan is readily available for all to read, and the Group in fact in 2008 admitted they were actively attempting to “stabilize” markets. One can only conclude that people who dismiss and deny the intervention are either ignorant or deliberately being deceitful. Even more critically, I have often wondered how it was possible NOT to see it if you were an active trader!
I don’t know how many folk caught John Crudele’s article from the New York Post back in Feb but it is a good read for anyone not too familiar with the debate. Typically, John was mercilessly attacked by a host of so-called financial experts, either liars or fools, who do want the public thinking about this, or even worse, acting on the information!
https://nypost.com/2018/02/05/dc-plunge-team-may-have-halted-unprecedented-dow-jones-spiral/
Jesse Livermore described market manipulation quite well in his Stock Operator book. Of course we must expect that financial interests with very large exposure in the stock market would use reasonable amounts of incremental capital to support the market, and at times perhaps drive the market down as well (typically to enable more accumulation at lower prices). But overall…it’s another trading actor in the market. I’m not clear on when and where it becomes “plunge protection”, or when it moves from nominal trading of size to somehow “manipulative”. Or is it the nature of the actor that defines whether it’s “manipulation”?. Or the nature of the size of transactions (i.e….their effectiveness?). If central banks are trading in some capacity and are using pullbacks to both (a) increase their position (at least temporarily) and (b) ideally hold up price and even turn momentum and thereby sentiment, is that “manipulation”? Of course it is. Yet it’s just trading as well. The fact there are elephants in the room is just something we all have to deal with is how I see it, and in fact, if we are more capable and nimble and aware, I’d argue all they do is increase the frequency and size of our opportunities.
Ah, is it “plunge protection” when it’s a coordinated campaign between market actors who we would assume are operating fully independently? Is such coordination “illegal” or improper? I wasn’t aware it was, generally. That is, I can say to you “dude I’m buying and you should buy too and together we’ll prompt other buying and drive the market higher, then we can sell off slowly at higher prices”. Can’t I? And if so, can disparate banks do so cooperatively? If not, what makes that illegal? Particularly across international borders? I’m ignorant on this, so I’m asking.
Hi Lara. I have a hunch that Thursday‘s high was end of minuette(i), with the end of the day reversal the start of minuette(ii). I would imagine with minor D starting, we would see both minuettes (i) and (ii) on the daily chart before upward momentum of minuette (iii).
What are your thoughts on this view, considering the TA analysis also pointing to a down day on Monday?
The high I have labelled minuette (i) is at 2,632.65.
In order to see only a single five up complete at Thursday’s high, then you have to find the fourth wave correction which remains above first wave price territory at 2,632.65.
The last small correction that I have labelled micro wave 4 has its low at 2,627.19.
Because of the overlap I’ve not labelled it as a single complete five up, but two first waves up.
Got it. Thanks Lara.
I am concerned that the “death cross” has occurred on both the Dax and FTSE, neither of which look like they are forming a triangle.
I would be surprised if the SPX was going alone with a lot more bullish movement ahead.
The very poor stock performance of Deutschland Bank, along with LIBOR right now being the highest since 2008 can add some concerns about Europe’s equities.
I’m also concerned about the overall public expectation of the US market. Seems like everyone is looking for all time highs coming up; even if they say the market might go lower short term. The general bias that “we’re going higher” has me concerned. Even former bears in this forum are looking for higher equities prices in the future. And most indications point to the fact that the US economy is strong with great earnings coming up, with quarter 2 and 3 earnings better than current quarter.
But the next global rout might not start in US, and your comment suggests it may come from the EU…
“Everyone?!” And who might those “former bears” be, pray tell? 🙂
By everyone I meant the talking heads and the headlines. Not everyone in this forum. Haha
But I get a sense that most members are waiting to go long (including myself), and so that usually signals that the contrarian play is to go short… even though US equities fundamentals look pretty solid at the moment.
Just like a few weeks ago when the general consensus was the 10 year treasury yield was heading towards and north of 3%.
Thanks to Jonathan’s note about the 30 year yield 🙂
Aha! 🙂
I wouldn’t be surprised.
I would actually be surprised if all of the European indices and US indices have highs very close together in time. The markets and economies are linked for sure, but they are still separate markets. The Elliott wave counts will be different.
It may be that the European and British markets have earlier highs, and deep second wave corrections. During their second waves the US markets may have final fifth waves.
That wouldn’t surprise me at all.
I have been concerned with the strength of this wave if a cycle wave V. I am extending this idea for all to examine and comment. Of course the implications are a lot more volatility and abrupt turns prior to Cycle Wave V. Also would mean much more time to go in this bull market scenario.
Interesting chart. While it may not break any EW rules, I have frankly found
smaller degree waves which surpass higher degree ones in either time or price displacement hostile to the cocept of wave degree. Not sure what to do about that nagging counter-intuiton as I’ve seen a few counts in which this appeared to be the case.
I agree Verne, although EW is fundamentally based more on structure rather than displacement, your point is valid. I think that is an area where EW could benefit from more academic research and refinement. However, with so much of the displacement occurring with very large overnight moves in the futures markets a lot EW structure is missing from the daily market data.
It’s certainly possible. I really don’t like seeing that huge correction from October 2014 to February 2016 as an intermediate degree wave though.
The best equivalent period we can look at is the end of Super Cycle wave (III), high in March 2000. There I have cycle wave IV in October 1987 so cycle wave III ending in August 1987.
Using RSI there is greater strength to cycle wave V than cycle wave III there. The difference with MACD is even stronger. But at the monthly chart I’d rather use RSI.
For the current situation comparing highs in November 2014 and the last ATH in January 2018 the current potential fifth wave is stronger, and the difference is greater than the difference between August 1987 and March 2000. But in both cases the possible fifth wave is stronger than the possible third wave, at the monthly chart level.
So it’s happened before. It could happen again. And it won’t the the same, but it could be similar.
The lilac line on RSI here is horizontal so we can see the difference.
Yep. VIX price action strongly suggests primary degree!
Another interesting thing about that Feb 2016 low is that it ended a brief bear market. My thesis is at that time they doubled down on the short vol trade to propel the market toward new highs. Few traders are paying attention to the fact that the unwind of the short vol trade sent SVXY back below 12, a level it last traded at back in 2012. The implications are clear…at least they should be…’nuff said… ?
A blessed weekend to Lara and all her subscribers. I wonder if the dawg gone wabbit will show up for Easter or will it be Peter Rabbit. Hmmm?
Hey Doc! Where is the rest of my Easter eggs?!
Thanks Rodney. It’s been a wonderful weekend.
We’ve had no surf for over 2 weeks, and suddenly surf. Three days in a row! First day it was a solid 3ft, super glassy, and the banks up my local beach were working fine. Big long lefts and rights!
I’m surfed out. Noodled armed.
Nice job Lara. I like all the different scenarios. It gives us a roadmap to take alternate routes when roadblocks occur. Happy Easter all.
Thanks Jerry.
I’ll do the video tomorrow. NY is closed for Good Friday so this is the end of week analysis.