
A correction was expected to be incomplete and continue for a few more days. The first target at 2,796 was met and passed. The second target has not yet been met.
Summary: Expect more downwards movement to begin next week. The target is at 2,749.
In the short term, a new high above 2,813.04 would indicate the correction may be over and the upwards trend may have resumed. A new all time high would add significant confidence to that view.
The larger trend remains upwards and corrections still offer an opportunity to join the trend.
Always practice good risk management. Always trade with stops and invest only 1-5% of equity on any one trade.
The biggest picture, Grand Super Cycle analysis, is here.
Last historic analysis with monthly charts is here. Video is here.
An historic example of a cycle degree fifth wave is given at the end of the analysis here.
MAIN ELLIOTT WAVE COUNT
WEEKLY CHART
Click chart to enlarge.
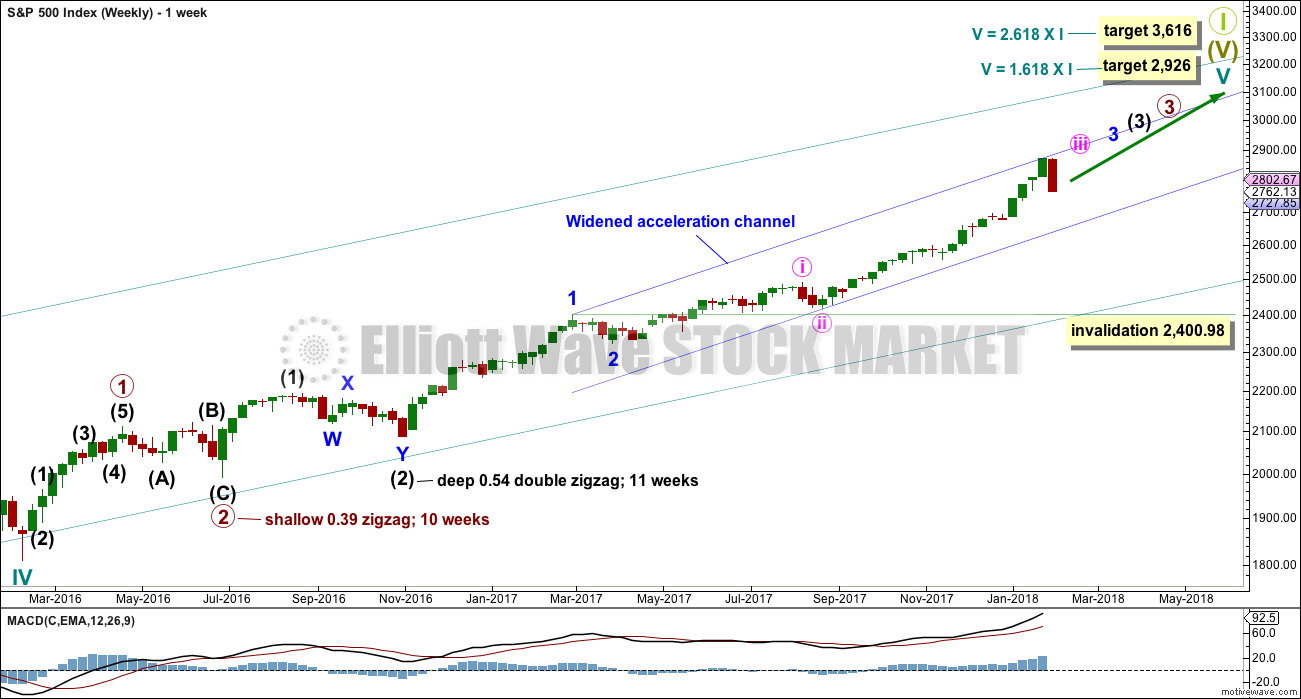
Cycle wave V must complete as a five structure, which should look clear at the weekly chart level. It may only be an impulse or ending diagonal. At this stage, it is clear it is an impulse.
Within cycle wave V, the third waves at all degrees may only subdivide as impulses.
Within cycle wave V, the corrections for primary wave 2 and intermediate wave (2) both show up clearly, both lasting several weeks. The respective corrections for intermediate wave (4) and primary wave 4 should also last several weeks, so that they show up at weekly and monthly time frames. The right proportions between second and fourth wave corrections give a wave count the right look. This wave count expects to see two large multi week corrections coming up.
Cycle wave V has passed equality in length with cycle wave I, which would be the most common Fibonacci ratio for it to have exhibited. The next most common Fibonacci ratio would be 1.618 the length of cycle wave I. This target at 2,926 now looks too low. The next most common Fibonacci ratio would be 2.618 the length of cycle wave I at 3,616. This higher target is looking more likely at this stage.
Intermediate wave (3) has passed all of equality in length with intermediate wave (1), and 1.618 and 2.618 the length of intermediate wave (1). It is possible that intermediate wave (3) may not exhibit a Fibonacci ratio to intermediate wave (1). The target calculation for intermediate wave (3) to end may have to be done at minor degree; when minor waves 3 and 4 are complete, then a target may be calculated for intermediate wave (3) to end. That cannot be done yet.
When minor wave 3 is complete, then the following multi week correction for minor wave 4 may not move into minor wave 1 price territory below 2,400.98. Minor wave 4 should last about four weeks to be in proportion to minor wave 2. It may last about a Fibonacci three, five or even eight weeks if it is a time consuming sideways correction like a triangle or combination. An Elliott channel may be drawn about the impulse of intermediate wave (3) when minor wave 3 is complete, and minor wave 4 may end about the lower edge of that channel.
At this stage, a widened acceleration channel is drawn now in blue about the impulse of intermediate wave (3). This is drawn in the same way as an Elliott channel using Elliott’s first technique, and then the lower edge is pulled down to contain all this recent upwards movement.
As intermediate wave (3) comes to an end, corrections on the weekly chart should begin to be longer lasting. The first of two or three may have begun this week. It still looks like intermediate wave (3) is incomplete, so this correction may last only about one to maybe about four weeks. It is not expected to be much longer lasting than that.
DAILY CHART
Click chart to enlarge.
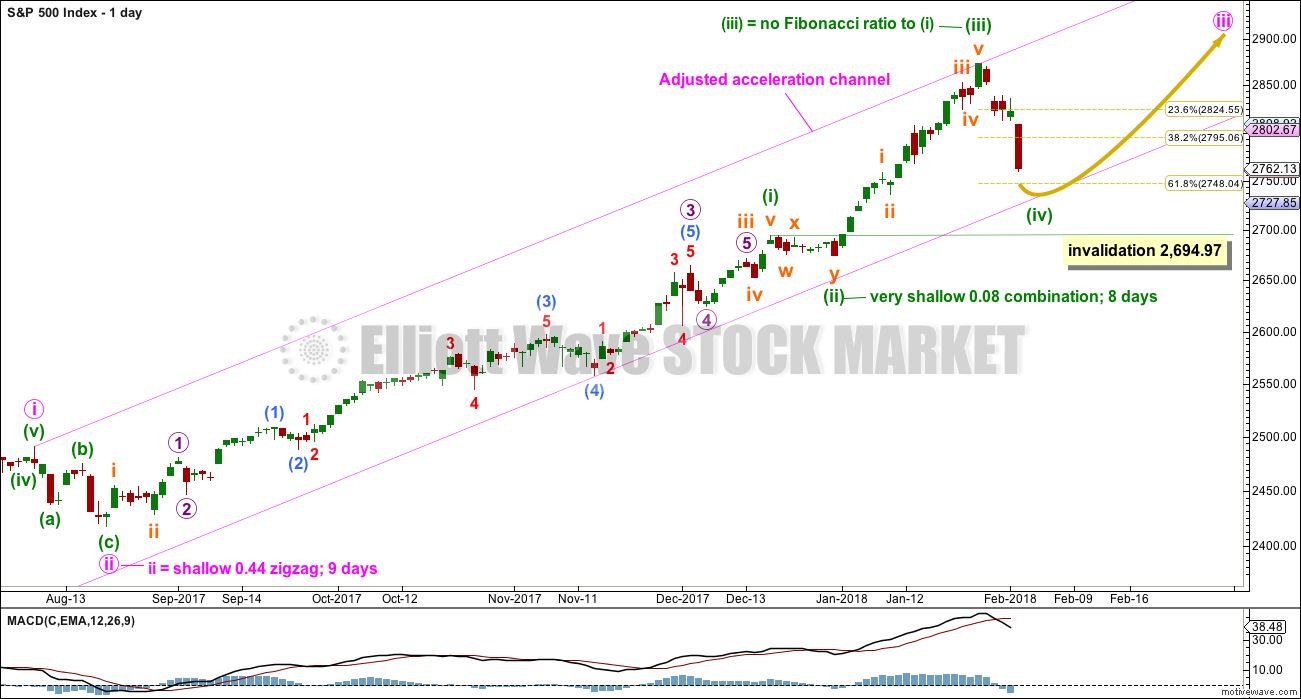
Keep redrawing the acceleration channel as price continues higher: draw the first line from the end of minute wave i to the last high, then place a parallel copy lower down to contain all this upwards movement. When minute wave iii is complete, this would be an adjusted Elliott channel and the lower edge may provide support for minute wave iv.
Minuette wave (ii) subdivides as a combination and lasted only eight sessions, about only one and a half weeks. Minuette wave (iv) may be a zigzag, which tend to be quicker structures than combinations. It is possible that it could be over at Friday’s low, lasting a Fibonacci five days, but it may also continue for another three to total a Fibonacci eight days.
Minuette wave (i) was a long extension. Minuette wave (iii) may have ended at the last high and if so would be shorter than minuette wave (i). This limits minuette wave (v) to no longer than equality in length with minuette wave (iii) so that minuette wave (iii) is not the shortest actionary wave.
Minuette wave (iv) may not move into minuette wave (i) price territory below 2,694.97.
Minute wave iii has passed equality in length with minute wave i, and has passed 1.618 and 2.618 the length of minute wave i. A target for minute wave iii to end must now be calculated at minuette degree. That cannot be done until minuette wave (iv) has ended.
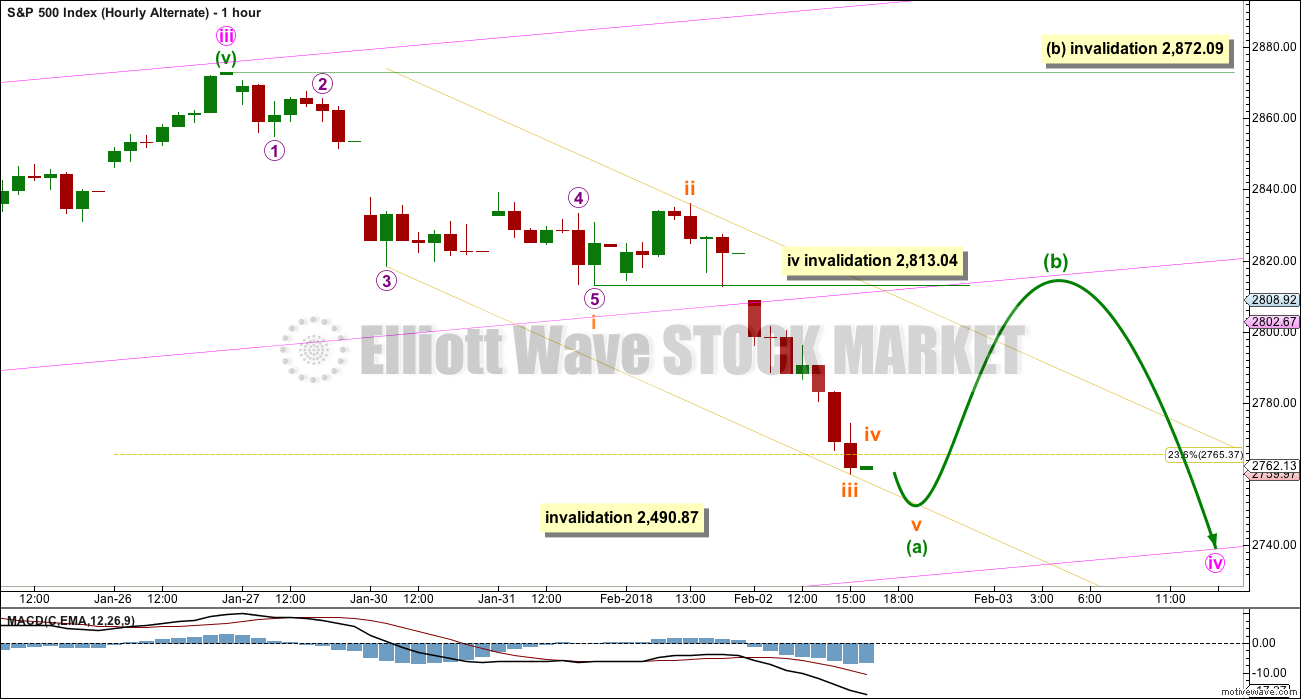
HOURLY CHART
Click chart to enlarge.
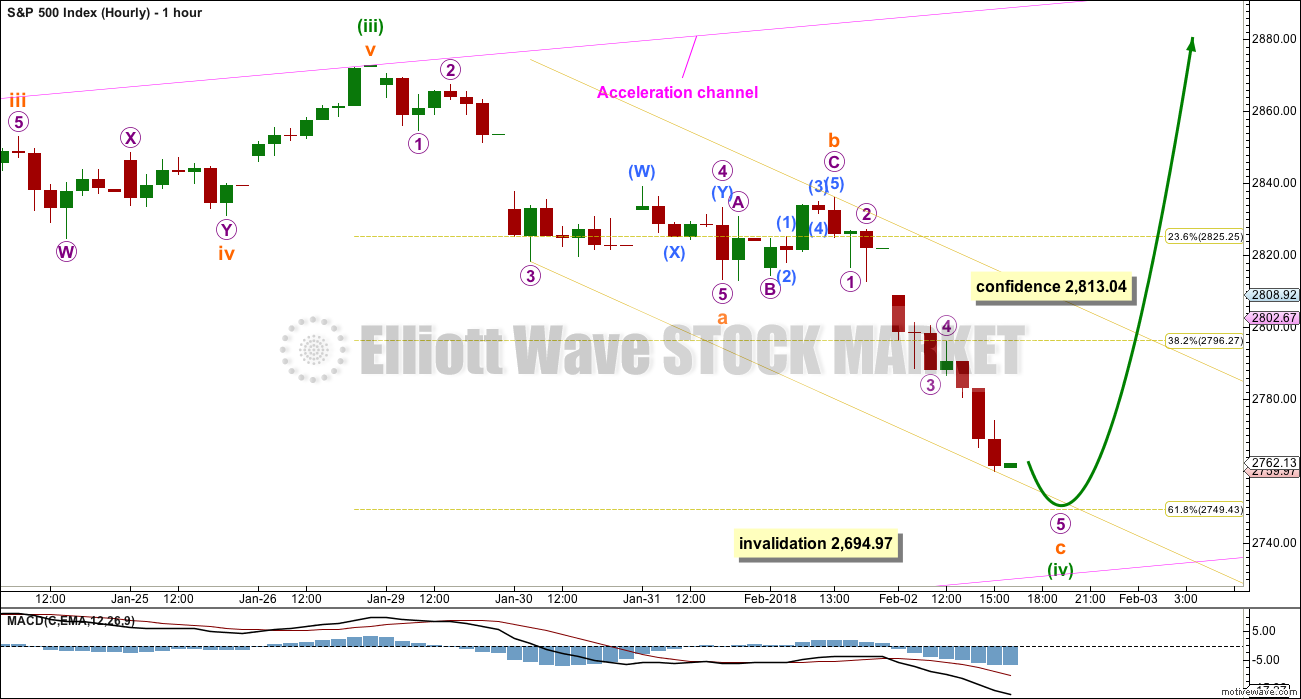
If minuette wave (iv) is a relatively quick zigzag, then it may be nearing completion. If candlesticks on the hourly chart develop early on Monday with long lower wicks, then look for a low to be found. The target may be about 2,749.
Looking back on the hourly chart to corrections back to October 2016, some corrections end with strong C waves and some do not. Almost all corrections (except two) end with candlesticks on the hourly chart that have long lower wicks. Long lower wicks do not mean the correction must end as they can appear during a fall in price yet price may keep falling. But the presence of long lower wicks is a common feature at lows, so a low may be more likely to be found if these develop.
A new high above 2,813.04 would be a short term invalidation of the alternate hourly chart below and offer some early confidence to this wave count. A breach of the best fit yellow channel by upwards movement would offer further confidence.
ALTERNATE DAILY CHART
Click chart to enlarge.
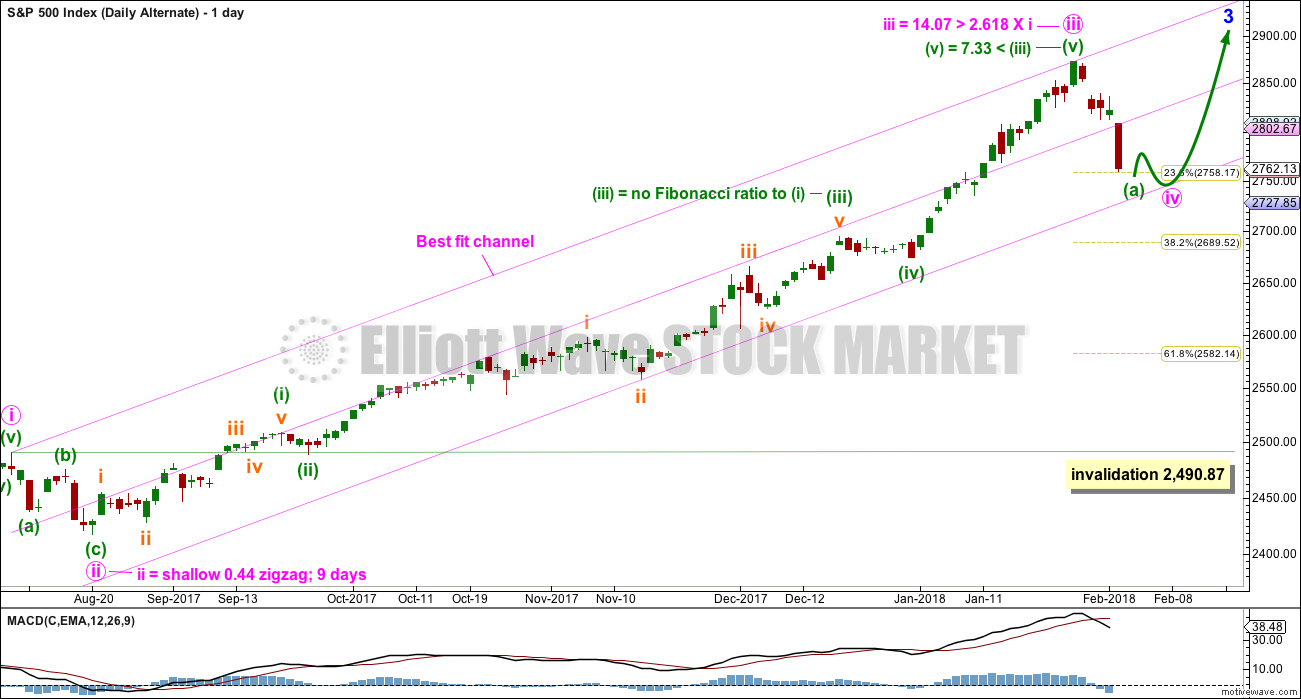
It is possible that minute wave iii was over at the last high. The current correction may be one degree higher for minute wave iv.
Fibonacci ratios for this wave count are fairly good.
The pink best fit channel is the same as the pink acceleration channel on the main wave count.
If the correction is minute wave iv, then it may not move into minute wave i price territory below 2,490.87. But price should first be expected to find support about the lower edge of the best fit channel. If it does break below that channel, then the 0.382 Fibonacci ratio of minute wave iii at 2,690 would be a reasonable target for minute wave iv.
ALTERNATE HOURLY CHART
Click chart to enlarge.
If the correction is one degree higher, then it may be longer lasting.
The strength of downwards movement for Friday looks like it may be a third wave. If that is correct, then the corresponding fourth wave of the same degree may not move into first wave price territory above 2,813.04.
If downwards movement to end Friday’s session is a third wave, then an impulse may be unfolding lower. This may be subminuette wave a. Subminuette wave b to follow may not move beyond the start of subminuette wave a above 2,872.09.
This alternate wave count expects the correction to still likely end about the lower edge of the channel, but it may take longer to get there.
TECHNICAL ANALYSIS
WEEKLY CHART
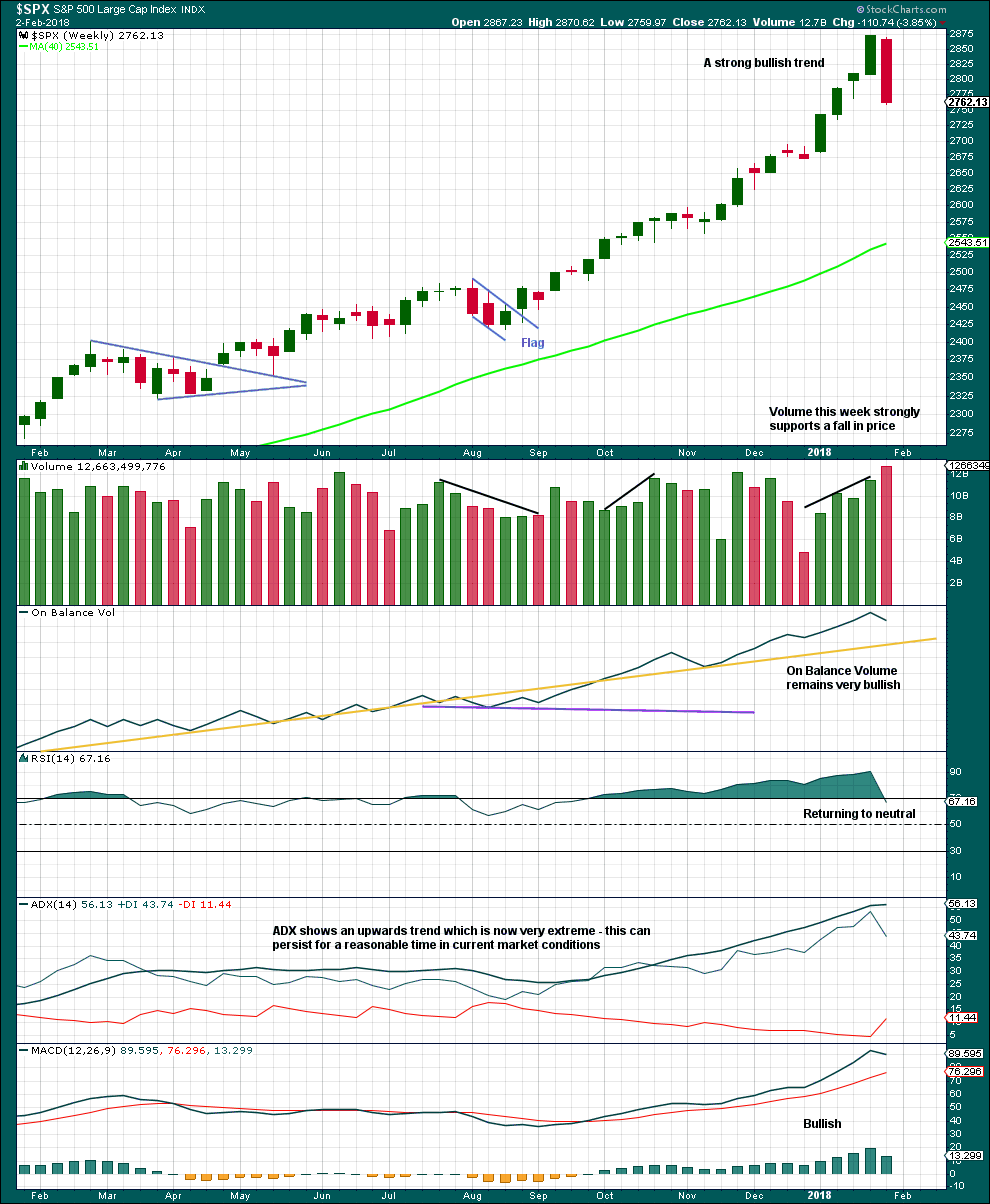
Click chart to enlarge. Chart courtesy of StockCharts.com.
This strong bearish weekly candlestick is not technically a bearish engulfing reversal pattern because the open this week gapped lower. However, the close this week well below last week’s open is very bearish. Support from volume is also very bearish.
DAILY CHART
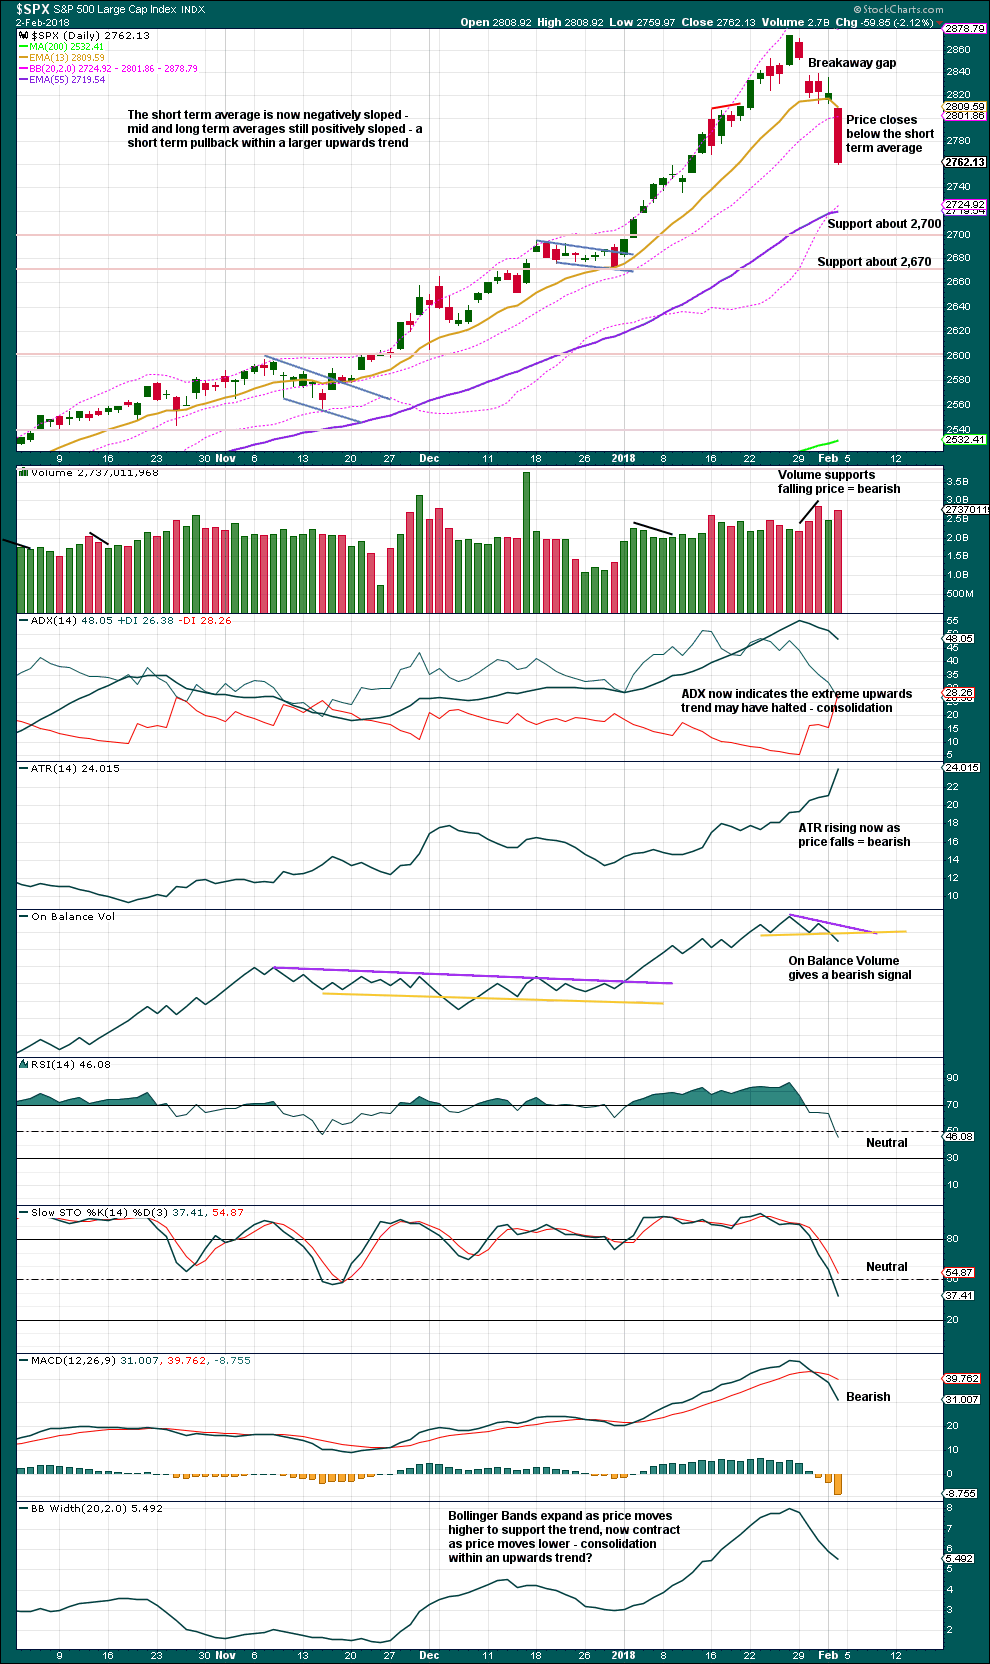
Click chart to enlarge. Chart courtesy of StockCharts.com.
Next support may be at the mid term Fibonacci 55 day moving average.
Volume is bearish. Friday’s candlestick is bearish. On Balance Volume gives a weak bearish signal; weak because the support line was tested only twice before.
If downwards movement continues from here, then it would very likely end if RSI reaches oversold.
VOLATILITY – INVERTED VIX CHART
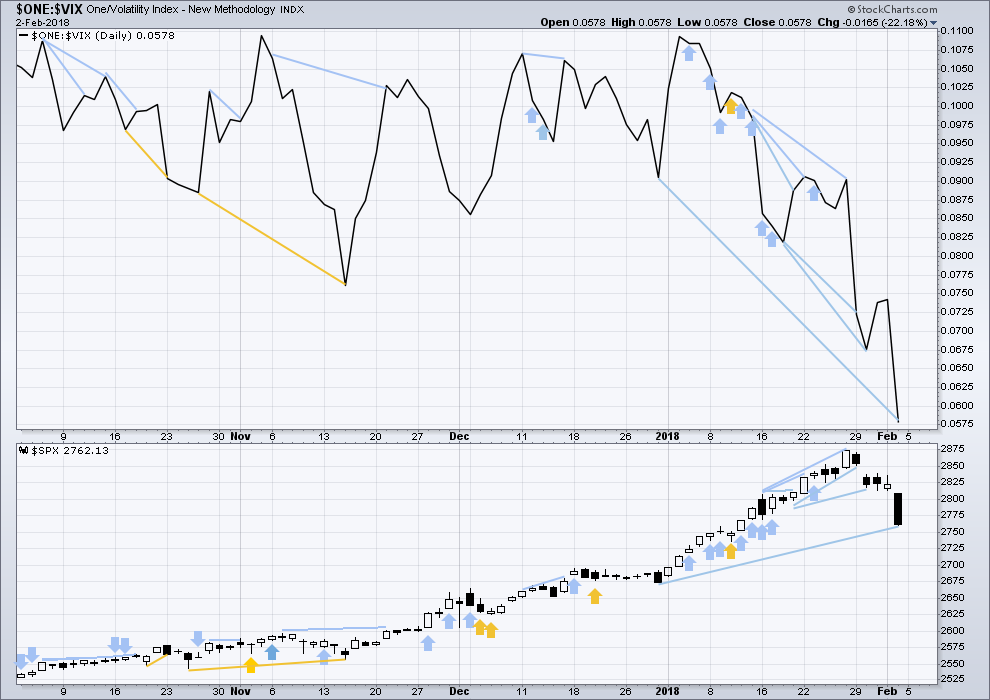
Click chart to enlarge. Chart courtesy of StockCharts.com.
So that colour blind members are included, bearish signals will be noted with blue and bullish signals with yellow.
Normally, volatility should decline as price moves higher and increase as price moves lower. This means that normally inverted VIX should move in the same direction as price.
Volatility still remains much stronger than downwards movement in price suggests. This may be still read as bearish.
There is mid term divergence between price and inverted VIX. This has not been as reliable as short term divergence, but it will still be noted.
BREADTH – AD LINE
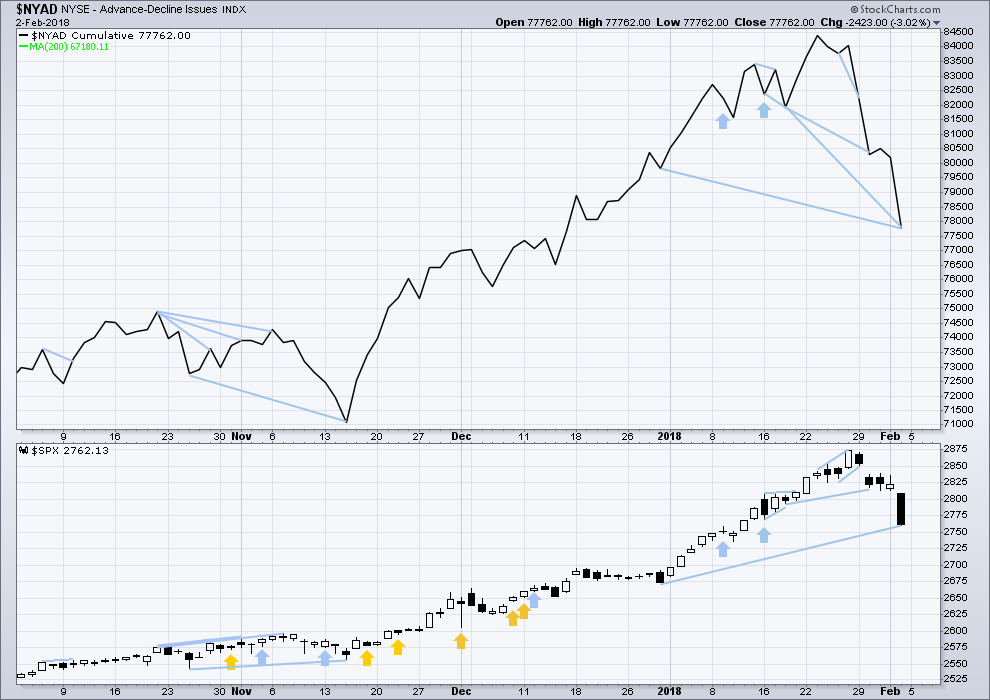
Click chart to enlarge. Chart courtesy of StockCharts.com.
There is normally 4-6 months divergence between price and market breadth prior to a full fledged bear market. This has been so for all major bear markets within the last 90 odd years. With no longer term divergence yet at this point, any decline in price should be expected to be a pullback within an ongoing bull market and not necessarily the start of a bear market.
All of small, mid and large caps last week made new all time highs. This market has good support from rising breadth.
Breadth should be read as a leading indicator.
The AD line has made a new low below the prior low of the 29th of December, 2017, but price has not. This divergence is interpreted as bearish.
All of small, mid and large caps this week made reasonable new lows. The fall in price has support from market breadth. This is bearish.
DOW THEORY
All indices have made new all time highs as recently as three weeks ago, confirming the ongoing bull market.
The following lows need to be exceeded for Dow Theory to confirm the end of the bull market and a change to a bear market:
DJIA: 17,883.56.
DJT: 7,029.41.
S&P500: 2,083.79.
Nasdaq: 5,034.41.
Charts showing each prior major swing low used for Dow Theory are here.
Published @ 07:00 p.m. EST on 3rd February, 2018.
The freakish short vol trade appears to be unwinding overnight. This is all very sad. Take a look at XIV and SVXY. Had I held those puts until tomorrow, I doubt that I would have been able to exit that trade. A lot of reckless traders are going to be ruined. There is not enough cash to anywhere to unwind that trade, and reverse splits are not going to cut it. What was allowed to happen in that space is absolutely criminal. I expect to see the instrument I have moved to explode in the next few days. I have to wonder how much longer UVXY is going be trading as the whole world piles in belatedly.
Truly astonishing. Although I’ve talked to a lot of people who told me XIV would one day go to zero. Looks like tomorrow is that day. Congrats on your moves. I wonder what happens to people holding puts on XIV?
As you like to say though, Verne, dramatic moves imply dramatic counter moves. VIX futures are already trading at a higher level than at any point save for the Financial Crisis and 2011. Unless the market is about to crash 50%+, the reversal is going to be just as ferocious. We could see VIX go to 60 and then crash to 15 by the end of this week.
Thanks Bo. Nothing at all particularly smart about the trades I made. As you probably know, for months I kept looking at what was going on in utter astonishment and wondering if I had gone through the looking glass. It looked to me like a people were still trying to short VIX today, incredible as that seems. What is happening with those ETNs represents a massive piling into VIX futures to try and hedge downside risks in equities as well as compensate for the massive short vol trades some of these folk are in. The complete collapse of these instruments is clear evidence of not enough takers on the other side of that trade and a lot of folk are going to be trapped. Keep in mind that VIX price action does yet even reflect what is going on in futures so you can imagine what is going to happen in the next thirty days!
BTW, XIV does not offer options. You have to own the shares or sell them short to trade them. Anyone holding shares overnight is going to take a serious hair-cut. I do not know if people were allowed to use margin to buy these shares…I hope not!
I had a STB a small position in XIV today. Price dropped away and I canceled the order. Close call!
XIV is at $15, and most likely will be liquidated, per the prospectus (on any drop in a day of more than 80%). CHRIS you called this one months ago!! I’m clear of it; I hope all members are. The ripple effect tomorrow could be something to behold. SPX down 1.3% overnight trading at the moment. I’m close to flat; whew. I wish all the best tomorrow. It could get violent.
Sometimes it’s no fun being right. But math is math. In my humble opinion this is just opening up……
I hear ya. I should be happy, but deep down I am not. A lot of people are going to be very badly hurt by all this. And you are right; we are just getting started….
You all see what is going on in futures already?
Holy Crap! Buy Gold and Silver + miners!
4pm EST: 2644
4.5 hours later…. 2550.
Wowwwwwwwwwwwwwwwwwwwwwwwwwwww
What we are seeing Joseph is RTM with a vengeance. The longer and farther the deviation, the more violent the return. The fact that we failed to bounce at the 50 probably means the next stop is the 200. I suspect most experienced traders saw this coming and got positioned. I have newfound great respect for the VIX TWS signal! I would not be in the least surprised by a reversion THROUGH the mean…
Right now…
UVXY at $27
VXX at $59.60
$33.45
$35.81 $64.90
XIV hit a low of $27.43 AH’s now 28…. wasn’t that just above $130+?
Holy Crap! Buy Gold and Silver + miners!
XIV $19 ………… Wow! BTW it closed today at $99
It’s gone. Both SVXY and XIV are being liquidated as we speak.
It just seems that way. You just watch. There will be a herculean effort to revive the animal spirits. And there will be no shortage of willing partcipants. We are probably going to see a furious retrace to Friday’s gap. If that does not begin tomorrow, we are heading straight for the 200 day SMA before we see our first meaningful bounce….then, probably the “slope of hope”….
Both DJI and SPX are sporting long lower wicks on the 15 minute charts so deep pockets are certainly trying to stem the tide. If we take those lows out overnight the bounce is going to delayed it would seem.
I had a feeling considering what the banksters have been doing all these years that we were not going to get a correction, but a collapse! I know, I know; shut up already about it…just saying…. 🙂
Hi Lara with todays action are you going to revise the wave count?
Oh yes.
I’ll move the degree of labelling up one, and I’ll look at the outside possibility that intermediate (4) may have arrived a lot earlier than expected 🙁
I’m thinking this could be intermediate 4
this has to be at least minor 4
The risk parity trade has been blown up. Period.
Now I know why Franceso pushed out that alert. Those guys have proprietary stuff they don’t talk about and that missive was more than unusual. Now I get it!
Geez, and I thought the football game yesterday was good!!
Kevin,
Did not like the way few calls were made but indeed a good game from both teams. Now have to wait for few month for the season to start and see where the teams are..
Let me say right now RR…THE NINERS ARE BACK!!!! Expect some new competition at the top.
I am long time Niners fan and felt bad for Kapernick…now they are looking good with gift from Patriots…
That felt like a FLUSH!
Will it circle around and flush again?
Verne,
Hopefully you took advantage of huge drop…looked like some big fish liquidating a large position to cover leverage…
Are you kidding???!!!! 😀
No, that was etf create/re-deem process breaking, which is why the DJIA went a lot further then the others. Margin calls won’t happen for awhile, and they occur overnight in most cases.
DOW Down 1540….
50 min to go… holy crap!
Old man said when you see it you will know it.
I think the short vol cohort are beginning to feel the “rythm, feel the ryhme” with all due respect to “Cool Runnings!” 🙂
We did have relentless Hindenburg Omens so we really cannot say we were taken by surprise now can we?
Wham bam!!!
Now I see TMV taking at the 5 minute and hourly level. and the markets just keep…selling…off… Wow. Wow wow wow…what is this, a blow-off bottom now???
It should go down to pay its respects to the 200 day SMA then, farewell and adeiu….!
Wow…back to back 700 point drop…..markets very nervous about something and doesn’t look good for the incoming FED chair…
Could it be the “Old Man” had it pegged right after all?
Well, his count was clearly incorrect so I think we probably revisit the highs…we still cannot discount a possible fourth imho…
This decline strikes me as being more robust than the cycle four plunge so of course we cannot be dogmatic. VIX did clear 50 back then so we will see…
Well, still no bounce. Almost impossible to fathom but this could quite possibly be the end. Dow has given back everything it gained YTD, and SPX is close to getting there. VIX higher than it was after Brexit. Even if we do see a decent bounce, the technical damage here is immense.
SVXY March 130 puts now bid at an incredible 38.10. Egad!
Should I stay, or should I go??!!
If we still have a C wave down they are probably going a lot higher!
I think I will just put in a tight contingency trailing stop and let ‘er ride!
take em and re-load.
Could you please help with this wheel-barrow??! 🙂
Sold ’em for 50.00 even. Unbelievable!!!
hahahahaha, congrats. Never made so much money in one day!!!
The selloff is reaching ludicrous proportions at this point. VIX is higher than it was before the 2016 election and nearly as high as Brexit (+40% for the day!!!). Does anyone here but Verne think this is really the end? 6% off all time highs and counting. We’re well over halfway to correction territory. If this is what the market looks like when all the economic indicators are positive, what will happen when they reverse???
I’m now rather suspicious that the initial 5 wave move down is not complete yet, that this is completing (eventually here) the 3 down (I think Verne was suggesting this earlier). The Jan 30-Feb 1 action was the 2. So a 4 up is to come, then a 5 down to deeper lows, THEN a B bounce, THEN a C down to finish this minor 4. Completing a multi-week pullback. “Healthy”, I guess.
This is Lara’s count below with the exception that I’m seeing the 5 down as still in the 3, while Lara’s counted it as now in the 5. She’s usually right.
Nice Kevin, thanks for sharing. Of course it is “Healthy”, what’s gone on the last 9 years is not. Time to pay the Piper. Stocks need to go done 30% to be buyable based on fundamentals.
Yes, I’m going to have to consider the possibility I need to move my degree of labelling up one more, it could be minor 4.
I still think it is extremely unlikely to be intermediate (4).
And as for the possibility that cycle V in its entirety could be complete…. very extremely unlikely. The structure is incomplete. You’d have to see a primary wave 4 over in just a couple of days, compared to 10 weeks for primary 2. That would have all kinds of the wrong look.
Not gonna say it’s not possible, because the market can do whatever it wants. But it would look completely wrong. Even the S&P with its sometimes awful proportions is almost never that bad.
But minor 4? In the realms of reasonable possibility. Minor 2 lasted 4 weeks. Minute ii lasted 2 weeks. So minor 4 may be expected to last around about 4 weeks, and minute iv around about 2 weeks. So whether this is minute iv or minor 4 does not make a huge difference in terms of duration, only a difference of a couple of weeks.
Anyway, there now looks to be an impulse lower complete. Looking for a B wave bounce now. The orange Elliott channel may provide support here for subminuette v. If / when the channel is breached by upwards movement then look for minuette (b) to continue higher / sideways. It may last a few days, choppy overlapping movement. I’d expect that breakaway gap at 2,851.48 to 3,837.45 to offer strong resistance.
Interestingly, this mornings gap is closed and so now looks like an exhaustion gap.
Lara,
Thanks for the update. Target of 3,837.45 would mean an unreal stock market ramp that is going to cause pain to lot of shorts. I wouldn’t mind to sit and hold tight for a rally to that level..
Buying a few hundred DIA 260 calls for B bounce… 🙂
I could be wrong about this folk, but that higher move in VIX does to me leave open the possibility that we just had a five of three complete…
And I as well, it’s very nice to see the destruction of the short vol trade begin.
This market is starting to look truly ominous.
It cannot muster any kind of bounce and simply continues to head South. I unloaded half my calls as I think we are not quite done. In fact if we only had a fifth of three we could still get a very nasty continuation to the downside in another impulse.
I used to go on Ad Nauseam about the persistent extremes in this market as it continued its bullish run.
Why would we think the same thing could not happen to the downside?!
I suspect the banksters are starting to notice the same thing and are probably going to toss some temporary relief the market’s way soon….
I’d say we are pretty oversold for sure, but it screams trend change to me.
Looks like today’s move up was indeed just the 4 of the 5 wave down. And yea, now I’d say this is most likely merely an A of a larger ABC down. This is minor 4 land now, at a minimum. 2721 is my next fibo down, then 2674.5.
My what a little change in interest rates can do to sentiment!! It’s not a linear system, that’s for sure.
This is so much fun, idiots getting blown out all over the place!!!
The short volatility cohort is REFUSING to unwind!
In all my years of trading I have NEVER seen such insanity.
Only the totally clueless would have failed to heed the warning of the gap up open this morning as savvy traders got out at the market price. VIX could continue to administer some serious pain here. Wow!
Now they are going to assume the corrective bounce has handed them a victory for “hanging tough” as the executioner sharpens his sword….can anyone believe this??!!
We are going to double tap lower B band, THEN, off to the races! 🙂
Years of Pavlovian conditioning on stark display! 🙂
VIX needs to make a lower high…if it does not, well, you know…! 😉
Not trading advice…BUT, if VIX so happens to bounce off its 200 day MA in the next few days…..BUY IT!!!!!!! 😀
You gotta mind the gaps people! 🙂
Look for a lower high in VIX on final move down. A new high means a third wave continuing…and that would be very serious folk…
If the intentions are to catch some shorts on the wrong side of the trade, banksters will ramp the markets in afterhours usin futures. The current moves are to entice more shorts to jump in..a snap back will be fast . Margin calls got dealt with today so..calmer tomorrow and then news driven market…JMHO
Or it’s just wave 1 of the largest bear market in man kinds history…..
You don’t say…!!!!! 🙂
This is not what margin capitulation looks like. Maybe later. Traders do have 30 days so I suspect they are holding on.
I think you are right about a futures ambush though.
Expecting a new ATH arounf March mid to late and then bear market drop that will last a while but you never know
Possibly. Smart traders know that even if we have a big trend change, a sharp second wave will precede the start of real fireworks. Mr. Market will show his hand with the mother of all red candles when, AND IF, they head out of Dodge.
Taking triple on TMV.
Looking for brief retreat to support at 13 day MA. Wow!
This thing is a BEAST!
There’s the potential for a massive TMV move here, says the weekly chart to me. Deserves some serious trading focus, oh yea! And if you look closely you’ll see some red dots on a few of the last couple of weekly bars: those represent volume spikes, strongly supportive of a emerging bull trend.
YesSiree! 🙂
This is a macro economic trade with huge potential indeed.
Many things are very different today I’m afraid…. 🙂
Gap area proving resistance so for. Interesting the crowd’s not jumping on the reversal as they usually do…the banksters are simply going to have to do more…it would appear! 🙂
You really think this is a 4 rather than a 1? What is your downside target in that case? I know it’s no secret you are long term bearish, but all of Lara’s analysis up to this point indicates market internals are still strong. I don’t think anyone has this move pegged as the end. We’ve seen a 4.8% decline already. How much more downside is there? 6%? 10%? 99.9%?
I have no idea Bo. I just try to trade what I see… 🙂
The question of whether an ABC 4 completed (hourly main), OR only an A completed (hourly alt), can only be answered through further price action. I think the downmove makes more sense as an ABC structure myself. But only future price action can tell. I do think this pullback is 100% consistent with a new 5 wave launching; there’d likely be 2 (or more) such initial 1-2 thrusts and retreats before getting into 3 up action. So I WILL TAKE THIS LONG, and use aggressive rising stops to protect against the very real possibility that I’m going long on a B wave.
You can still scalp a B wave, imho, if you are nimble…. 🙂
Market looking very weak. This could be a fourth wave bounce…
Even if this is a corrective bounce, it should last a few days and pay some coin on bullish trades. Having said that, tremendous technical damage has been done the past few days, and sentiment suggests that a visit to the 50 day, and possibly the 200 day MA is in order….
Anybody remember Aug 29??? In the middle of a large 4 (possibly a primary 4 just getting started was the view), a gap down open, a push up, a slight pause after closing the gap, then straight up for 3+ days, and virtually straight up ever since. This day reminds of that one…so far.
Many things are very different today I’m afraid…. 🙂
We should at the very least probe this morning’s gap down on any bounce. A strong reversal there means more droopage…
ATH incoming.
“5% discount, yes please”.
Hit Below Target of 2749… so it should turn up soon.
1st 5%+ correction is now in the bag!
Maybe…but I don’t hear any fat lady singing yet. The current low is right at a 100% fibo, so in my book it has potential legitimacy. But the proof is in the price action, which is TBD for today in general. Next fibo down that I have is about 2721, a 76.4%, and after that, all the way down to 2675, another 100%.
I’ll add that the lack of any real upward push right out of the gate is not good for the bulls, IMO.
Mind the gaps! 🙂
Gaps filled in SPX, NDX, RUT and INDU. But now a 2 or…continuation of the bear trend? We’ll see… I keep reminding myself here of the old maxim, “Ready! Aim! Aim! Aim!…..” re: establishing larger long positions.
A looks completed, time for a B bounce
…OR….a second wave! 🙂
This is now looking impulsive to the upside. Where’s the 2??? I want to see a 2 and I want to see a 2 hold above the morning’s low.
Here is a good treatment of the impact of ten year yields on SPX. Note the directional charts. The banksters have met their match in this arena and not too many folk have figured that out.
https://www.zerohedge.com/news/2018-02-05/vix-tops-19-hindenberg-strikes-how-worried-should-you-be
A rare VIX event in the form of a pre-market gap higher. We all know what that implies (pun intended). 🙂
Here is another intetesting thought about the absence of a lower wick thus far. It shows a lack of real selling pressure. I know this sounds strange considering how much the market has fallen. We did for example, see numerous intra-day attempts to short VIX and long upper wicks did appear. Those would-be short sellers paid dearly for their hubris, as VIX powered higher in the face of those attempts. We saw no such long lower wicks in SPX, but a steady, almost “nanaged” decline, suggesting a market falling under its own weight. The recent parabolic rise means that all it takes for a sharp reversal is for the buying to end, even in the absence of agressive selling. This evening should be quite enlightening.
If wicks start appearing intra-day that get negated that would suggest sellers starting to flex some muscle in the face of attempts to stem the decline.
The last time we saw a candle this large was at the start of cycle four in August of 2015. That month VIX hit its highest level since the financial crisis at 53.29. Friday’s plunge was the biggest one day decline jn ten years. Clearly there is no significant unwind of the short vol trade. Not even close. Chris was wondering why the banksters were not buying on Friday. Who said they weren’t?! 🙂
Verne,
Typically VIX trading above the future contract values indicates a very good short term bottom. We saw this behaviour in Friday. Expecting some margin related selling on Monday though.
Usually it has of late. Somebody opined that the FED release of its 2012 notes regarding its short vol position was a tell that they were exiting. SVXY March puts have turned out to be my best trade this year snd it looks to me like they are not quite done. I think we need to be very careful with this market and keep in mind the extraordinary circumstances of its behaviour. It has long been my own thesis that the banksters were hell-bent on preventing the market from correcting because of what they knew it would do to the freakish leverage in the market. I think the fact that it is now correcting is a game changer and may in fact be due to something they cannot control that has hit an inflection point, and that of course is short term intetest rates. Nobody predicted this dive. Fewer seem to be taking it seriously. I think it warrants great caution, all things considered.
Looking for long ViX upper wick.
Caution sounds right to me. Charts are ugly. No rush; a new impulse up will form. I might dabble at key decision trend lines and fibos should some buy triggers fire, but I’m holding on my strategic cash for a daily (even weekly) level trigger. There will be plenty of room to rumble to the upside once some 5 action starts up.
Not in a downtrend, and further, backwardation will be magnified to upside by the VIX etns.
Foist, wabbit!
No yer not Doc…I was wearing my invisible coat, see?