
Price continues to move sideways in a very small range, which at this stage fits the alternate Elliott wave count better than the main Elliott wave count. Both wave counts remain valid.
Summary: Price may move sideways this week. Thereafter, it should break out upwards.
The first target is again at 2,614.
Always trade with stops and invest only 1-5% of equity on any one trade.
Last monthly and weekly charts are here. Last historic analysis video is here.
MAIN ELLIOTT WAVE COUNT
WEEKLY CHART
Click chart to enlarge.
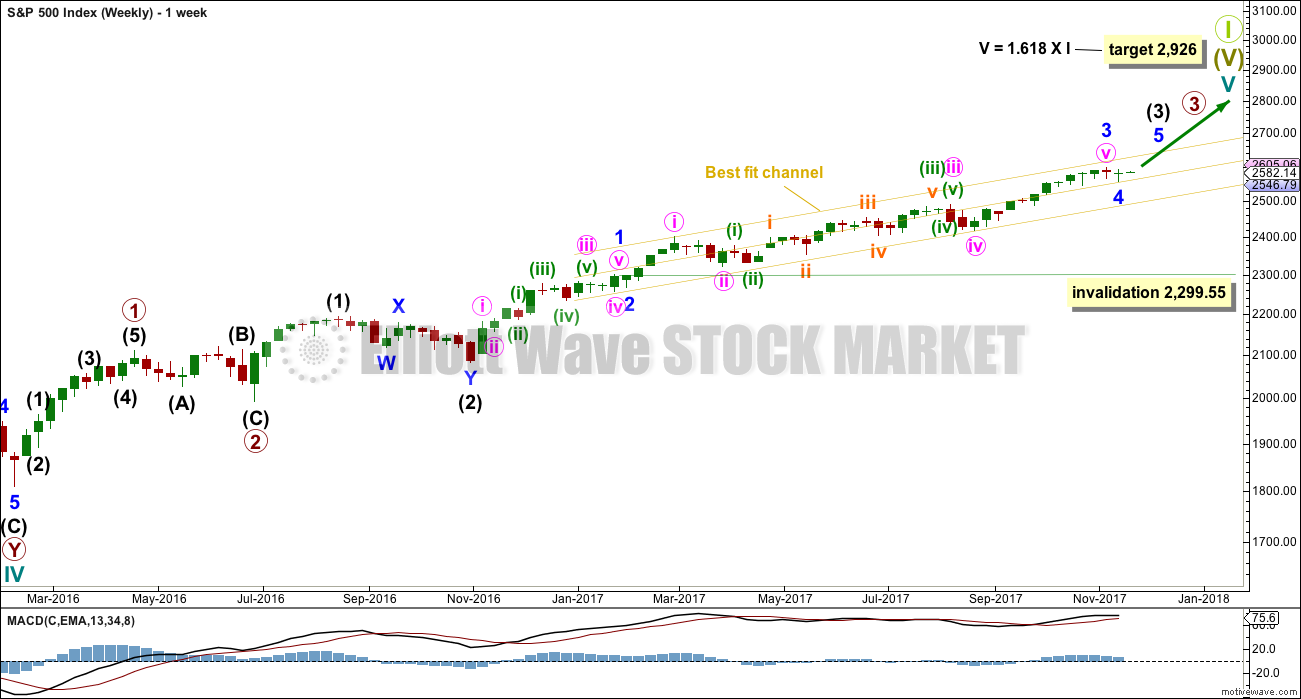
Cycle wave V must complete as a five structure, which should look clear at the weekly chart level. It may only be an impulse or ending diagonal. At this stage, it is clear it is an impulse.
Within cycle wave V, the corrections for primary wave 2 and intermediate wave (2) both show up clearly, both lasting several weeks. The respective corrections for intermediate wave (4) and primary wave 4 should also last several weeks, so that they show up at weekly and monthly time frames. The right proportions between second and fourth wave corrections give a wave count the right look.
Cycle wave V has passed equality in length with cycle wave I, which would be the most common Fibonacci ratio for it to have exhibited. The next most common Fibonacci ratio would be 1.618 the length of cycle wave I.
Intermediate wave (3) looks incomplete. It may only subdivide as an impulse. Within intermediate wave (3), minor wave 4 may now be complete. If it continues further as per the alternate wave count below, then it may not move into minor wave 1 price territory below 2,299.55. However, minor wave 4 should remain contained within the yellow best fit channel if this wave count is correct.
DAILY CHART
Click chart to enlarge.
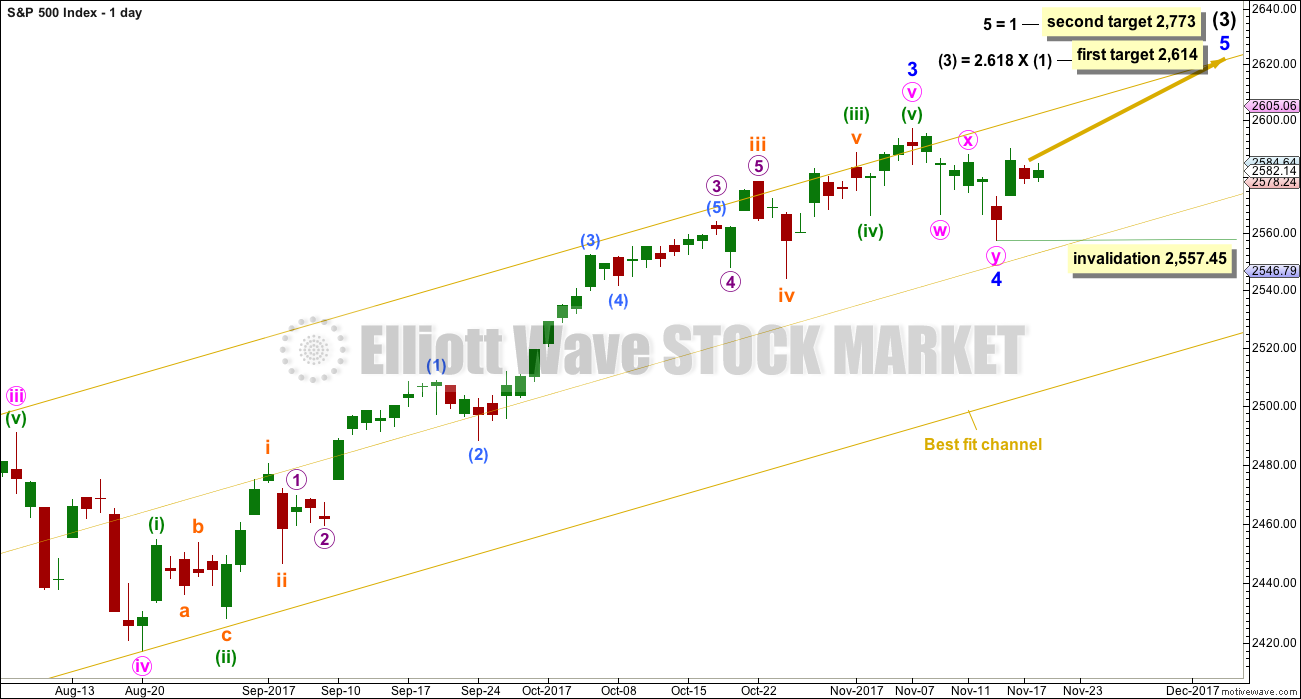
Minor wave 4 may now be complete. It will subdivide very well as a double zigzag. This provides only a little alternation in structure with the single zigzag of minor wave 2. There is also poor alternation in depth: minor wave 2 was very shallow at only 0.16 of minor wave 1, and minor wave 4 would be only 0.12 of minor wave 3. Alternation is a guideline and not a rule; it is seen more often than not, but not always.
The first target at 2,614 would see a Fibonacci ratio between intermediate waves (3) and (1), but no Fibonacci ratio for minor wave 5. This would be acceptable. There is already a somewhat reasonable Fibonacci ratio between the two actionary waves of minor waves 3 and 1, so minor wave 5 may not exhibit a Fibonacci ratio to either of minor waves 3 or 1.
The second target calculated for minor wave 5 expects it to exhibit the most common Fibonacci ratio for a fifth wave. This target would not expect a Fibonacci ratio for intermediate wave (3) to intermediate wave (1).
If price gets up to the first target, and the structure may be complete and there is some divergence with price and Stochastics or RSI, then members are warned that it would be possible for a high to be in place for the mid term. But if price keeps rising through the first target, then the second target would be used.
The first target may need the degree of labelling at the hourly chart level to be moved up one degree.
Within minor wave 5, no second wave correction may move beyond the start of its first wave below 2,557.45.
HOURLY CHART
Click chart to enlarge.
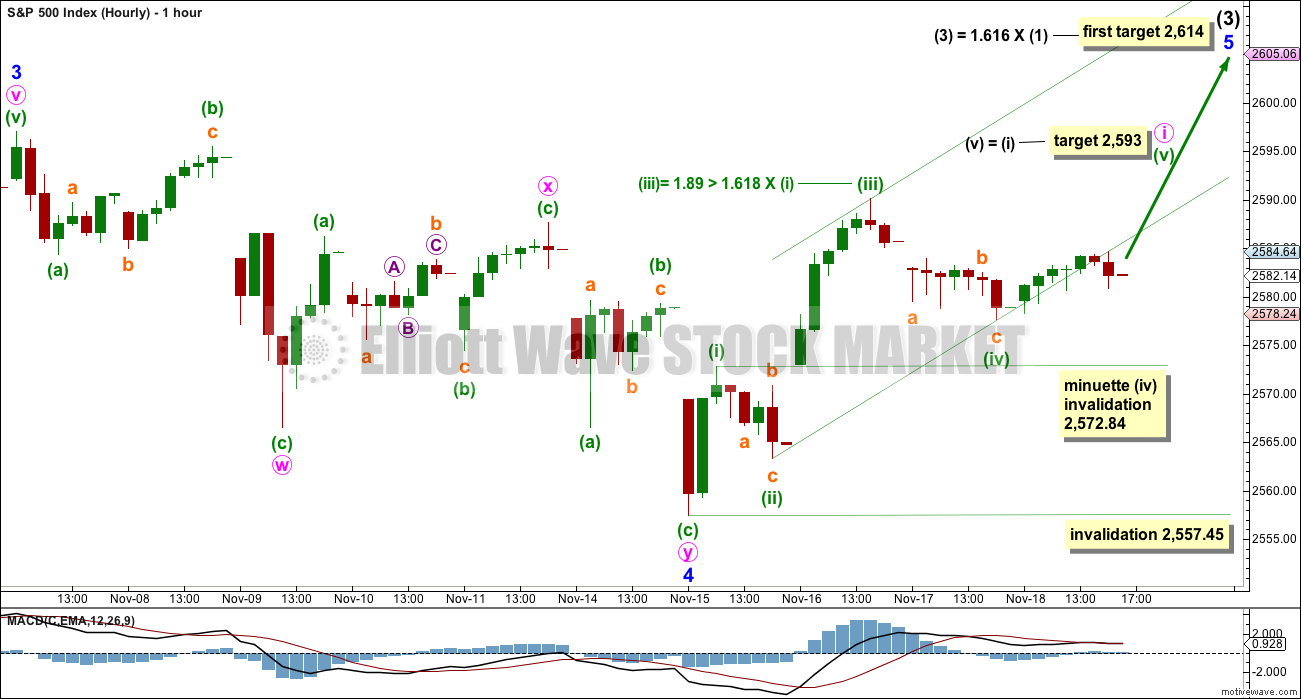
If a low is in place, then a five up on the hourly chart should develop. This is not yet complete.
Within the first five up, minuette wave (iv) may not move into minuette wave (i) price territory. When a new high is seen above today’s high, then a five up could be complete at any time.
When fourth waves breach channels drawn using Elliott’s first technique, then the channel must be redrawn using Elliott’s second technique: draw the first trend line from the ends of minuette waves (ii) to (iv), then place a parallel copy on the end of minuette wave (iii). This channel may be used to show where minuette wave (v) may end, either mid way within the channel or at the upper edge.
At this stage, at the end of Monday’s session price is no longer contained within this channel. Unfortunately, the S&P does have a tendency to breach channels but then carry on in the prior direction. It does not always respect Elliott channels. The breach of the channel is another warning that this wave count may not be correct, but it cannot invalidate this wave count.
If price remains above 2,572.84 and makes a new high above the end of minuette wave (iii), then a five up would be complete at the hourly chart level. That would offer strong confidence to this main wave count.
Minute wave ii may be relatively shallow and brief; although this is not common, members are warned that it has happened before: corrections in the beginning were brief and shallow at the start of minor wave 3.
Minute wave ii may be a more common deep second wave correction. The 0.618 Fibonacci ratio of minute wave i would be the preferred target.
Minute wave ii may not move beyond the start of minute wave i below 2,557.45.
ALTERNATE HOURLY CHART
Click chart to enlarge.
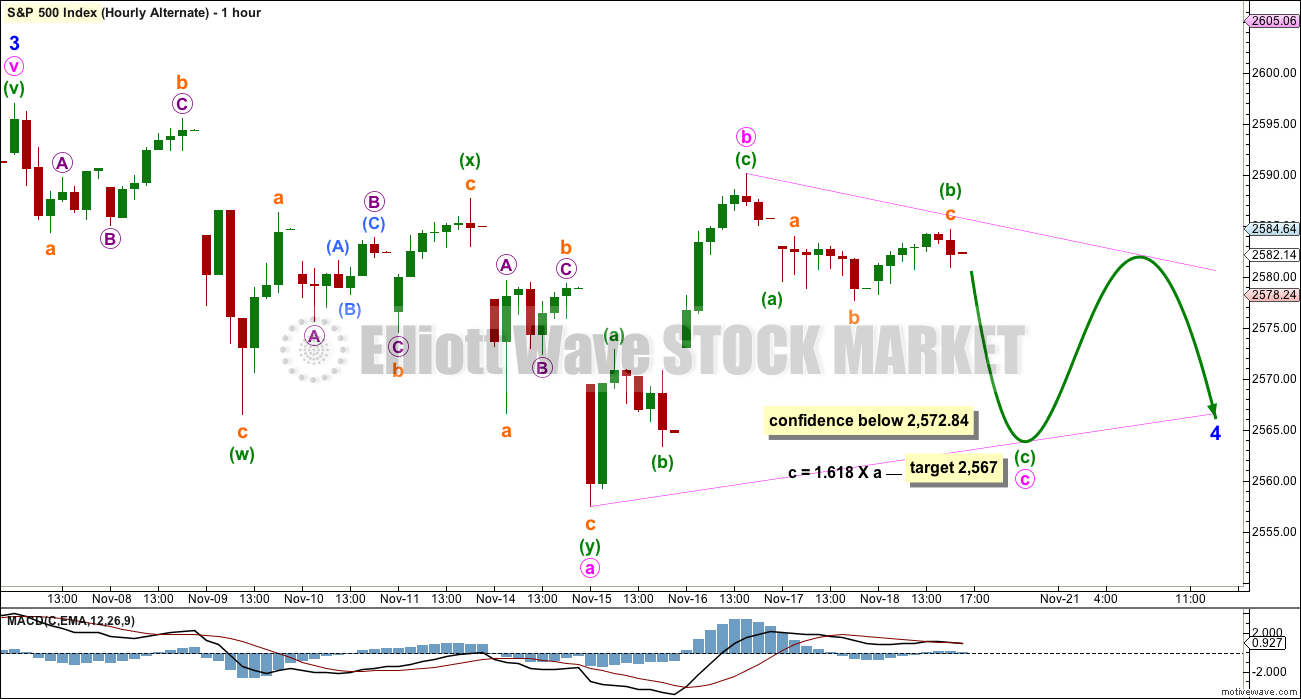
By simply moving the degree of labelling within minor wave 4 down one degree, it is possible to see that it may not be over and may continue sideways for a few days yet as a triangle or flat correction.
Here, minor wave 4 is labelled as a possible triangle. This looks at this stage to be the most likely alternate scenario.
Within a possible triangle, the first sub-wave of minute wave a fits best as a double zigzag. If this labelling is correct, then all remaining triangle sub-waves must be simple A-B-C corrections, and all but one must be single zigzags.
Minute wave b within the possible triangle would have to be complete here. It cannot move higher as a double zigzag because only one triangle sub-wave may be a more complicated multiple.
Minute wave c may not move beyond the end of minute wave a below 2,557.46.
Minute wave c should be an obvious three wave structure at the hourly chart level. Within minute wave c, minuette wave (b) fits very well as an expanded flat correction. This part of recent movement has a better fit here for the alternate than it does for the main wave count today.
Minute wave d to follow upwards may not move beyond the end of minute wave b above 2,590.09.
Minute wave e downwards to end the triangle may not move beyond the end of minute wave c.
The triangle may take another four days minimum to complete, if it totals a Fibonacci thirteen days.
What about a possible flat correction for minor wave 4?
This is the other possibility, but it looks less likely at this stage. Within a flat, both minute waves a and b must be three wave structures. Minute wave a can be any structure except a triangle, but A waves within flats are most commonly zigzags. The next most common structure for them would be a flat correction. They are uncommonly double zigzags.
Minute wave b within a flat correction would have to move higher as a double zigzag to reach the minimum requirement of 0.9 the length of minute wave a at 2,593.06. The most common length for minute wave b would be from 1 to 1.38 times the length of minute wave a, giving a range of 2,597.02 to 2,612.06.
While it is possible for both minute waves a and b to be double zigzags, it is not a common occurrence, and for that reason it is not charted today.
What about a possible double combination for minor wave 4?
If the downwards wave labelled here minute wave a is correctly labelled as a double zigzag, then a combination continuing sideways for minor wave 4 may be eliminated. The maximum number of corrective structures within a multiple is three: this refers to W, Y and Z. Within each of W, Y and Z, the structures may only be labelled as simple A-B-C corrections (or A-B-C-D-E in the case of triangles). To label multiples within multiples is to increase the number of corrective structures beyond three, violating the Elliott wave rule.
TECHNICAL ANALYSIS
WEEKLY CHART
Click chart to enlarge. Chart courtesy of StockCharts.com.
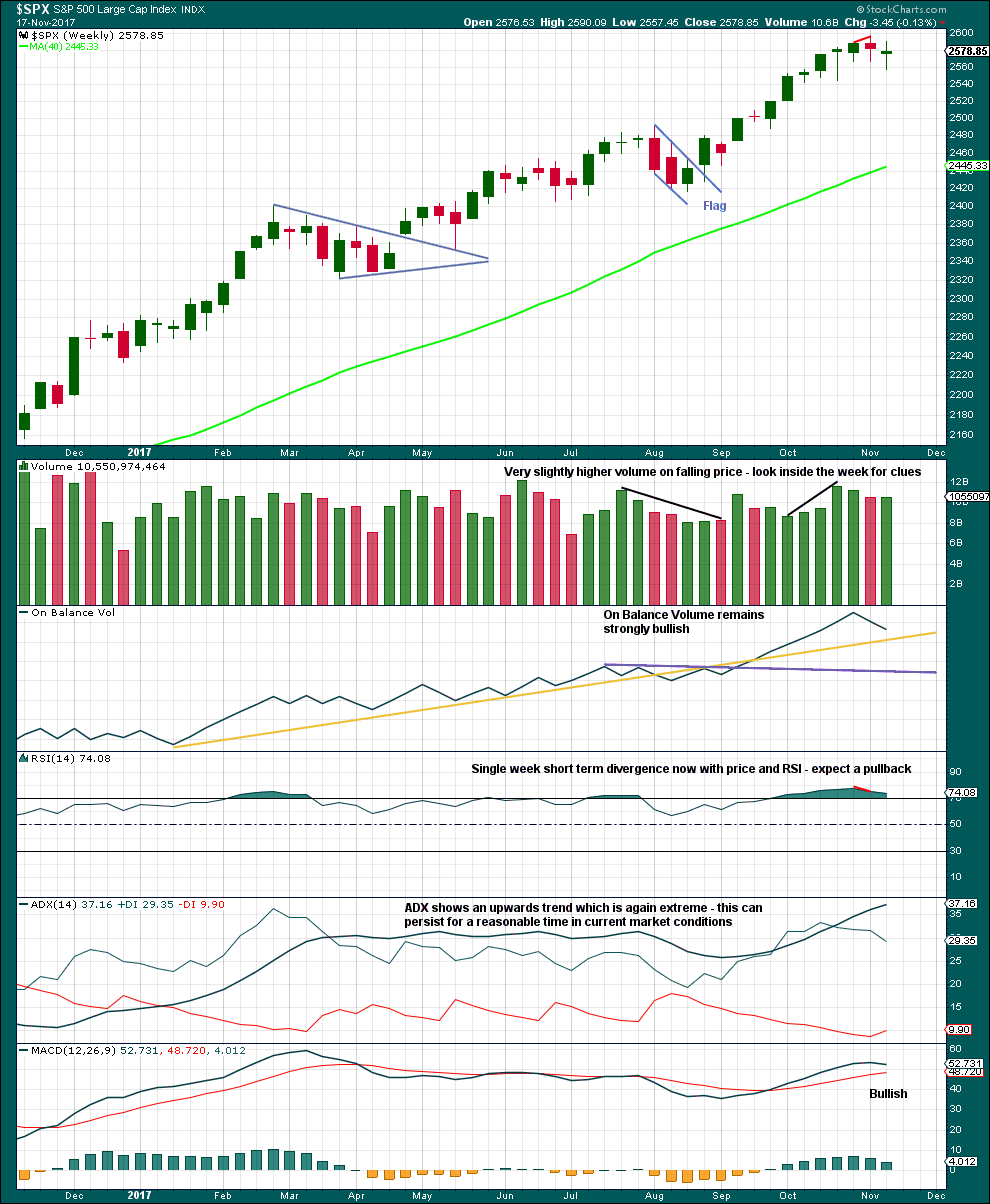
A small range, downwards week completes as a small doji. This indicates a balance of bulls and bears and indecision. At this stage, this small week does not look like a convincing beginning of a new downwards trend, and looks much more like a small pullback within an ongoing upwards trend that should be used as another opportunity to join the trend.
There is a little distance below before On Balance Volume finds support. It is entirely possible that the pullback is not over.
DAILY CHART
Click chart to enlarge. Chart courtesy of StockCharts.com.
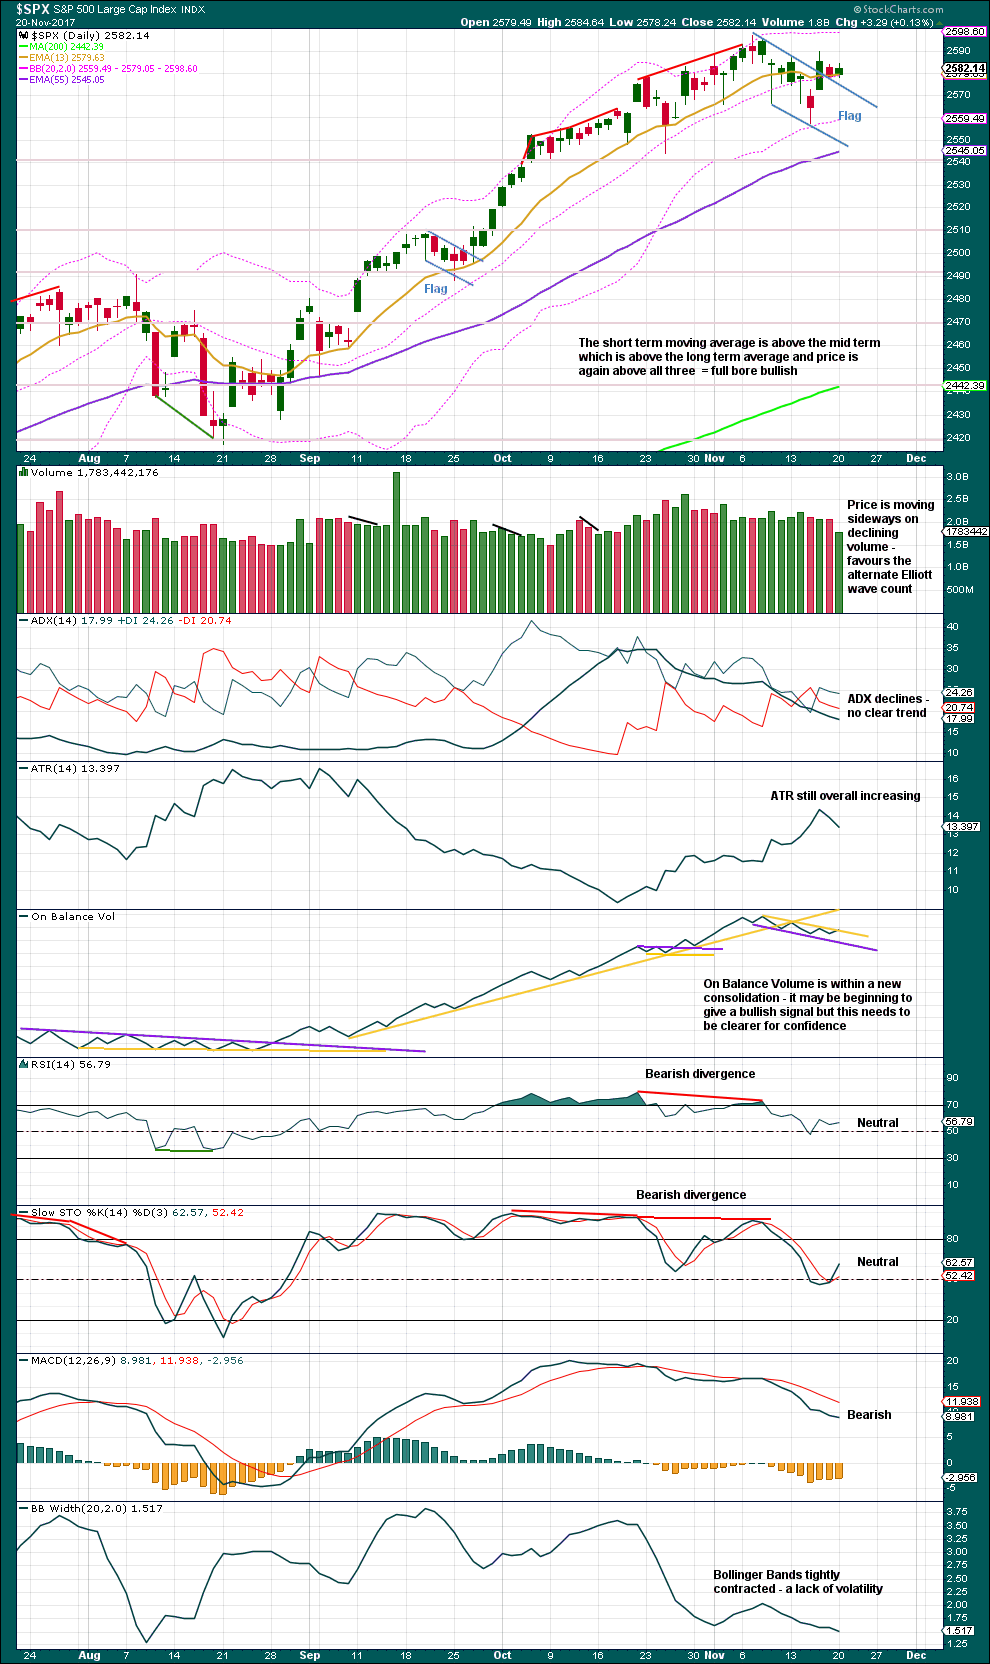
On Balance Volume may be giving a bullish signal, but so far today it is too weak for confidence. If tomorrow prints another upwards day, then the signal from On Balance Volume would be clear and would offer reasonable support to the main Elliott wave count.
If On Balance Volume moves lower tomorrow, then the resistance line would need to be redrawn.
Declining volume is a feature of Elliott wave triangles, along with flattening MACD and often also declining ATR (for the current possible triangle, this should be seen at the hourly chart level).
VOLATILITY – INVERTED VIX CHART
Click chart to enlarge. Chart courtesy of StockCharts.com.
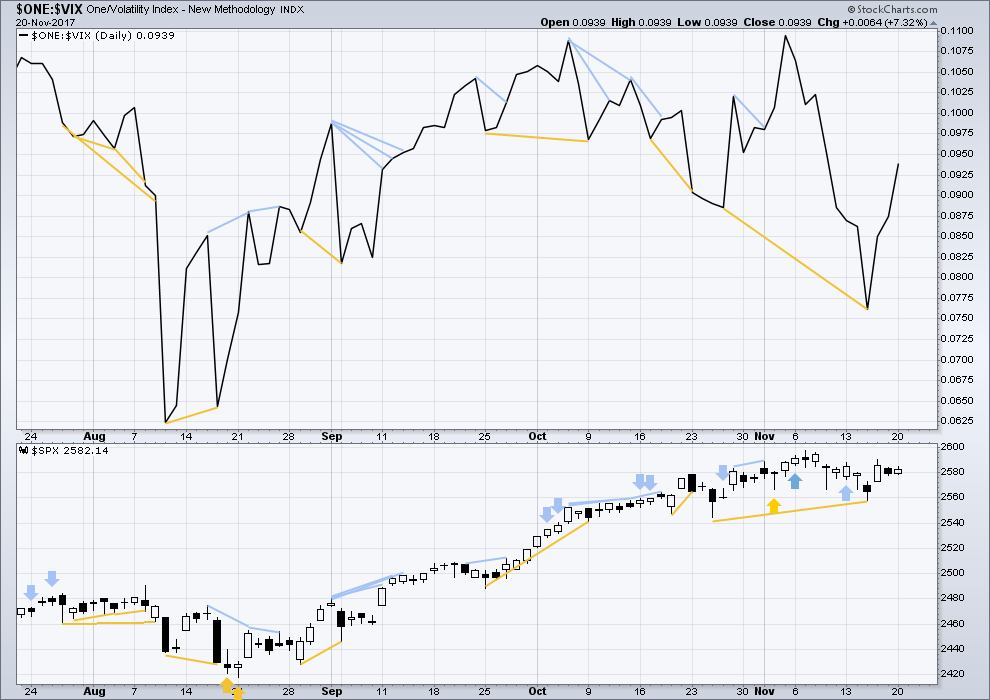
So that colour blind members are included, bearish signals will be noted with blue and bullish signals with yellow.
Normally, volatility should decline as price moves higher and increase as price moves lower. This means that normally inverted VIX should move in the same direction as price.
Both price and inverted VIX today moved higher. Bullish divergence noted in last analysis has now been followed by one upwards day. It may need another upwards day to resolve it, or it may be resolved here.
BREADTH – AD LINE
Click chart to enlarge. Chart courtesy of StockCharts.com.
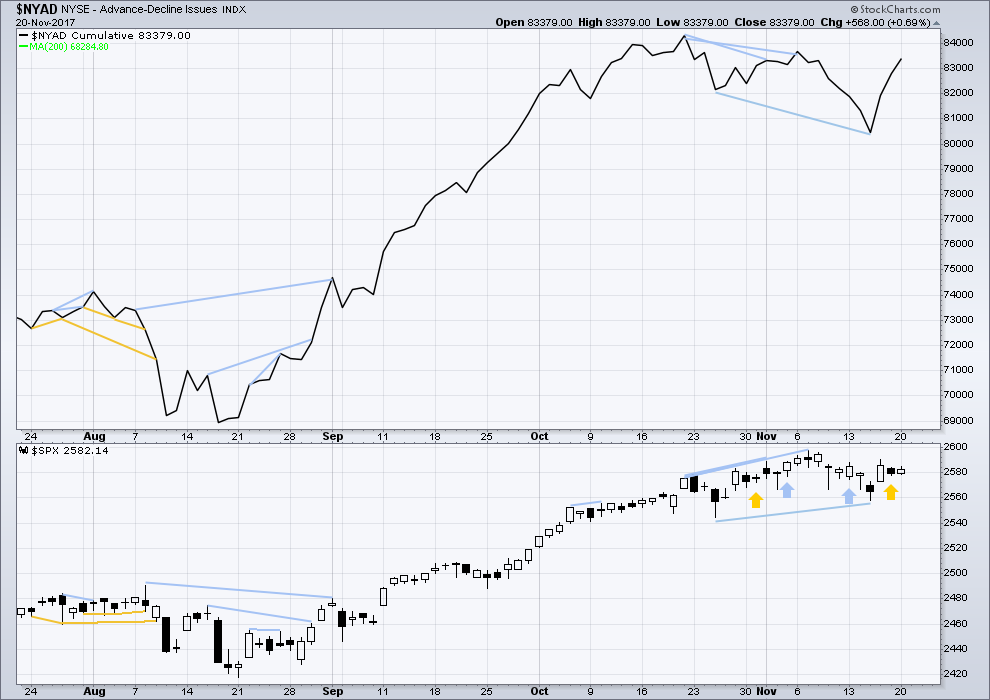
There is normally 4-6 months divergence between price and market breadth prior to a full fledged bear market. This has been so for all major bear markets within the last 90 odd years. With no longer term divergence yet at this point, any decline in price should be expected to be a pullback within an ongoing bull market and not necessarily the start of a bear market.
Mid and large caps last week moved lower, but small caps moved up to make a high above the prior week. Small caps are strongest and may be leading the market at this time.
Bullish divergence noted in last analysis has now been followed by an upwards day. It may be resolved here, or it may need another upwards day to resolve it.
DOW THEORY
Only Nasdaq has made a new all time high this week. The S&P500, DJIA and DJT have not yet made new all time highs.
Failure to confirm an ongoing bull market should absolutely not be read as the end of a bull market. For that, Dow Theory would have to confirm new lows.
The following lows need to be exceeded for Dow Theory to confirm the end of the bull market and a change to a bear market:
DJIA: 17,883.56.
DJT: 7,029.41.
S&P500: 2,083.79.
Nasdaq: 5,034.41.
Charts showing each prior major swing low used for Dow Theory are here.
Published @ 09:41 p.m. EST.
Roll over Beethoven rockin’ in two by two
Roll over Beethoven and tell Tchaikovsky the news
Roll over Beethoven,
Roll over Beethoven,
Roll over Beethoven,
Roll over Beethoven,
Roll over Beethoven and dig these rhythm and blues
EveryBody!
I thought only short people sang that song? At the moment I’m a bit more into Stairway to Heaven, myself!
It tis Balloon! The Levitation is amazing. Then this comes to my mind…
Would you like to ride in my beautiful balloon
Would you like to ride in my beautiful balloon
We could float among the stars together, the market and I
For we can fly, we can fly
Up, up and away
My beautiful, my beautiful balloon
The world’s a nicer place in my beautiful balloon
It wears a nicer face in my beautiful balloon
We can sing a song and sail along the silver sky
For we can fly, we can fly
Up, up and away
My beautiful, my beautiful balloon
Suspended under a twilight canopy
We’ll search the clouds for a star to guide us
If by some chance you find yourself loving one way action
We’ll find a cloud to hide us
We’ll keep the moon beside us
Love one way action is waiting there in my beautiful balloon
Way up in the air in my beautiful balloon
If you’ll hold my hand we’ll chase your dream across the sky
For we can, fly we can fly
Up, up and away
My beautiful, my beautiful balloon
Balloon
Up, up, and away
Happy Thanksgiving to all!
Now just need a pin.
Yes please. The pressure is intense. A pin would be nice.
Can I help? 😀
Yeah, that’ll do 🙂
Now, now, Verne. There is a new sheriff in town and I’d like to see your permit for that gun.
Updated main hourly chart:
For the first target the degree of labelling within minor 5 would need to be moved up one degree.
When the five up is complete (and it is very very close) then I’ll have two hourly charts: one with this degree of labelling, and the other where the degree is moved up one and so minor 5 in its entirety could be complete.
When the five up is complete then look for a three down to follow.
Now to see what the end of session data brings us….
Being a holiday week, we can expect light volume especially tomorrow and Friday.
Figures! Once I pulled my order on those VIX 10.00 strike calls spread “magically” back to 1.50/1.70…I was probably too impatient….
Just in case everything gets moved up one degree, I am buying back my SPY 258 strike short puts for a nice gain. I will be holding long side of put credit spread in the form of the 256 puts expiring next week so hopefully we get at least a 62% retrace and a nice VIX pop…!
Another AWESOME target call by Queen Bee Lara! 🙂 🙂 🙂
ps A close of today’s gap open the next 24 trading hours means time to gorge on more SPY puts…!
Cheers Verne 🙂
I have a really nice little wave count which would see the 2,614 target possibly met nicely.
We have a bullish signal today from OBV. Bullish volume. Bullish ADX and bullish AD line.
The tiny size of this minor 4 (and the corresponding minor 2) keep getting me confused. The size of the minor 3 (and even minor 1) were HUGE compared with the sum total of action so far on this minor 5. My quick back of the envelope for a minor 5 target where 5 = 3 puts it up at…2858. If this is an almost complete minor 5 now, it would seem proportionality is all messed up. That said, I am aware that 5’s can be very, very short at times. So the next big challenge I see is when what “should” be the minute 2 starts up, how do we know it’s really the minute 2…versus the start of a much larger and longer intermediate 4? I’ll be biased to the former because of my sense of proportionality but I’ll be very interested to hear how you assess it Lara. Thanks for another week of spot on projections, by the way, helped make me a little coin!
It is kinda strange but we have been seeing the pattern for quite some time. I think this is one way in which CB liquidity affects how EW waves unfold, i.e. with unnaturally brief corrections. We keep getting surprised by how short they end up being but Lara gets it right every time! 🙂
I know. Minor 2 was so very brief. But minor 4 now looks proportional to it….
I’m getting a bit nervous about predicting the end of intermediate (3) because intermediate (4) should be a pretty good pullback, lasting several weeks. Like, more than two months probably.
That’s going to be a tough call to make.
Speculative trade on SVXY Dec 1 111 strike puts for 2.00 per contract. Passing on remaining VIX 10.00 strike as spread now a bit ludicrous and order will probably not get filled at a reasonable price…
SPX on the 1 hr. candlestick chart… What do you see?
Link to a possible explanation…
http://econintersect.com/b2evolution/blog3.php/2011/06/11/the-double-triple-doji-have-we-been-warned
Lots of bearish signals in the market but they are not necessarily sell signals. At least not quite yet. The key thing I am looking for now to go all in on the short side is a decisive break of trend support simultaneously by several indices. Until that happens it’s probably not a bad idea to be prepared of more upward movement…
I’ll agree most strongly with the trend line idea Verne, and using all of the S&P, DJIA and DJT together… when they all breach trend lines that would be quite bearish.
They know the jig is up soon
I try not to take these things personally but how interesting that the spread on my VIX calls have “mysteriously” gone from 1.55/1.75 to 1.55/2.20…. 🙁
Maybe we do get that new 52 week low….
VIX has not tagged lower B band yet so holding last quarter just in case it does…
Looks like double bottom in VIX. 3/4 full position.
Verne,
What is your target price for a VIX bounce over the next few days or to end of next week?
I expect the next move higher to take out the last high at 14.51…
Verne,
S&P up 17 points and VIX at 9.75 and UVXY at 13.66. As project per Lara’s analysis, if near term target is 2617, I expect VIX to be well below $9 and UVXY to be below $12.50 by next week. If the markets continue higher, UVXY could very well be in single digits triggering yet again a reverse split. Your thoughts?
Entirely possible, but I doubt it… 😉
SPX, DJIA, RUT and NDX all at all time highs. Not too suprising for most, I guess.
Buying Dec 20 SPY 260 strike puts for 2.25 order GTC…using walk limit order to walk bid up to be filled by session close…
My current model. In subminuette 3 of minuette 5 of minute 5. A subminutte 4 should be just over the immediate event horizon. Perhaps by Wednesday/Thursday of next week, subminuette 5 takes off.
Is there any possibility this whole structure is not minute 1 of the minor 5, but instead, the complete minor 5? I.e., any possibility our labelling is one time frame too low here?
At length of (iii) = length of (v), I’ve got a target for the completed (v) at 2604, which would mean this iii needs to complete below that, then the iv, then the v reaches 2604. Of course the market may have higher intentions, and it would appear that would be a rather short final v (but not violate rules). After that, a minute 2 that could take price all the way down close to 2559, not impossible. Timing wise, that could be right about the time the tax theft plan runs into heavy turbulence, we’ll see.
I have 2634 Pivot of (v), or it’s near complete as some kind of B wave
Kevin,
I don’t see much in terms of selloff once it S&P crosses 2,600 and targets for 2,617 (near term within a week) and then 2,657 (representing fib 0.618 off the 2578 base..hope my fib ratios are making sense as I am still learning ) in short term before the year end. It is quite possible that BIG boys keep the wheels from coming off till March 2018 , hence the 2716 target zone (hoping that occurs before the year end :)). There are some timing cycles that call for some drop into 2/3 week of Jan 2018 (there is a confluence of some 20 week cycles). At or closer to this timing cycle or aforementioned ATH target point will be a good time to pick some short positions as drop will be worth it. Your thoughts?
I focus on Lara’s EW count as my primary roadmap. Timing cycles…interesting, and to my mind can be reinforcing re: the EW count, but I put the EW count way ahead of timing cycles re: my outlook. I don’t think the size of pullbacks are particularly predictable, though the EW tells us likely pullback targets, and worst case targets (w/o violating the count). Lastly, I’m a relatively short term trader, so where exactly SPX is going in a month or two doesn’t truly impact what I buy/sell today. I’m super focused on today to “next week” or so.
And what vehicle are you using the Trade the S&P waves per EW?
I use various sector/industry ETF’s that appear well set up at the time I’m looking to buy (yesterday it was XLK, XLI, NAIL). I use XIV since it has a +4-5% positive price movement per month on average independent of anything else (“most of the time”). I use particular stock issues that appear to be well valued/set up. B in the last few days is a good example. I often trade GS as I find it both reasonable volatile yet at the same time “stable” (meaning, I don’t think it’s too likely GS will suffer some kind of instant or overnight stochastic shock and open down 20%, as often happens with smaller issues and sometimes even larger ones: witness CELG recently. Yea, I’m underwater there, sadly). I use multiple vehicles to get a decent “average” ride on the EW pushes up. I’ll add, I almost never use options; I buy/sell outright. Too much complexity w/options for me and I like time on my side, not working against me (I suppose if I sold options that would be inverted, but not possible in a non-margin IRA account.) Hope that helps.
Thanks, But…
Still looking for that true or close to 1 to 1 movement with the S&P 500 so as to trade the waves per EW.
Anyone have the answer?
What’s wrong with SPY?
$259 per share, I can’t trade using 1,000 shares of that.
I refuse to only make $100 on a 10 point move.
For more leverage without time decay, you could consider UPRO and SPXU ;these are what I use when I want to directly trade SPX. However, these aren’t so good for longer term holds, as in general they will underperform relative to SPX actuals (meaning for example SPX up by 2% so you should have made 4% but if it was a long hold with lots of ups and downs…you might only make 3%!). Good for intraday and several day to perhaps a few week hold type trades. Otherwise, for yet more leverage, SPY options. On the long side however, compare the move in SPY (and UPRO and any other leveraged SPX based ETF) with the move in XIV today. In my view XIV outperforms everything else in a bull market, PARTICULARLY when you are trading off some kind of completed 2 or 4 wave, which has jacked the VIX up. Worth considering.
Thanks, I have used a couple of those. I am not satisfied with them. I will look at the others you mention that I have not looked at.
No clue, plunge protection teams global have really propped up all of the declines in the futures markets and are more aggressive and bold with their manipulation than earlier in the year. Many of my peers are throwing in the towel. Case in point; Rydex bear fund is 100 percent long. We very clearly had an impulse down off of the last high, and nothing materialized. I’m going to continue to trade Vix with a long bias and keep it to that. May short IWM soon as well. Not overthinking it.
Thanks for bringing IWM to our attention as I lost track of it but it will be a good one to watch.
And what vehicle are you using the Trade the VIX?
Option premiums are eroding very fast so have to be very careful from capital preservation perspective…
The VIX Futures contract, options on VIX futures, and Options on UVXY
Very, Very occasionally, I’ve bought puts on SVXY and bought the UVXY, but I’m not a fan of those vehicles for many reasons.
I don’t know who posted that (!!??), but it’s wrong? I’m thinking this more likely the story…
Based on the market action, I get the feeling we breach 2600 today…unreal bullishness from the momentum crowd but you got to play what market gives you… 🙁
Ah, the holiday effect lives! Doing my happy dance over buying into 5 or 6 positions yesterday while everything stood still.
Kevin,
I always pay attention to Apple when looking at market as it is leading indicator on where we are headed. It was not ready to go down for last few sessions when market indexes were hinting downtrend. Now Apple is trending up and with looming holiday season…expect more fireworks ahead as markets are now in a seasonal pattern that projects move higher into year end. I am keeping some cash on the sideline just in case we get a quick down move (not expecting but never know).
If this is all a minute 1, the minute 2 is likely to qualify as a “sharp down move”. It doesn’t appear we complete this minor 5 until towards the end of the year I ‘d guess. The intermediate 4 after that is going to be quite significant, and will send a lot of money the way of the long volatility crowd here! Maybe I’ll even join them for that, we’ll see.
Agree and hence the question to Verne (our resident expert on volatility) as the premiums erode very fast if the timing is not correct.
Timing is key. You should know within 24 hours if your vol trade is wrong and exit immediately. Not a buy and hold kind of trade, unless you are in leaps…
Me too! Happy dance.
Looks like ES invalidated triangle count….
I have watched in amazement as Germany’s Angela Merkel has charted a course of cultural and economic suicide for her nation. It has been nothing short of stunning. I suspect there is some part of the highly trained mind of a quantum physicist the rationale that importing millions of muslims into Germany would remedy the nation’s dire demographic situation. What is even more remarkable is that Germans put her back in office. We are living in strange times indeed. The litany of tragedy as a result of this insane woman’s action need not be repeated here. I do think it is all soon going to show up in DAX. Buying leaps on Germany…
btw, just wanted to clarify that my comments about Germany in no way intended to disparage any one’s particular faith. The point I am making about this is the sheer numbers makes any kind of orderly assimilation into German society impossible. In discussions with friends about this we have very sharp disagreements about whether or not cultural and religious clashes can be avoided in these circumstances and it seems to me the answer is obvious.
I’ll just add that the alternative tragedy would have been several million innocent people displaced from Syria with all nations refusing to home them. And who knows what future leaders Merkel imported for the benefit of her nation? As an example, Steve Jobs was the son of a Syrian emigrant to the US. Diversity is truly strength, even if it comes with challenges and costs.
A solution would be to take a good look at why Syria is a war zone. But that would require the west to acknowledge it’s role in the affair.
If we don’t figure out the cause, we can’t find a solution.
Patiently awaiting another move below ten for VIX. In a market this tricksy, you’ve got to pick your battles, carefully choosing the ground of engagement that gives you a distinct advantage. Of late, sub ten VIX has been leading to quite profitable forays. May it continue…eyeing 10.00 strike calls expiring in two weeks… 🙂
Dipping toe back in with both short puts and calls.
I note that XIV is opening at a new ATH and has moved from 101 to 115 in about 3 days.
Couldn’t pay me to touch XIV or SVXY long….
He! He! I hear ya! Got 1\4 full position on VIX 10 strike calls at 1.55..
Makes sense if you are bearish, and you’ve made it clear that’s your sentiment. If you are bullish, a +4-5% per month edge is simply staggering.
I’m not bullish or bearish, I trade to make money with the highest probability. Structurally, there are more risks than there have ever been present in the financial markets; and most of them are immeasurable. Further, I disdain the lack of price discovery and believe the bankster cabal has nationalized markets on purpose to later weaponize them.
Not a bad haul…! 🙂
On my futures FXCM chart, via Motivewave, Minute c of the triangle has already happened i.e. hit a level of 2568 – very different look to your chart Lara?!
Is that including after hours data Nick?
Top dog!
Oh yeah?! Sez who, Doc?!